Bayesian Support Vector Machines for Feature Ranking and Selection
Bayesian Support Vector Machines for Feature Ranking and Selection
Bayesian Support Vector Machines for Feature Ranking and Selection

You also want an ePaper? Increase the reach of your titles
YUMPU automatically turns print PDFs into web optimized ePapers that Google loves.
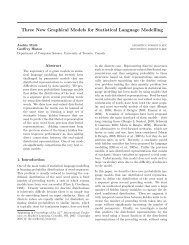
<strong>Bayesian</strong> <strong>Support</strong> <strong>Vector</strong> <strong>Machines</strong><br />
<strong>for</strong> <strong>Feature</strong> <strong>Ranking</strong> <strong>and</strong> <strong>Selection</strong><br />
Wei Chu 1 , S. Sathiya Keerthi 2 , Chong Jin Ong 3 , <strong>and</strong> Zoubin Ghahramani 1<br />
1<br />
Gatsby Computational Neuroscience Unit, University College London, London,<br />
WC1N 3AR, UK. chuwei@gatsby.ucl.ac.uk, zoubin@gatsby.ucl.ac.uk<br />
2<br />
Yahoo! Research Lab., Pasadena, CA 91105, USA.<br />
sathiya.keerthi@overture.com<br />
3<br />
Department of Mechanical Engineering, National University of Singapore,<br />
Singapore, 119260. mpeongcj@nus.edu.sg<br />
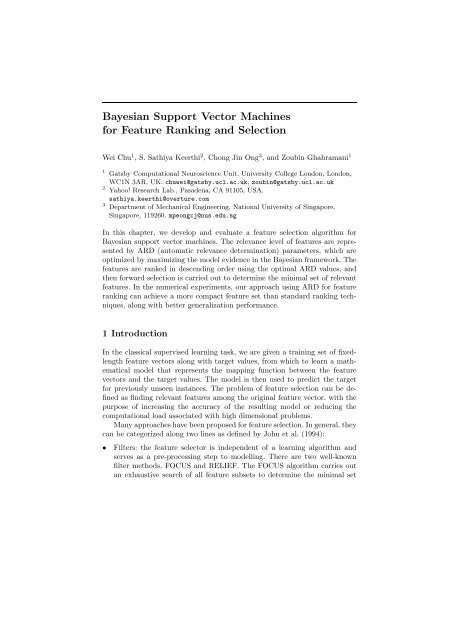
In this chapter, we develop <strong>and</strong> evaluate a feature selection algorithm <strong>for</strong><br />
<strong>Bayesian</strong> support vector machines. The relevance level of features are represented<br />
by ARD (automatic relevance determination) parameters, which are<br />
optimized by maximizing the model evidence in the <strong>Bayesian</strong> framework. The<br />
features are ranked in descending order using the optimal ARD values, <strong>and</strong><br />
then <strong>for</strong>ward selection is carried out to determine the minimal set of relevant<br />
features. In the numerical experiments, our approach using ARD <strong>for</strong> feature<br />
ranking can achieve a more compact feature set than st<strong>and</strong>ard ranking techniques,<br />
along with better generalization per<strong>for</strong>mance.<br />
1 Introduction<br />
In the classical supervised learning task, we are given a training set of fixedlength<br />
feature vectors along with target values, from which to learn a mathematical<br />
model that represents the mapping function between the feature<br />
vectors <strong>and</strong> the target values. The model is then used to predict the target<br />
<strong>for</strong> previously unseen instances. The problem of feature selection can be defined<br />
as finding relevant features among the original feature vector, with the<br />
purpose of increasing the accuracy of the resulting model or reducing the<br />
computational load associated with high dimensional problems.<br />
Many approaches have been proposed <strong>for</strong> feature selection. In general, they<br />
can be categorized along two lines as defined by John et al. (1994):<br />
• Filters: the feature selector is independent of a learning algorithm <strong>and</strong><br />
serves as a pre-processing step to modelling. There are two well-known<br />
filter methods, FOCUS <strong>and</strong> RELIEF. The FOCUS algorithm carries out<br />
an exhaustive search of all feature subsets to determine the minimal set
2 Wei Chu, S. Sathiya Keerthi, Chong Jin Ong, <strong>and</strong> Zoubin Ghahramani<br />
of features using a consistency criterion (Almuallim <strong>and</strong> Dietterich 1991).<br />
RELIEF (Kira <strong>and</strong> Rendell 1992) is a r<strong>and</strong>omized algorithm, which attempts<br />
to give each feature a weighting indicating its level of relevance to<br />
the targets.<br />
• Wrapper: this approach searches through the space of feature subsets using<br />
the estimated accuracy from a learning algorithm as the measure of the<br />
goodness <strong>for</strong> a particular feature subset (Langley <strong>and</strong> Sage 1994). This<br />
method is restricted by the time complexity of the learning algorithm,<br />
<strong>and</strong> when the number of features is large, it may become prohibitively<br />
expensive to run.<br />
There are some learning algorithms which have built-in feature selection. Jebara<br />
<strong>and</strong> Jaakkola (2000) <strong>for</strong>malized a kind of feature weighting in the maximum<br />
entropy discrimination framework, <strong>and</strong> Weston et al. (2001) introduced<br />
a method of feature selection <strong>for</strong> support vector machines by minimizing the<br />
bounds on the leave-one-out error. MacKay (1994) <strong>and</strong> Neal (1996) proposed<br />
automatic relevance determination (ARD) as a hierarchical prior over the<br />
weights in <strong>Bayesian</strong> neural networks. The weights connected to an irrelevant<br />
input can be automatically punished with a tighter prior in model adaptation,<br />
which reduces the influence of such a weight towards zero effectively. In<br />
Gaussian processes, the ARD parameters can be directly embedded into the<br />
covariance function (Williams <strong>and</strong> Rasmussen 1996) which results in a type<br />
of feature weighting.<br />
In this paper, we applied <strong>Bayesian</strong> support vector machines (BSVM) (Chu<br />
et al. 2003, 2004) with ARD techniques to select relevant features. BSVM,<br />
which is rooted in the probabilistic framework of Gaussian processes, can be<br />
regarded as a support vector variant of Gaussian processes. The sparseness in<br />
<strong>Bayesian</strong> computation helps us to tackle relatively large data sets. <strong>Bayesian</strong><br />
techniques are used to carry out model adaptation. The optimal values of<br />
the ARD parameters can be inferred intrinsically in the modelling. Relevance<br />
variables are introduced to indicate the relevance level <strong>for</strong> features. The features<br />
can then be ranked from relevant to irrelevant accordingly. In our feature<br />
selection algorithm, a <strong>for</strong>ward selection scheme is employed to determine the<br />
minimal set of relevant features.<br />
The rest of this paper is organized as follows. Section 2 reviews the techniques<br />
of BSVM to estimate the optimal values <strong>for</strong> ARD parameters. Section 3<br />
describes a <strong>for</strong>ward selection scheme as post-processing to select the minimal<br />
set of relevant features. Section 4 presents the results of numerical experiments,<br />
followed by the conclusion in Section 5.<br />
2 <strong>Bayesian</strong> Framework<br />
As computationally powerful tools <strong>for</strong> supervised learning, support vector<br />
machines (SVMs) were introduced by Boser et al. (1992), <strong>and</strong> have been widely
<strong>Bayesian</strong> <strong>Support</strong> <strong>Vector</strong> <strong>Machines</strong> <strong>for</strong> <strong>Feature</strong> <strong>Ranking</strong> <strong>and</strong> <strong>Selection</strong> 3<br />
used in classification <strong>and</strong> regression problems (Vapnik 1995). Let us suppose<br />
that a data set D = {(xi, yi)|i = 1, . . . , m} is given <strong>for</strong> training, where the<br />
feature vector xi ∈ R n <strong>and</strong> yi is the target value. In regression, the target is<br />
a real value, while in classification the target is the class label. SVMs map<br />
these feature vectors into a high dimensional reproducing kernel Hilbert space<br />
(RKHS), where the optimal values of the discriminant function {f(xi)|i =<br />
1, 2, . . . , m} can be computed by minimizing a regularized functional. The<br />
regularized functional is defined as<br />
min R(f) =<br />
f∈RKHS<br />
m<br />
i=1<br />
ℓ(yi, f(xi)) + 1<br />
C f2 RKHS, (1)<br />
where the regularization parameter C is positive, the stabilizer f2 RKHS is a<br />
norm in the RKHS <strong>and</strong> m i=1 ℓyi, f(xi) is the empirical loss term (Evgeniou<br />
et al. 1999). For various loss functions, the regularized functional (1) can be<br />
minimized by solving a convex quadratic programming optimization problem<br />
that guarantees a unique global minimum solution. In SVMs <strong>for</strong> classification<br />
(Burges 1998), hard margin, L1 soft margin <strong>and</strong> L2 soft margin loss functions<br />
are widely used. For regression, Smola <strong>and</strong> Schölkopf (1998) have discussed<br />
a lot of common loss functions, such as Laplacian, Huber’s, ɛ-insensitive <strong>and</strong><br />
Gaussian etc.<br />
1 − If we assume that a prior P(f) ∝ e C f2RKHS<br />
<strong>and</strong> a likelihood P(D|f) ∝<br />
e− m i=1 ℓ(yi,f(xi)) , the minimizer of regularized functional (1) can be directly<br />
interpreted as maximum a posteriori (MAP) estimate of the function f in<br />
the RKHS (Evgeniou et al. 1999). Due to the duality between RKHS <strong>and</strong><br />
stochastic processes (Wahba 1990), the functions f(xi) in the RKHS can also<br />
be explained as a family of r<strong>and</strong>om variables in a Gaussian process. Gaussian<br />
processes have provided a promising non-parametric <strong>Bayesian</strong> approach to<br />
classification problems (Williams <strong>and</strong> Barber 1998). The important advantage<br />
of Gaussian process models over other non-<strong>Bayesian</strong> models is the explicit<br />
probabilistic <strong>for</strong>mulation. This not only provides probabilistic class prediction<br />
but also gives the ability to infer model parameters in <strong>Bayesian</strong> framework.<br />
We follow the st<strong>and</strong>ard Gaussian process to describe a <strong>Bayesian</strong> framework,<br />
in which we impose a Gaussian process prior distribution on these functions<br />
<strong>and</strong> employ particular loss functions in likelihood evaluation. Compared with<br />
st<strong>and</strong>ard Gaussian processes, the particular loss function results in a different<br />
convex programming problem <strong>for</strong> computing MAP estimates <strong>and</strong> leads to<br />
sparseness in computation.<br />
2.1 Prior Probability<br />
The functions in the RKHS (or latent functions) are usually assumed as the<br />
realizations of r<strong>and</strong>om variables indexed by the input vector xi in a stationary<br />
zero-mean Gaussian process. The Gaussian process can then be specified by<br />
giving the covariance matrix <strong>for</strong> any finite set of zero-mean r<strong>and</strong>om variables
4 Wei Chu, S. Sathiya Keerthi, Chong Jin Ong, <strong>and</strong> Zoubin Ghahramani<br />
{f(xi)|i = 1, 2, . . . , m}. The covariance between the outputs corresponding<br />
to the inputs xi <strong>and</strong> xj can be defined by Mercer kernel functions, such as<br />
Gaussian kernel, polynomial kernels <strong>and</strong> spline kernels (Wahba 1990). We list<br />
two popular covariance functions with ARD parameters in the following:<br />
• ARD Gaussian Kernel: this is a generalization of the popular Gaussian<br />
kernel defined as<br />
<br />
Cov[f(xi), f(xj)] = κ0 exp − 1<br />
n<br />
κa,l(xi,l − xj,l)<br />
2<br />
2<br />
<br />
+ κb, (2)<br />
where l is the feature index, κ0 > 0, κa,l > 0 <strong>and</strong> κb > 0. κ0 denotes the<br />
average power of f(x) that reflects the noise level, while κb corresponds to<br />
the variance of the offset in the latent functions. 4 The ARD parameters κa,l<br />
∀l are used to indicate the relevance level of the l-th feature to the targets.<br />
Note that a relatively large ARD parameter implies that the associated<br />
feature gives more contributions to the modelling, while a feature weighted<br />
with a very small ARD parameter implies that this feature is irrelevant to<br />
the targets.<br />
• ARD Linear Kernel: this is a type of linear kernel parameterized with ARD<br />
parameters defined as<br />
Cov[f(xi), f(xj)] =<br />
where κb > 0 <strong>and</strong> κa,l > 0.<br />
l=1<br />
n<br />
κa,l xi,l xj,l + κb, (3)<br />
We collect the parameters in the covariance function (2) or (3), as θ, the<br />
hyperparameter vector. Then, <strong>for</strong> a given hyperparameter vector θ, the prior<br />
probability of the r<strong>and</strong>om variables {f(xi)} is a multivariate Gaussian, which<br />
can be simply written as<br />
P(f |θ) = 1<br />
Zf<br />
l=1<br />
exp(− 1<br />
2 f T Σ −1 f), (4)<br />
where f = [f(x1), f(x2), . . . , f(xm)] T , Zf = (2π) m<br />
2 |Σ| 1<br />
2 , <strong>and</strong> Σ is the m × m<br />
covariance matrix whose ij-th element is Cov[f(xi), f(xj)].<br />
2.2 Likelihood<br />
We usually assume that the training data are collected independently. The<br />
probability P(D|f, θ), known as the likelihood, can be evaluated by:<br />
4 In classification settings, it is possible to insert a “jitter” term in the diagonal<br />
entries of the covariance matrix, that could reflect the uncertainty in the corresponding<br />
function value.
<strong>Bayesian</strong> <strong>Support</strong> <strong>Vector</strong> <strong>Machines</strong> <strong>for</strong> <strong>Feature</strong> <strong>Ranking</strong> <strong>and</strong> <strong>Selection</strong> 5<br />
P(D|f, θ) =<br />
m<br />
P(yi|f(xi)), (5)<br />
i=1<br />
where − ln P(yi|f(xi)) is usually referred to as the loss function ℓ(yi, f(xi)).<br />
In regression problems, the discrepancy between the target value yi <strong>and</strong><br />
the associated latent function f(xi) at the input xi is evaluate by a specific<br />
noise model. Various loss functions can be used depending on the assumption<br />
on the distribution of the additive noise (Chu et al. 2004). In this paper, we<br />
focus on binary classification only.<br />
For binary classifier designs, we measure the probability of the class label yi<br />
<strong>for</strong> a given latent function f(xi) at xi as the likelihood, which is a conditional<br />
probability P(yi|f(xi)). 5 The logistic <strong>and</strong> probit functions are widely used in<br />
likelihood evaluation (Williams <strong>and</strong> Barber 1998; Neal 1997b). However these<br />
do not result in sparse solutions to the optimization problem. In order to<br />
introduce sparseness into this <strong>Bayesian</strong> framework, Chu et al. (2003) proposed<br />
a trigonometric loss function. The trigonometric loss function is defined as<br />
⎧<br />
⎨ +∞ if yi · f(xi) ∈ (−∞, −1];<br />
ℓt(yi, f(xi)) = 2 ln sec(<br />
⎩<br />
π<br />
4 (1 − yi · f(xi))) if yi · f(xi) ∈ (−1, +1); (6)<br />
0 if yi · f(xi) ∈ [+1, +∞),<br />
The trigonometric likelihood function is there<strong>for</strong>e written as<br />
⎧<br />
⎨ 0 if yi · f(xi) ∈ (−∞, −1];<br />
Pt(yi|f(xi)) = cos<br />
⎩<br />
2 ( π<br />
4 (1 − yi · f(xi))) if yi · f(xi) ∈ (−1, +1);<br />
1 if yi · f(xi) ∈ [+1, +∞).<br />
Note that Pt(yi = +1|f(xi)) + Pt(yi = −1|f(xi)) = 1 always holds <strong>for</strong> any<br />
value of f(xi), <strong>and</strong> the trigonometric loss function possesses a flat zero region<br />
that is the same as the L1 <strong>and</strong> L2 loss functions in support vector machines.<br />
2.3 Posterior Probability<br />
Based on Bayes’ theorem, the posterior probability of f can then be written<br />
as<br />
P(f |D, θ) = 1<br />
exp (−S(f)) , (8)<br />
ZS<br />
where S(f) = 1<br />
2f T Σ−1f + n i=1 ℓ(yi, f(xi)), ℓ(·) is the loss function we used<br />
<strong>and</strong> ZS = exp(−S(f)) df. Since P(f|D, θ) ∝ exp(−S(f)), the Maximum<br />
A Posteriori (MAP) estimate on the values of f is there<strong>for</strong>e the minimizer of<br />
the following optimization problem:<br />
5 Here, yi is a discrete r<strong>and</strong>om variable, <strong>and</strong> the sum of the probabilities <strong>for</strong> all<br />
possible cases of yi should be equal to 1, i.e. <br />
y i P(yi|f(xi)) = 1, which is referred<br />
to as the normalization requirement.<br />
(7)
6 Wei Chu, S. Sathiya Keerthi, Chong Jin Ong, <strong>and</strong> Zoubin Ghahramani<br />
min<br />
f S(f) = 1<br />
2 f T Σ −1 f +<br />
m<br />
ℓ(yi, f(xi)). (9)<br />
This is a regularized functional. For any differentiable loss function, the solution<br />
of the regularization functional S(f), is always a linear superposition of<br />
covariance functions, one <strong>for</strong> each data point. This elegant <strong>for</strong>m of a minimizer<br />
of (9) is also known as the representer theorem (Kimeldorf <strong>and</strong> Wahba 1971).<br />
A generalized representer theorem can be found in Schölkopf et al. (2001),<br />
in which the loss function is merely required to be a strictly monotonically<br />
increasing function ℓ : R → [0, +∞).<br />
2.4 MAP Estimate<br />
Introducing the trigonometric loss function (6) into the regularized functional<br />
of (9), the optimization problem (9) can be then restated as the following<br />
equivalent optimization problem, which we refer to as the primal problem:<br />
min<br />
f,ξ<br />
1<br />
2 f T Σ −1 f + 2<br />
m<br />
i=1<br />
i=1<br />
<br />
π<br />
ln sec<br />
4 ξi<br />
<br />
(10)<br />
subject to yi·f(xi) ≥ 1−ξi <strong>and</strong> 0 ≤ ξi < 2, ∀i. St<strong>and</strong>ard Lagrangian techniques<br />
(Fletcher 1987) are used to derive the dual problem. The dual problem can<br />
be finally simplified as<br />
min<br />
α<br />
1<br />
2<br />
m m<br />
m<br />
(yiαi)(yjαj)Cov [f(xi), f(xj)] −<br />
i=1 j=1<br />
i=1<br />
m<br />
<br />
4<br />
+ n<br />
π αi<br />
<br />
2 (11)<br />
2αi<br />
2αi<br />
arctan − ln 1 +<br />
π<br />
π<br />
i=1<br />
subject to αi ≥ 0, ∀i. Refer to Chu et al. (2003) <strong>for</strong> the derivation details.<br />
The dual problem (11) is a convex programming problem. The popular<br />
SMO algorithm <strong>for</strong> classical SVMs (Platt 1999; Keerthi et al. 2001) can be<br />
easily adapted to solve the optimization problem (Chu et al. 2003). The MAP<br />
estimate on the values of the r<strong>and</strong>om variables f can be written in column<br />
vector <strong>for</strong>m as<br />
f MP = Σ · υ (12)<br />
where υ = [y1α1, y2α2, . . . , ymαm] T . The training samples (xi, yi) associated<br />
with non-zero Lagrange multiplier αi are called support vectors (SVs). The<br />
other samples associated with zero αi do not involve in the solution representation<br />
<strong>and</strong> the following <strong>Bayesian</strong> computation. This property is usually<br />
referred to as sparseness, <strong>and</strong> it reduces the computational cost significantly.<br />
αi
<strong>Bayesian</strong> <strong>Support</strong> <strong>Vector</strong> <strong>Machines</strong> <strong>for</strong> <strong>Feature</strong> <strong>Ranking</strong> <strong>and</strong> <strong>Selection</strong> 7<br />
2.5 Hyperparameter Inference<br />
The hyperparameter vector θ contains the ARD parameters <strong>and</strong> other parameters<br />
in the covariance function. The optimal values of hyperparameters<br />
θ can be inferred by maximizing the posterior probability P(θ|D), using<br />
P(θ|D) = P(D|θ)P(θ)/P(D). The prior distribution on the hyperparameters<br />
P(θ) can be specified by domain knowledge. As we typically have little idea<br />
about the suitable values of θ be<strong>for</strong>e training data are available, we usually<br />
assume a flat distribution <strong>for</strong> P(θ), i.e., P(θ) is greatly insensitive to the values<br />
of θ. There<strong>for</strong>e, P(D|θ) (which is known as the evidence of θ) can be used<br />
to assign a preference to alternative values of the hyperparameters θ (MacKay<br />
1992).<br />
The evidence is given by an integral over all f: P(D|θ) = P(D|f, θ)P(f|θ) df.<br />
Using the definitions in (4) <strong>and</strong> (5), the evidence can also be written as<br />
P(D|θ) = 1<br />
<br />
exp(−S(f)) df, (13)<br />
Zf<br />
where S(f) is defined as in (8). A major technical difficulty is the difficulty<br />
of computing the evidence as a high dimensional integral. So far, a variety of<br />
approximation techniques have been discussed: Monte Carlo sampling (Neal<br />
1997a), the MAP approach (Williams <strong>and</strong> Barber 1998), bounds on the likelihood<br />
(Gibbs 1997) <strong>and</strong> mean field approaches (Opper <strong>and</strong> Winther 2000;<br />
Csató et al. 2000). Recently, Kim <strong>and</strong> Ghahramani (2003) coupled the Expectation<br />
Propagation algorithm (Minka 2001) with variational methods (Seeger<br />
1999) <strong>for</strong> evidence maximization. To maintain the sparseness in <strong>Bayesian</strong> computation,<br />
we apply Laplace approximation at the MAP estimate. The evidence<br />
(13) could be calculated by an explicit <strong>for</strong>mula, <strong>and</strong> then hyperparameter inference<br />
can be done by gradient-based optimization methods.<br />
The marginalization can be done analytically by considering the Taylor<br />
expansion of S(f) around its minimum S(f MP), <strong>and</strong> retaining terms up to<br />
the second order. Since the first order derivative with respect to f at the MAP<br />
point f MP is zero, S(f) can be written as<br />
S(f) ≈ S(f MP) + 1<br />
2 (f − f MP) T<br />
<br />
∂ 2 S(f)<br />
∂f∂f T<br />
<br />
<br />
<br />
f=f MP<br />
<br />
(f − f MP), (14)<br />
where ∂2 S(f)<br />
∂f∂f T = Σ −1 + Λ, <strong>and</strong> Λ is a diagonal matrix coming from the second<br />
order derivative of the loss function we used. Introducing (14) into (13) yields<br />
1 − P(D|θ) = exp(−S(f MP)) · |I + Σ · Λ| 2 ,<br />
where I is the m × m identity matrix. Note that, when the trigonometric<br />
loss function (6) is employed, only a sub-matrix of Σ plays a role in the<br />
determinant |I + Σ · Λ| due to the sparseness of the diagonal matrix Λ in<br />
which only the entries associated with SVs are non-zero. We denote their submatrices<br />
as ΣM <strong>and</strong> ΛM respectively by keeping their non-zero entries. The
8 Wei Chu, S. Sathiya Keerthi, Chong Jin Ong, <strong>and</strong> Zoubin Ghahramani<br />
MAP estimate of f (12) on support vectors can also be simplified as ΣM · υM,<br />
where υM denotes the sub-vector of υ by keeping entries associated with SVs.<br />
Because of these sparseness properties, the negative log of the evidence can<br />
then be simplified as follows<br />
− ln P(D|θ) = 1<br />
2 υT M ·ΣM ·υM +2 <br />
v∈SVs<br />
<br />
π<br />
ln sec<br />
4 ξv<br />
<br />
+ 1<br />
2 ln |I+ΣM ·ΛM|, (15)<br />
where I is the identity matrix with the size of SVs, “v ∈ SVs” denotes that v<br />
is varied over the index set of SVs, <strong>and</strong> ξv = 1−yv ·fMP(xv), ∀v. The evidence<br />
evaluation is a convenient yardstick <strong>for</strong> model selection. It is straight<strong>for</strong>ward<br />
to consider the posterior distribution P(θ|D) ∝ P(D|θ)P(θ) by specifying a<br />
particular prior distribution P(θ). The gradient of − ln P(θ|D) with respect<br />
to the variables in the hyperparameter vector θ can be explicitly derived<br />
(see Chu et al. (2003) <strong>for</strong> the detailed derivatives), <strong>and</strong> then gradient-based<br />
optimization methods can be used to find the minimum locally.<br />
The optimization method usually requests evidence evaluation at tens of<br />
different θ be<strong>for</strong>e the minimum is found. For each θ, a quadratic programming<br />
problem should be solved first to find MAP estimate, <strong>and</strong> then the approximate<br />
evidence (15) is calculated along with its gradients with respect to the<br />
hyperparameters. Due to the sparseness, the quadratic programming problem<br />
costs almost the same time as SVMs at the scale about O(m 2.2 ), where m<br />
is the size of training data. In gradient evaluations <strong>for</strong> ARD parameters, the<br />
inversion of the matrix ΣM, corresponding to SVs at the MAP estimate, is<br />
required that costs time at O(s 3 ) <strong>for</strong> each feature, where s is the number of<br />
SVs that is usually much less than m.<br />
3 Post-processing <strong>for</strong> <strong>Feature</strong> <strong>Selection</strong><br />
The generalization per<strong>for</strong>mance of BSVM with ARD techniques are very competitive<br />
(Chu et al. 2003). In practical applications, it might be desirable to<br />
further select a minimal subset of relevant features <strong>for</strong> modelling while keeping<br />
the accuracy of the resulting model <strong>and</strong> reducing the computational load.<br />
In this section, we describe our method <strong>for</strong> feature selection based on the<br />
techniques described in the previous section. The task of feature selection can<br />
be tackled in two steps:<br />
1. The original features can be ranked in descending order using the optimal<br />
values of the ARD parameters {κl a} m l=1 we inferred (see Section 3.1).<br />
2. Then a subset of the top features in the rank is used as the relevant features<br />
<strong>for</strong> modelling. The minimal subset can be determined by the validation<br />
per<strong>for</strong>mance of the learning machine (see Section 3.2).
<strong>Bayesian</strong> <strong>Support</strong> <strong>Vector</strong> <strong>Machines</strong> <strong>for</strong> <strong>Feature</strong> <strong>Ranking</strong> <strong>and</strong> <strong>Selection</strong> 9<br />
3.1 <strong>Feature</strong> <strong>Ranking</strong><br />
We first introduce a set of relevance variables {ri } n i=1 <strong>for</strong> the features we are<br />
given, which are extracted from the ARD parameters by normalizing them:<br />
r i =<br />
κa,i<br />
n j=1 κa,j<br />
. (16)<br />
The relevance variable indicates the relevance level of the feature to the targets,<br />
which is independent of the overall scale of ARD parameters.<br />
Since there might be several local minima on the curve of − ln P(θ|D), it is<br />
possible that the optimization problem is stuck at local minima in the determination<br />
of θ. 6 We may reduce the impact of this problem by minimizing (15)<br />
several times starting from several different initial states, <strong>and</strong> simply choosing<br />
the one with the highest evidence as our preferred choice <strong>for</strong> θ. We can<br />
also organize these c<strong>and</strong>idates together to represent the evidence distribution<br />
that might reduce the uncertainty with respect to the hyperparameters. An<br />
approximation scheme is described in the following.<br />
Suppose we started from several different initial states, <strong>and</strong> reached several<br />
minima θ ∗ τ of the optimization problem (15). We simply assume that the underlying<br />
distribution is a superposition of individual distributions with mean<br />
θ ∗ τ . The underlying distribution P(θ|D) is roughly reconstructed as<br />
with<br />
P(θ|D) ≈<br />
wτ =<br />
t<br />
wτ Pτ (θ; θ ∗ τ ) (17)<br />
τ=1<br />
P(θ∗ τ |D)<br />
t ι=1 P(θ∗ , (18)<br />
ι |D)<br />
where t is the number of the minima we have discovered by gradient descent<br />
methods, <strong>and</strong> Pτ (θ; θ ∗ τ ) denotes the individual distribution which can be any<br />
distribution with the mean θ ∗ τ . The values of P(θ ∗ τ |D) have been obtained<br />
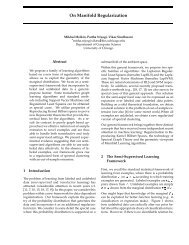
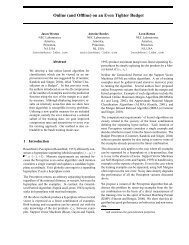
from the functional (15) already. In Figure 1, we present a simple case as an<br />
illustration.<br />
We can evaluate the expected values of the relevance variables based on<br />
the approximated P(θ|D) (17) as follows<br />
ˆr i ≈<br />
t<br />
wτ r i τ , (19)<br />
τ=1<br />
where r i τ is defined as in (16) at the minimum θ ∗ τ . This is not an approximation<br />
designed <strong>for</strong> the posterior mean of the relevance variables, but helpful to<br />
overcome the difficulty caused by the poor minima. Using these values { ˆ r i } d i=1 ,<br />
we can sort the features in descending order from relevant to irrelevant.<br />
6 Monte Carlo sampling methods can provide a good approximation on the posterior<br />
distribution, but might be prohibitively expensive to use <strong>for</strong> high-dimensional<br />
problems.
10 Wei Chu, S. Sathiya Keerthi, Chong Jin Ong, <strong>and</strong> Zoubin Ghahramani<br />
Probability<br />
0.35<br />
0.3<br />
0.25<br />
0.2<br />
0.15<br />
0.1<br />
0.05<br />
Approximated P(θ|D)<br />
* 2<br />
w ⋅ N(θ ,σ )<br />
1 1<br />
Approximated P(θ|D)<br />
* 2<br />
w ⋅ N(θ ,σ )<br />
2 2<br />
*<br />
θ<br />
1<br />
*<br />
θ2<br />
0<br />
−4 −3 −2 −1 0<br />
θ<br />
1 2 3 4<br />
Fig. 1. An illustration on the reconstructed curve <strong>for</strong> the posterior distribution<br />
P(θ|D). θ ∗ 1 <strong>and</strong> θ ∗ 2 are the two maxima we found by gradient descent methods. The<br />
underlying distribution P(θ|D) can be simply approximated as the superposition of<br />
two individual distributions (dotted curves) with mean θ ∗ 1 <strong>and</strong> θ ∗ 2 respectively. The<br />
weights w1 <strong>and</strong> w2 <strong>for</strong> the two distributions are defined as in (18). In this graph,<br />
Gaussian distributions with same variance were used as individual distribution.<br />
3.2 <strong>Feature</strong> <strong>Selection</strong><br />
Given any learning algorithm, we can select a minimal subset of relevant features<br />
by carrying out cross validation experiments on progressively larger sets<br />
of features, adding one feature at a time ordered by their relevance variables<br />
ˆri. 7 Let S denote the set of relevant features being investigated. The features<br />
top-ranked according to ˆ r i defined as in (19) are added into the set S one by<br />
one, <strong>and</strong> the validation error is calculated. This procedure is repeated as long<br />
as adding the next top-ranked feature into S does not increase the validation<br />
error significantly. This feature set S is then used along with all the training<br />
data <strong>for</strong> modelling.<br />
3.3 Discussion<br />
RELIEF (Kira <strong>and</strong> Rendell 1992) also attempts to specify relevance level<br />
<strong>for</strong> features, but the ARD techniques (MacKay 1994; Neal 1996) can carry<br />
out <strong>Bayesian</strong> inference systematically. In our approach, the per<strong>for</strong>mance of<br />
7 The relevance variables of useless features are usually much less than the average<br />
level 1/n, where n is the total number of features.
<strong>Bayesian</strong> <strong>Support</strong> <strong>Vector</strong> <strong>Machines</strong> <strong>for</strong> <strong>Feature</strong> <strong>Ranking</strong> <strong>and</strong> <strong>Selection</strong> 11<br />
Table 1. The outline of our algorithm <strong>for</strong> feature selection.<br />
<strong>Ranking</strong> employ a kind of ARD kernel<br />
r<strong>and</strong>omly select starting points θ0 <strong>for</strong> Optimization Package<br />
while Optimization Package requests evidence/gradient evaluation at θ<br />
solve (11) by convex programming to find MAP estimate<br />
evaluate the approximate evidence (13)<br />
calculate the gradients with respect to θ<br />
return evidence/gradient to the optimization package<br />
Optimization Package returns the optimal θ ∗<br />
compute the relevance variables defined as in (19)<br />
ranking the features in descending order<br />
<strong>Selection</strong> initialize validation error to infinity, <strong>and</strong> k = 0<br />
do<br />
k = k + 1<br />
use the top k features as input vector to a learning algorithm<br />
carry out cross validation via grid searching on model parameters<br />
pick up the best validation error<br />
while validation error is not increasing significantly<br />
Exit return the top k − 1 features as the minimal subset.<br />
a learning algorithm is used as the criterion to decide the minimal subset;<br />
this is analogous to the wrapper approach (Langley <strong>and</strong> Sage 1994). The key<br />
difference is that we only check the subsets including the top-ranked feature<br />
sequentially rather than search through the huge space of feature subsets.<br />
A potential problem may be caused by correlations between features. Such<br />
correlations introduce dependencies into the ARD variables. More exactly, at<br />
the minima, correlated features may share their ARD values r<strong>and</strong>omly. This<br />
makes it difficult to distinguish relevant features based on their ARD values<br />
alone. In this case, we suggest a backward elimination process (Guyon<br />
et al. 2002). This process begins with the full set <strong>and</strong> remove the most irrelevant<br />
feature one by one. At each step, we carry out inference on the reduced<br />
dataset to update their relevance variables. This procedure is computationally<br />
expensive, since it requires per<strong>for</strong>ming hyperparameter inference m times.<br />
4 Numerical Experiments<br />
We give an outline of the algorithm <strong>for</strong> feature selection in Table 1. 8 The<br />
feature vectors with continuous elements were normalized to have zero mean<br />
<strong>and</strong> unit variance coordinate-wise. The ARD parameters were used <strong>for</strong> feature<br />
weighting. The initial value of the hyperparameters were chosen as κ0 = 1.0<br />
8 The source code of <strong>Bayesian</strong> support vector machines in ANSI C can be accessed<br />
at http://guppy.mpe.nus.edu.sg/∼chuwei/btsvc.htm.
12 Wei Chu, S. Sathiya Keerthi, Chong Jin Ong, <strong>and</strong> Zoubin Ghahramani<br />
Table 2. NIPS 2003 challenge results we submitted. “Score” denotes the<br />
score used to rank the results by the organizers (times 100). “BER” denotes balanced<br />
error rate (in percent). “AUC” is the area under the ROC curve (times 100).<br />
“Feat” is percent of features used. “Probe” is the percent of probes found in the<br />
subset selected. “Test” is the result of the comparison with the best entry using the<br />
MacNemar test.<br />
Dec. 1 st<br />
Our challenge entry The winning challenge entry<br />
Dataset Score BER AUC Feat Probe Score BER AUC Feat Probe Test<br />
Overall 15.27 9.43 95.70 67.53 38.03 88.00 6.84 97.22 80.3 47.8 0.6<br />
Arcene 78.18 15.17 91.52 100 30 98.18 13.30 93.48 100.0 30.0 0<br />
Dexter -21.82 6.35 98.57 36.04 60.15 96.36 3.90 99.01 1.5 12.9 1<br />
Dorothea -25.45 15.47 92.06 100 50 98.18 8.54 95.92 100.0 50.0 1<br />
Gisette -47.27 2.62 99.67 100 50 98.18 1.37 98.63 18.3 0.0 1<br />
Madelon 100.00 7.17 96.95 1.6 0.0 100.00 7.17 96.95 1.6 0.0 0<br />
<strong>and</strong> κb = 10.0. We tried ten times starting from different values of κl a to maximize<br />
the evidence by gradient descent methods. 9 The ten maxima we found<br />
are used to estimate the values of the relevance variables as in (19). In the<br />
<strong>for</strong>ward feature selection, SVMs with Gaussian kernel, exp(− κ<br />
2 xi − xj2 ),<br />
was used as the learning algorithm. Grid search in the parameter space<br />
spanned by the κ in the Gaussian kernel <strong>and</strong> the regularization factor C<br />
as in (1), was carried out to locate the best validation output. The primary<br />
grid search was done on a 7 × 7 coarse grid linearly spaced in the region<br />
{(log10 C, log10 κ)| − 0.5 ≤ log10 C ≤ 2.5, −3 ≤ log10 κ ≤ 0}, followed by a fine<br />
search on a 9 × 9 uni<strong>for</strong>m grid linearly spaced by 0.1 in the (log10 C, log10 κ)<br />
space. At each node in this grid, 5-fold cross validation was repeated ten times<br />
to reduce the bias in fold generations, <strong>and</strong> the validation errors were averaged<br />
over all the trials.<br />
The NIPS 2003 challenge results we submitted are reported in Table 2. On<br />
the Madelon data set, we carried out feature selection as described in Table<br />
1. For other datasets, we submitted the predictive results of linear SVMs with<br />
L1 loss function without strict feature selection at that time. 10 The “AUC”<br />
per<strong>for</strong>mance of our entry is competitive with that of the winning entry.<br />
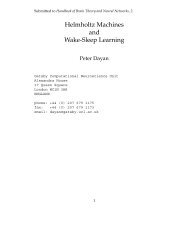
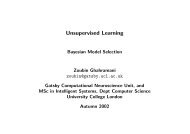
The Madelon task11 is to categorize r<strong>and</strong>om data into two classes. There<br />
are 2000 samples <strong>for</strong> training <strong>and</strong> 1800 samples <strong>for</strong> test. Each sample has 500<br />
features. In Figure 2, we present the top 13 features ranked by the estimated<br />
values of relevance variables. The per<strong>for</strong>mance of 5-fold cross validation (SVMs<br />
with L1 loss function <strong>and</strong> Gaussian kernel was used) is presented in the right<br />
9<br />
The number of the minima should be large enough to reproduce the results<br />
stably.<br />
10<br />
On the Dexter dataset, we simply removed the features with zero weight in the<br />
optimal linear SVMs, <strong>and</strong> then retrained linear SVMs on the reduced data.<br />
11<br />
The data set can be found at http://clopinet.com/isabelle/Projects/NIPS2003/.
Relevance Variable<br />
0.2<br />
0.15<br />
0.1<br />
0.05<br />
<strong>Bayesian</strong> <strong>Support</strong> <strong>Vector</strong> <strong>Machines</strong> <strong>for</strong> <strong>Feature</strong> <strong>Ranking</strong> <strong>and</strong> <strong>Selection</strong> 13<br />
Top−ranked <strong>Feature</strong>s by Relevance Variable<br />
0.25<br />
379<br />
319<br />
456<br />
106 242<br />
154<br />
434 282<br />
0<br />
0 5<br />
<strong>Feature</strong> Rank<br />
10 15<br />
Error Rate<br />
0.5<br />
0.4<br />
0.3<br />
0.2<br />
Cross Validation Error Rate<br />
0.1<br />
0 5 10 15<br />
Number of Top−ranked <strong>Feature</strong>s<br />
Fig. 2. The result on Madelon data set <strong>for</strong> our algorithm. The values of relevance<br />
variables ˆr i <strong>for</strong> the top 13 features are presented in the left part along with the<br />
feature indices, while the validation error rates are plotted in the right part.<br />
Fisher Score<br />
0.25<br />
0.2<br />
0.15<br />
0.1<br />
Top−ranked <strong>Feature</strong>s by Fisher Score<br />
476<br />
242<br />
337<br />
65<br />
129 339<br />
379<br />
473<br />
106<br />
49 443 454<br />
494<br />
0.05<br />
0 5 10<br />
<strong>Feature</strong> Rank<br />
15 20<br />
Error Rate<br />
0.5<br />
0.4<br />
0.3<br />
0.2<br />
Cross Validation Error Rate<br />
0.1<br />
0 5 10 15 20<br />
Number of Top−ranked <strong>Feature</strong>s<br />
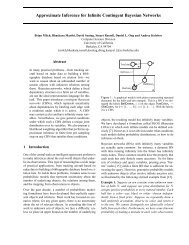
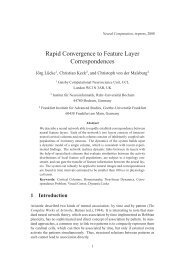
Fig. 3. The result on Madelon data set using fisher score <strong>for</strong> feature ranking. The<br />
fisher scores of the 13 top-ranked features are presented in the left part along with<br />
the feature indices, while the validation error rates are plotted in the right part.<br />
part of Figure 2. In the challenge, we selected the top 8 features <strong>for</strong> modelling,<br />
<strong>and</strong> built up SVMs using ARD Gaussian kernel with fixed relevance variables<br />
shown in the left part of Figure 2. Cross validation was carried out to decide<br />
the optimal regularization factor <strong>and</strong> the common scale parameter in the<br />
Gaussian kernel. The blind test on the 1800 samples got 7.17% error rate.<br />
This entry was assigned the highest score by the organizers.<br />
In the next experiment, the popular Fisher score was used in feature ranking<br />
<strong>for</strong> comparison purpose. The Fisher score (Golub et al. 1999) is defined<br />
as<br />
si = |µi,+ − µi,−|<br />
, (20)<br />
σi,+ + σi,−<br />
where µi,+ <strong>and</strong> σi,+ are the mean <strong>and</strong> st<strong>and</strong>ard deviation of the i-th feature<br />
on the positive samples, while µi,− <strong>and</strong> σi,− are of the negative samples. In
14 Wei Chu, S. Sathiya Keerthi, Chong Jin Ong, <strong>and</strong> Zoubin Ghahramani<br />
Figure 3, the top-ranked features by their Fisher score (20) are presented in<br />
the left graph, <strong>and</strong> the validation error rate using the top-ranked features<br />
incrementally are presented in the right graph. The best validation result is<br />
about 0.18 using 12 features, which is much worse than the result of our<br />
algorithm as shown in Figure 2.<br />
5 Conclusion<br />
In this chapter, we embedded automatic relevance determination in <strong>Bayesian</strong><br />
support vector machines to evaluate feature relevance. The <strong>Bayesian</strong> framework<br />
provides various computational procedures <strong>for</strong> hyperparameter inference<br />
which can be used <strong>for</strong> feature selection. The sparseness property introduced<br />
by our loss function (6) helps us to tackle relatively large data sets. A <strong>for</strong>ward<br />
selection method is used to determine the minimal subset of in<strong>for</strong>mative<br />
features. Overall we have a probabilistic learning algorithm with built-in feature<br />
selection that selects in<strong>for</strong>mative features automatically. The results of<br />
numerical experiments show that this approach can achieve quite compact<br />
feature sets, <strong>and</strong> achieve good generalization per<strong>for</strong>mance.<br />
Acknowledgment<br />
This work was supported by the National Institutes of Health <strong>and</strong> its National<br />
Institute of General Medical Sciences division under Grant Number 1 P01<br />
GM63208 (NIH/NIGMS grant title: Tools <strong>and</strong> Data Resources in <strong>Support</strong> of<br />
Structural Genomics).<br />
References<br />
Almuallim, H. <strong>and</strong> T. G. Dietterich. Learning with many irrelevant features. In<br />
Proc. AAAI-91, pages 547–552. MIT Press, 1991.<br />
Boser, B., I. Guyon, <strong>and</strong> V. N. Vapnik. A training algorithm <strong>for</strong> optimal margin<br />
classifier. In Fifth Annual Workshop on Computational Learning Theory, pages<br />
144–152, Pittsburgh, USA, 1992.<br />
Burges, C. J. C. A tutorial on support vector machines <strong>for</strong> pattern recogintion. Data<br />
Mining <strong>and</strong> Knowledge Discovery, 2(2):121–167, 1998.<br />
Chu, W., S. S. Keerthi, <strong>and</strong> C. J. Ong. <strong>Bayesian</strong> trigonometric support vector<br />
classifier. Neural Computation, 15(9):2227–2254, 2003.<br />
Chu, W., S. S. Keerthi, <strong>and</strong> C. J. Ong. <strong>Bayesian</strong> support vector regression using a<br />
unified loss function. IEEE transactions on neural networks, 15(1):29–44, 2004.<br />
Csató, L., E. Fokoué, M. Opper, B. Schottky, <strong>and</strong> O. Winther. Efficient approaches<br />
to Gaussian process classification. In Advances in Neural In<strong>for</strong>mation Processing<br />
Systems, volume 12, pages 251–257, 2000.
<strong>Bayesian</strong> <strong>Support</strong> <strong>Vector</strong> <strong>Machines</strong> <strong>for</strong> <strong>Feature</strong> <strong>Ranking</strong> <strong>and</strong> <strong>Selection</strong> 15<br />
Evgeniou, T., M. Pontil, <strong>and</strong> T. Poggio. A unified framework <strong>for</strong> regularization<br />
networks <strong>and</strong> support vector machines. A.I. Memo 1654, MIT, 1999.<br />
Fletcher, R. Practical methods of optimization. John Wiley <strong>and</strong> Sons, 1987.<br />
Gibbs, M. N. <strong>Bayesian</strong> Gaussian Processes <strong>for</strong> Regression <strong>and</strong> Classification. Ph.D.<br />
thesis, University of Cambridge, 1997.<br />
Golub, T., D. Slonim, P. Tamaya, C. Huard, M. Gaasenbeek, J. Mesirov, H. Coller,<br />
M. Loh, J. Downing, M. Caligiuri, C. Bloomfield, <strong>and</strong> E. L<strong>and</strong>er. Molecular<br />
classification of cancer: Class discovery <strong>and</strong> class prediction by gene expression<br />
monitoring. Science, 286:531–537, 1999.<br />
Guyon, I., J. Weston, <strong>and</strong> S. Barnhill. Gene selection <strong>for</strong> cancer classification using<br />
support vector machines. Machine Learning, 46:389–422, 2002.<br />
Jebara, T. S. <strong>and</strong> T. S. Jaakkola. <strong>Feature</strong> selection <strong>and</strong> dualities in maximum<br />
entropy discrimination. In Uncertainty in Artificial Intelligence: Proceedings of<br />
the Sixteenth Conference (UAI-2000), pages 291–300, San Francisco, CA, 2000.<br />
Morgan Kaufmann Publishers.<br />
John, G., R. Kohavi, <strong>and</strong> K. Pfleger. Irrelevant features <strong>and</strong> the subset selection<br />
problem. In Proc. ML-94, pages 121–129. Morgan Kaufmann Publishers, 1994.<br />
Keerthi, S. S., S. K. Shevade, C. Bhattacharyya, <strong>and</strong> K. R. K. Murthy. Improvements<br />
to Platt’s SMO algorithm <strong>for</strong> SVM classifier design. Neural Computation, 13<br />
(3):637–649, March 2001.<br />
Kim, H. <strong>and</strong> Z. Ghahramani. The EM-EP algorithm <strong>for</strong> Gaussian process classification.<br />
In Proc. of the Workshop on Probabilistic Graphical Models <strong>for</strong> Classification<br />
(at ECML), 2003.<br />
Kimeldorf, G. S. <strong>and</strong> G. Wahba. Some results on Tchebycheffian spline function.<br />
Journal of Mathematical Analysis <strong>and</strong> Applications, 33:82–95, 1971.<br />
Kira, K. <strong>and</strong> L. A. Rendell. The feature selection problem: Traditional methods<br />
<strong>and</strong> a new algorithm. In Proc. AAAI-92, pages 129–134. MIT Press, 1992.<br />
Langley, P. <strong>and</strong> S. Sage. Induction of selective <strong>Bayesian</strong> classifiers. In Proc. UAI-94,<br />
pages 399–406. Morgan Kaufmann, 1994.<br />
MacKay, D. J. C. A practical <strong>Bayesian</strong> framework <strong>for</strong> back propagation networks.<br />
Neural Computation, 4(3):448–472, 1992.<br />
MacKay, D. J. C. <strong>Bayesian</strong> methods <strong>for</strong> backpropagation networks. Models of Neural<br />
Networks III, pages 211–254, 1994.<br />
Minka, T. P. A family of algorithm <strong>for</strong> approximate <strong>Bayesian</strong> inference. Ph.D.<br />
thesis, Massachusetts Institute of Technology, January 2001.<br />
Neal, R. M. <strong>Bayesian</strong> Learning <strong>for</strong> Neural Networks. Lecture Notes in Statistics.<br />
Springer, 1996.<br />
Neal, R. M. Monte Carlo implementation of Gaussian process models <strong>for</strong> <strong>Bayesian</strong><br />
regression <strong>and</strong> classification. Technical Report No. 9702, Department of Statistics,<br />
University of Toronto, 1997a.<br />
Neal, R. M. Regression <strong>and</strong> classification using Gaussian process priors (with discussion).<br />
In Bernerdo, J. M., J. O. Berger, A. P. Dawid, <strong>and</strong> A. F. M. Smith,<br />
editors, <strong>Bayesian</strong> Statistics, volume 6, 1997b.<br />
Opper, M. <strong>and</strong> O. Winther. Gaussian processes <strong>for</strong> classification: mean field algorithm.<br />
Neural Computation, 12(11):2655–2684, 2000.<br />
Platt, J. C. Fast training of support vector machines using sequential minimal optimization.<br />
In Schölkopf, B., C. J. C. Burges, <strong>and</strong> A. J. Smola, editors, Advances<br />
in Kernel Methods - <strong>Support</strong> <strong>Vector</strong> Learning, pages 185–208. MIT Press, 1999.
16 Wei Chu, S. Sathiya Keerthi, Chong Jin Ong, <strong>and</strong> Zoubin Ghahramani<br />
Schölkopf, B., R. Herbrich, <strong>and</strong> A. J. Smola. A generalized representer theorem. In<br />
Proc. of the Annual Conference on Computational Learning Theory, 2001.<br />
Seeger, M. <strong>Bayesian</strong> model selection <strong>for</strong> support vector machines, Gaussian processes<br />
<strong>and</strong> other kernel classifiers. In Advances in Neural In<strong>for</strong>mation Processing<br />
Systems, volume 12, 1999.<br />
Smola, A. J. <strong>and</strong> B. Schölkopf. A tutorial on support vector regression. Technical<br />
Report NC2-TR-1998-030, GMD First, October 1998.<br />
Vapnik, V. N. The Nature of Statistical Learning Theory. New York: Springer-<br />
Verlag, 1995.<br />
Wahba, G. Spline Models <strong>for</strong> Observational Data, volume 59 of CBMS-NSF Regional<br />
Conference Series in Applied Mathematics. SIAM, 1990.<br />
Weston, J., S. Mukherjee, O. Chapelle, M. Pontil, <strong>and</strong> T. Poggio. <strong>Feature</strong> selection<br />
in SVMs. In Leen, T., T. Dietterich, <strong>and</strong> V. Tresp, editors, Advances in Neural<br />
In<strong>for</strong>mation Processing Systems, volume 13, 2001. MIT Press.<br />
Williams, C. K. I. <strong>and</strong> D. Barber. <strong>Bayesian</strong> classification with Gaussian processes.<br />
IEEE Transactions on Pattern Analysis <strong>and</strong> Machine Intelligence, 20(12):1342–<br />
1351, 1998.<br />
Williams, C. K. I. <strong>and</strong> C. E. Rasmussen. Gaussian processes <strong>for</strong> regression. In<br />
Touretzky, D. S., M. C. Mozer, <strong>and</strong> M. E. Hasselmo, editors, Advances in Neural<br />
In<strong>for</strong>mation Processing Systems, volume 8, pages 598–604, 1996. MIT Press.