Pro-Environmental Behavior and Rational Consumer Choice
Pro-Environmental Behavior and Rational Consumer Choice
Pro-Environmental Behavior and Rational Consumer Choice

You also want an ePaper? Increase the reach of your titles
YUMPU automatically turns print PDFs into web optimized ePapers that Google loves.
Diskussionspapierreihe<br />
Neuere ökonomische Ansätze zur Entwicklung nachfrage- und angebotsseitigen<br />
W<strong>and</strong>els im Bereich des nachhaltigen Konsums<br />
<strong>Pro</strong>-<strong>Environmental</strong> <strong>Behavior</strong> <strong>and</strong> <strong>Rational</strong><br />
<strong>Consumer</strong> <strong>Choice</strong>:<br />
Evidence from Surveys of Life Satisfaction<br />
Heinz Welsch <strong>and</strong> Jan Kühling<br />
WENKE 2 -Diskussionspapier Nr. 2/08<br />
Carl von Ossietzky Universität Oldenburg, Technische Universität Dresden, Max Planck<br />
Institut für Ökonomik, Jena, Borderstep Institut für Innovation und Nachhaltigkeit<br />
gGmbH, Berlin, Hannover.<br />
PROJEKTLAUFZEIT: März 2007-Februar 2010. FÖRDERKENNZEICHEN: 01UN0602C. Das<br />
Vorhaben wird vom Bundesministerium für Bildung und Forschung im Förderschwerpunkt<br />
Wirtschaftswissenschaften für Nachhaltigkeit gefördert und vom DLR als <strong>Pro</strong>jektträger<br />
betreut
<strong>Pro</strong>-<strong>Environmental</strong> <strong>Behavior</strong> <strong>and</strong> <strong>Rational</strong> <strong>Consumer</strong> <strong>Choice</strong> 3<br />
List of Contents<br />
Abstract..............................................................................................................................................4<br />
1 Introduction...............................................................................................................................5<br />
2 Theoretical Framework ............................................................................................................7<br />
2.1 Conceptual Background <strong>and</strong> Previous Literature...............................................................7<br />
2.2 <strong>Choice</strong> Distortions <strong>and</strong> <strong>Pro</strong>-<strong>Environmental</strong> <strong>Behavior</strong> .........................................................9<br />
2.3 The Theoretical Model .....................................................................................................10<br />
3 Empirical Framework .............................................................................................................13<br />
3.1 The Empirical Model ........................................................................................................13<br />
3.2 The Data Base.................................................................................................................14<br />
3.3 <strong>Pro</strong>perties of the Data......................................................................................................15<br />
4 Empirical Results....................................................................................................................16<br />
4.1 Preliminaries ....................................................................................................................16<br />
4.2 <strong>Pro</strong>-Environment Consumption <strong>and</strong> Life Satisfaction.......................................................17<br />
4.3 Distorted <strong>Choice</strong> <strong>and</strong> Materialistic Values........................................................................20<br />
4.4 Distorted <strong>Choice</strong> <strong>and</strong> Cognitive Conditions......................................................................22<br />
5 Conclusions............................................................................................................................24<br />
6 References ..............................................................................................................................26<br />
7 Appendix A..............................................................................................................................29<br />
8 Appendix B..............................................................................................................................30
<strong>Pro</strong>-<strong>Environmental</strong> <strong>Behavior</strong> <strong>and</strong> <strong>Rational</strong> <strong>Consumer</strong> <strong>Choice</strong> 4<br />
Abstract<br />
This paper uses data on subjective well-being (life satisfaction) to explore the hypothesis<br />
that – relative to the utility maximum – consumer choice may be distorted towards the<br />
quantity consumed <strong>and</strong> away from environment-friendliness of consumption. Similar<br />
distortions have been documented with respect to other behaviors which, similar as proenvironment<br />
behavior, are driven by empathy or altruism. The empirical strategy involves<br />
ordered-probit estimation of appropriately specified life satisfaction equations which<br />
include indicators of pro-environment consumption among the explanatory variables.<br />
<strong>Rational</strong>, utility-maximizing choice in such a framework would imply a vanishing<br />
coefficient for environmental friendliness. We obtain a positive <strong>and</strong> significant association<br />
between life satisfaction <strong>and</strong> pro-environment behavior, which suggests that the choice of<br />
environmental friendliness is biased downwards. Our results are robust to controlling not<br />
only for socio-demographic characteristics but also for differences in environment-related<br />
personal attitudes.<br />
Keywords: pro-environment behavior; consumer choice; behavioral economics; life<br />
satisfaction; experienced utility; utility forecasting<br />
JEL classification: Q20; D12; I31; H41; D64
<strong>Pro</strong>-<strong>Environmental</strong> <strong>Behavior</strong> <strong>and</strong> <strong>Rational</strong> <strong>Consumer</strong> <strong>Choice</strong> 5<br />
1 Introduction<br />
From a st<strong>and</strong>ard microeconomic perspective, environment-friendly consumption may be<br />
viewed as the result of rational consumer choice. The rational-choice paradigm presumes<br />
that people hold perfect information about the benefits <strong>and</strong> costs of their decisions <strong>and</strong><br />
make optimal, utility maximizing choices. Recent research in behavioral economics,<br />
however, has shown that people commit systematic mistakes in utility forecasting<br />
(Loewenstein <strong>and</strong> Adler 1995, Loewenstein <strong>and</strong> Schkade 1999, Loewenstein et al. 2003,<br />
Wilson <strong>and</strong> Gilbert 2003), which lead to choices that are sub-optimal in terms of people’s<br />
own ex-post evaluation. 1 The mistakes are systematic (non-r<strong>and</strong>om) because they affect<br />
certain goods or activities more than others. Especially, the utility (satisfaction) from<br />
material consumption tends to be over-rated ex ante. This implies distorted, non utilitymaximizing<br />
choices which involve, e.g., overwork (Layard 2007) or excessive commuting<br />
(Frey <strong>and</strong> Stutzer 2004) relative to activities which serve non-material goals. 2<br />
This paper investigates whether pro-environmental consumption is consistent with<br />
rational consumer choice or whether, alternatively, it is subject to distortions stemming<br />
from biased utility forecasting <strong>and</strong> related phenomena. We set up a model in which utility<br />
depends on the level (quantity) of consumption <strong>and</strong> its environmental friendliness<br />
(quality). By assuming that the (unit) cost of consumption increases in its quality, the<br />
budget constraint implies a trade-off between quantity <strong>and</strong> quality. Optimal choice of<br />
quality then implies that the marginal utility from quality is just balanced by the marginal<br />
disutility from quantity foregone or, in other words, that the net marginal utility from<br />
quality be zero.<br />
We test this condition using data for about 30,000 individuals in up to 67 countries,<br />
elicited in the third wave of the World Value Surveys. As an empirical approximation to<br />
utility we use self-reported subjective well-being (life satisfaction). 3 We estimate<br />
appropriately specified life satisfaction equations with several indicators of proenvironmental<br />
behavior among the explanatory variables. In terms of our theoretical<br />
model, utility-maximizing choice of environment-friendliness of consumption would imply<br />
that the corresponding coefficients – which measure net marginal utility – be insignificant.<br />
Significant coefficients, conversely, suggest that the observed choice of environmentfriendliness<br />
is not utility-maximizing. Especially, a positive coefficient indicates that an<br />
increase in environmental friendliness would be utility-increasing.<br />
1 Other, more traditional deviations from rational choice refer to ‘bounded rationality’ due to limited<br />
information processing. These limitations entail ‘satisficing’ rather than optimizing choice behavior (Simon<br />
1972).<br />
2 A major reason for ex-ante overrating of consumption or, more generally, income is that individuals<br />
insufficiently anticipate habituation to their st<strong>and</strong>ard of living, which implies that actual consumption-related<br />
utility is lower than expected (Easterlin 2001). Such habituation seems to be absent with respect to activities<br />
serving non-material goals (like cultural <strong>and</strong> social activities or human relations). See section 2.1.<br />
3 In contrast to revealed-preference approaches, using data on subjective well-being permits to separate<br />
consumption decisions from the utility thereby produced. Using subjective well-being data follows a recent<br />
line of research in economics (see Frey <strong>and</strong> Stutzer 2002, Layard 2005, Di Tella <strong>and</strong> MacCulloch 2006,<br />
Bruni <strong>and</strong> Porta 2007). A thorough discussion of methodological issues is provided by Frey <strong>and</strong> Stutzer<br />
(2002).
<strong>Pro</strong>-<strong>Environmental</strong> <strong>Behavior</strong> <strong>and</strong> <strong>Rational</strong> <strong>Consumer</strong> <strong>Choice</strong> 6<br />
By running ordered-probit regressions, we find that life satisfaction is positively <strong>and</strong><br />
significantly associated with (a) the consumption of environment-friendly products, (b) the<br />
recycling or reuse of goods, <strong>and</strong> (c) water conservation. Our results are robust to<br />
controlling not only for observable socio-demographic characteristics <strong>and</strong> unobserved<br />
inter-country <strong>and</strong> inter-temporal heterogeneity but also for differences in personal attitudes<br />
<strong>and</strong> values. Especially, we control for differences in environmental preferences, thus<br />
addressing the possibility that people with pro-environment attitudes may be inherently<br />
more (or less) satisfied, independent of the corresponding behaviors. As we find the<br />
positive <strong>and</strong> significant association between pro-environment behavior <strong>and</strong> life satisfaction<br />
to be robust with respect to this check, we conclude that the effects we are measuring<br />
cannot be attributed to differences in attitudes but, in fact, refer to behaviors.<br />
Our results suggest that, on average, people make sub-optimal choices with respect to<br />
pro-environmental behaviors. With respect to all three behaviors we find that the<br />
distortions are smaller in better educated people. Moreover, in the cases of environmental<br />
friendly products <strong>and</strong> of recycling we find that the distortions are smaller if the respective<br />
behaviors are more widespread in society. These findings suggest that better cognitive<br />
abilities <strong>and</strong> a general familiarity with pro-environmental behaviors may help avoid biased<br />
assessments of their benefits <strong>and</strong> costs. In addition, we find that with respect to<br />
environmental friendly products <strong>and</strong> recycling the distortions are significantly larger in<br />
materialistically oriented persons. This is consistent with the idea that an under-rating of<br />
environmentally relevant quality is partly the mirror image of an over-rating of the quantity<br />
consumed.<br />
In relating our paper to previous literature, it is useful to distinguish between studies of<br />
distorted consumer choice <strong>and</strong> its underlying mechanisms, <strong>and</strong> studies of the association<br />
between subjective well-being <strong>and</strong> environmental conditions or environmental awareness.<br />
The former category will be discussed in detail later in the paper. Studies addressing the<br />
association between subjective well-being <strong>and</strong> environmental conditions usually use the<br />
estimated relationship between these variables to derive the implied monetary valuation of<br />
environmental amenities, see Welsch (2002, 2006) with respect to air pollution, Israel <strong>and</strong><br />
Levinson (2003) with respect to water pollution, Frijters <strong>and</strong> Van Praag (1998) <strong>and</strong><br />
Rehdanz <strong>and</strong> Maddison (2005) with respect to climate, Van Praag <strong>and</strong> Baarsma (2005)<br />
with respect to aircraft noise, Luechinger <strong>and</strong> Raschky (2006) with respect to flood, <strong>and</strong><br />
Carrol et al. (2008) with respect to drought. These papers generally find that adverse<br />
environmental conditions have significant negative consequences for subjective well-being<br />
which translate into considerable monetary valuation of improved environmental quality<br />
(see Welsch <strong>and</strong> Kühling 2008 for a survey). A paper addressing the relationship between<br />
measures of subjective well-being <strong>and</strong> environmental awareness is Ferrer-i-Carbonell <strong>and</strong><br />
Gowdy (2007). That paper finds a negative impact of concern about ozone depletion on<br />
individuals’ well-being <strong>and</strong> a positive one for concern about species extinction.<br />
In relation to that literature, the paper’s contribution is to employ data on subjective<br />
well-being for studying environmentally-relevant consumer behavior, instead of given<br />
environmental conditions or environmental awareness. It explores the rationality of choice<br />
– previously examined with respect to income acquisition relative to social activities <strong>and</strong>
<strong>Pro</strong>-<strong>Environmental</strong> <strong>Behavior</strong> <strong>and</strong> <strong>Rational</strong> <strong>Consumer</strong> <strong>Choice</strong> 7<br />
human relations – with respect to pro-environment consumption. The results of the paper<br />
suggest that environment-friendly consumption is not only less than socially optimal (due<br />
to the usual public good considerations), but, in addition, may even be less than<br />
individually rational.<br />
The paper is organized as follows. Section 2 provides the theoretical framework <strong>and</strong><br />
section 3 the empirical framework. Section 4 presents the empirical results. Section 5<br />
concludes.<br />
2 Theoretical Framework<br />
2.1 Conceptual Background <strong>and</strong> Previous Literature<br />
As mentioned in the introduction, recent research in behavioral economics entails that, in<br />
contrast to the <strong>Rational</strong> <strong>Choice</strong> Model, people commit systematic mistakes when making<br />
decisions. These mistakes imply distorted choices, that is, choices which are not utilitymaximizing.<br />
As a result, people are less well off than they could be, according to their own<br />
evaluation (see Stutzer <strong>and</strong> Frey 2007 for a survey). 4 This proposition will be referred to as<br />
the Distorted <strong>Choice</strong> Hypothesis (DCH) of consumer choice.<br />
The DCH relies on a distinction between two concepts of utility that have been used in<br />
the literature of economics: experienced utility <strong>and</strong> decision utility (Kahneman et al. 1997).<br />
Experienced utility is the ex post hedonic quality (satisfaction) associated with an act of<br />
choice. Decision utility is the ex ante expectation of experienced utility. The DCH<br />
presupposes a deviation between decision utility <strong>and</strong> experienced utility, that is, a failure of<br />
affective forecasting (Loewenstein <strong>and</strong> Adler 1995, Loewenstein <strong>and</strong> Schkade 1999,<br />
Loewenstein et al. 2003, Gilbert et. al. 1998, Wilson <strong>and</strong> Gilbert 2003). DCH entails that<br />
these forecasting errors are not just r<strong>and</strong>om errors (which would cancel out in the<br />
aggregate) <strong>and</strong> that they are different for different categories of goods <strong>and</strong> activities<br />
(Kahneman <strong>and</strong> Sugden 2005).<br />
A major source of incorrect utility forecasting is reference-dependence of (experienced)<br />
utility. Reference-dependence means that outcomes are judged relative to some<br />
benchmark. An important benchmark may be the individual’s own past performance.<br />
Outcomes will be evaluated differently when the benchmark changes over time. For<br />
instance, an individual’s satisfaction with her income is lower when the level of income<br />
attained in the past is higher (van Praag 1993, Easterlin 2001, Stutzer 2004, for a survey<br />
see Clark et al. 2008). This reflects the phenomenon known as habituation or hedonic<br />
adaptation (see Frederick <strong>and</strong> Loewenstein 1999 for a review). Failure of utility forecasting<br />
arises when hedonic adaptation is unforeseen (or inaccurately foreseen).<br />
Hedonic adaptation does not apply to all sorts of outcomes alike. Especially, people do<br />
not seem to adapt their utility evaluation in the case of outcomes which relate to so-called<br />
4 These propositions do not presume a cardinal notion of utility. They merely assert that choices are<br />
attainable which would be preferred to those actually made.
<strong>Pro</strong>-<strong>Environmental</strong> <strong>Behavior</strong> <strong>and</strong> <strong>Rational</strong> <strong>Consumer</strong> <strong>Choice</strong> 8<br />
intrinsic motivations, as opposed to extrinsic motivations. 5 In the case of intrinsic<br />
motivation, utility derives from an internal reward as a direct result of a particular activity<br />
or choice. At a fundamental level, intrinsic motivation has been linked to a need for<br />
relatedness, competence, or autonomy (Deci <strong>and</strong> Ryan 2000). In the case of extrinsic<br />
motivation, choice is instrumental to some external goal such as acquisition, possession,<br />
status <strong>and</strong> prestige. A major example of a lack of adaptation to outcomes that relate to<br />
intrinsic motivations is unemployment. Unemployment affects the need for relatedness,<br />
competence, <strong>and</strong> autonomy <strong>and</strong> has consistently been found to have large <strong>and</strong> persistent<br />
negative effects on subjective well-being (e.g., Clark et al. 2001). 6 By contrast, changes in<br />
income (or consumption) largely relate to extrinsic motivations <strong>and</strong> are subject to a<br />
considerable degree of adaptation; they typically have only transitory effects on subjective<br />
well-being (Easterlin 2001, Stutzer 2004). 7<br />
Since the failure of affective forecasting results from a failure to anticipate hedonic<br />
adaptation, <strong>and</strong> since hedonic adaptation is more important for some categories of<br />
outcomes than for others, it follows that some sorts of outcomes are more liable to<br />
inaccurate utility forecasting than others. This asymmetry in the accuracy of utility<br />
forecasting is an origin of distorted, non utility-maximizing choice. Especially, it implies<br />
that choice is distorted towards consumption (or income) relative to activities which serve<br />
less material goals. Moreover, this distortion is likely to be larger the more weight people<br />
place on material relative to non-material outcomes (Stutzer <strong>and</strong> Frey 2007). 8<br />
The empirical literature on the choice implications of inaccurate utility forecasting has<br />
used measures of subjective well-being as indicators of experienced utility. Frey <strong>and</strong><br />
Stutzer (2004) have addressed commuting as an example of an extrinsically motivated<br />
activity whereas Meier <strong>and</strong> Stutzer (2007) have studied volunteering as an example of an<br />
intrinsically motivated activity. These studies found negative (net) marginal utility from<br />
commuting <strong>and</strong> positive (net) marginal utility from volunteering, respectively. Since utility<br />
maximization would imply that net marginal utility be zero, these findings are inconsistent<br />
with <strong>Rational</strong> <strong>Choice</strong>. In contrast, they are consistent with an ex ante overvaluation of<br />
extrinsically motivated activities (serving income acquisition) relative to intrinsically<br />
motivated activities (related to human relationships). Moreover, Frey <strong>and</strong> Stutzer (2004)<br />
found utility losses from excessive commuting to be particularly large in people with<br />
materialistic value orientations, consistent with the idea that people who emphasize<br />
extrinsic life goals are particularly prone to distorted utility forecasting <strong>and</strong> decision<br />
making.<br />
5 For these concepts, see Maslow 1968, Rogers 1961, Kasser <strong>and</strong> Ryan 1996, Frey <strong>and</strong> Stutzer 2004.<br />
6 Measures of subjective well-being are an empirical approximation to experienced utility.<br />
7 Effects with respect to unemployment have been established while controlling for income, that is, they do<br />
not reflect income losses associated with unemployment.<br />
8 People with materialistic value orientations have been found to report lower levels of subjective well-being<br />
than people with less materialistic values (Kasser <strong>and</strong> Ryan 1996, Sirgy 1998). This evidence can be taken to<br />
indicate that people with a materialistic attitude are particularly inclined towards incorrect utility forecasting<br />
<strong>and</strong> the ensuing sub-optimal choices. Alternatively, materialistic value orientation <strong>and</strong> low subjective wellbeing<br />
may both be rooted in unobserved personality traits.
<strong>Pro</strong>-<strong>Environmental</strong> <strong>Behavior</strong> <strong>and</strong> <strong>Rational</strong> <strong>Consumer</strong> <strong>Choice</strong> 9<br />
2.2 <strong>Choice</strong> Distortions <strong>and</strong> <strong>Pro</strong>-<strong>Environmental</strong> <strong>Behavior</strong><br />
In a nutshell, previous literature suggests that people habituate to having more material<br />
possessions while they do not habituate to the same extent to other aspects of their lives,<br />
such as human relationships. It also suggests that, because people fail to anticipate their<br />
habituation to material possessions, they over-invest in these <strong>and</strong> under-invest in other<br />
things, relative to the balance that would be utility maximizing.<br />
The present paper studies whether pro-environmental behaviors belong to those ‘other<br />
things’, such that choices concerning these behaviors are distorted downward. More<br />
specifically, we explore the proposition that the quality of consumption, that is,<br />
environmental friendliness, is less than, whereas the mere quantity consumed is larger than<br />
what would be utility-maximizing. Moreover, we test the hypothesis that such biases are<br />
larger in people who place more weight on materialistic values.<br />
There are several reasons why these propositions may hold. One set of reasons refers to<br />
the motivations (intrinsic vs. extrinsic) underlying pro-environmental consumption,<br />
whereas another focuses on cognitive aspects with respect to familiarity with <strong>and</strong><br />
information about pro-environmental behaviors.<br />
The first set of reasons reflects the findings concerning inaccurate affective forecasting,<br />
as discussed in the preceding subsection. The basic idea is that the level of consumption<br />
(quantity) <strong>and</strong> its quality (environmental friendliness) are connected through the budget<br />
constraint. Assuming that the unit cost of consumption increases in its pro-environmental<br />
attributes, factors that lead to an upward bias in the quantity chosen imply a downward bias<br />
in quality. Failure to anticipate hedonic adaptation to consumption levels thus implies an<br />
over-rating of quantity <strong>and</strong> an under-rating of quality, provided that quality is not itself<br />
subject to (unanticipated) hedonic adaptation. However, we claim that hedonic adaptation<br />
may be less marked with respect to environmental friendliness than with respect to the<br />
level of consumption.<br />
The justification for this assertion relates to the prevalent motives underlying proenvironmental<br />
consumption. <strong>Pro</strong>-environmental consumption falls into the category of<br />
private provision of a public good, environmental quality. From this perspective, a basic<br />
motivation for pro-environment behavior seems to be self-interest in environmental<br />
quality, possibly augmented by environment-related altruism. However, since individual<br />
contributions typically have negligible effects on environmental quality, other, nontangible,<br />
motivations have been proposed to be more important as explanations for<br />
observed non-negligible contributions: the ‘warm glow’ (Andreoni 1990) <strong>and</strong> prestige<br />
(Harbaugh 1998). 9<br />
In terms of the classification of motivations discussed above, prestige provides an<br />
extrinsic motive whereas altruisms <strong>and</strong> the ‘warm glow’ may be classified as intrinsic<br />
motives. In the light of the preceding subsection it may, therefore, be expected that, in<br />
contrast to the level of consumption, its pro-environmental quality is less liable to<br />
unforeseen hedonic adaptation <strong>and</strong> the implied ex-ante overrating of utility.<br />
9 In addition, there may be tangible non-environmental benefits, such as product-related health benefits (for<br />
instance in the case of organically produced food).
<strong>Pro</strong>-<strong>Environmental</strong> <strong>Behavior</strong> <strong>and</strong> <strong>Rational</strong> <strong>Consumer</strong> <strong>Choice</strong> 10<br />
In addition to considerations of unforeseen hedonic adaptation to consumption levels,<br />
distorted choices of pro-environmental behavior may be caused by a lack of familiarity<br />
with pro-environmental behaviors <strong>and</strong> a lack of information about their benefits <strong>and</strong> costs.<br />
Distorted choice may therefore apply to pro-environment consumption not only indirectly<br />
due to an ex ante overvaluation of the quantity consumed, but also directly due to a<br />
cognitively based undervaluation of the environmentally relevant quality of consumption.<br />
In the empirical part of the paper we consider three pro-environmental behaviors,<br />
namely consumption of environment-friendly products, recycling, <strong>and</strong> water conservation.<br />
We explore not only the general validity of distorted choice but in addition try to shed<br />
some light on the relevance of the possible causes of distorted choice with respect to these<br />
kinds of behaviors.<br />
To conclude this general discussion, we note that the hypothesized distortions – if valid<br />
– arise over <strong>and</strong> above public-good related market failure. The distortions imply that the<br />
individual could be better off by choosing differently even if other individuals’ choices are<br />
held constant. The distortions thus constitute a deviation from individual rationality, in<br />
addition to the familiar deviation from a Pareto optimal allocation.<br />
2.3 The Theoretical Model<br />
Let x ≥ 0 denote the quantity <strong>and</strong> q ≥ 0 the environmental friendliness of an individual’s<br />
consumption. 10 q ≥ 0 denotes the environmental friendliness of other people’s<br />
consumption <strong>and</strong> Q = q + q overall environmental quality (public good). Then, the<br />
individual’s (experienced) utility function is stated as follows (using θ to denote a vector<br />
of individual characteristics <strong>and</strong> socio-economic conditions):<br />
u = U ( x,<br />
q,<br />
Q,<br />
θ ) .)<br />
In this formulation, the presence of q captures the utility derived from factors such as the<br />
‘warm glow’, prestige <strong>and</strong> non-environmental benefits (health), whereas the presence of Q<br />
captures the utility derived from environmental quality. This formulation highlights the<br />
two main channels through which environmental friendliness of consumption may deliver<br />
utility, namely in its capacity as a private good (yielding the warm glow etc.) <strong>and</strong> as a<br />
contributor to the public good of environmental quality.<br />
The quantity variables as well as the quality variables are assumed to exhibit positive,<br />
decreasing marginal utility <strong>and</strong> non-negative cross-derivatives:<br />
U 0, U < 0,<br />
U > 0,<br />
U < 0,<br />
U > 0,<br />
U < 0,<br />
U ≥ 0,<br />
U ≥ 0,<br />
U ≥ 0 . (1)<br />
x > xx q qq Q QQ xq xQ qQ<br />
As a complement to the utility function we introduce a unit cost function (or price<br />
function), which specifies the unit cost of the quantity consumed as a function of<br />
environmental friendliness:<br />
10 The quantity, x, is to be understood as a Hicksian composite.
<strong>Pro</strong>-<strong>Environmental</strong> <strong>Behavior</strong> <strong>and</strong> <strong>Rational</strong> <strong>Consumer</strong> <strong>Choice</strong> 11<br />
p = P(q)<br />
.<br />
Unit cost is strictly positive, increasing <strong>and</strong> convex in q:<br />
P ( 0)<br />
0,<br />
P > 0,<br />
P > 0 . 11 (2)<br />
> q qq<br />
Letting y > 0 denote income, the budget constraint can then be stated as follows:<br />
P( q) ⋅ x = y .<br />
Rearranging allows us to express the quantity as a function of income <strong>and</strong> quality, which is<br />
increasing in the first <strong>and</strong> decreasing in the second argument:<br />
y<br />
x = = : X ( y,<br />
q)<br />
> 0,<br />
X y > 0,<br />
X q < 0 .<br />
P(<br />
q)<br />
Inserting this into the utility function yields a semi-reduced utility function (SRUF) of<br />
income <strong>and</strong> quality:<br />
u = U ( X ( y,<br />
q),<br />
q,<br />
Q,<br />
θ ) = : V ( y,<br />
q,<br />
Q,<br />
θ ) .<br />
In the empirical analysis to be performed below, the empirical analogue to this function<br />
will be our basic tool. The following discussion serves to demonstrate what inference can<br />
be drawn from the estimated SRUF.<br />
* *<br />
We first observe that the utility-maximizing choice ( q , x ) subject to the budget<br />
constraint can be obtained by maximizing V ( y,<br />
q,<br />
Q,<br />
θ ) with respect to q <strong>and</strong> inserting the<br />
result into X ( y,<br />
q)<br />
. Since, under some mild conditions, Vqq ( y,<br />
q,<br />
Q,<br />
θ ) < 0 (see Appendix<br />
A), we obtain<br />
<strong>Pro</strong>position 1:<br />
(a) The utility-maximizing choice<br />
*<br />
* *<br />
q is characterized byVq ( y,<br />
q , q + q,<br />
θ ) = 0<br />
(b) For any observed choice<br />
o<br />
V ( y,<br />
q , q<br />
q<br />
q<br />
o<br />
o<br />
*<br />
+ q,<br />
θ ) > / = / < 0 ⇔ q < / = / > .<br />
o<br />
q we have<br />
According to statement (a), utility-maximizing choice implies that the marginal utility from<br />
q, net of the marginal disutility from quantity foregone, be zero. 12 According to statement<br />
11 The model, as formulated so far, readily applies to consumption goods <strong>and</strong> their environmental<br />
friendliness, as the price of these goods can be expected to increase in the degree of environmental<br />
friendliness. The model does not immediately apply to consumption behaviors like recycling or water<br />
conservation, as these behaviors reduce the cost per unit of total quantity (primary plus secondary). These<br />
kinds of pro-environment behaviors will be addressed later.<br />
12 In more detail, the condition Vq = 0 takes the form UxXq+Uq+UQ =0. This can be restated as (Uq+UQ)/Ux =<br />
-Xq, that is, the marginal rate of substitution of quality for quantity equals the marginal rate of transformation.<br />
.
<strong>Pro</strong>-<strong>Environmental</strong> <strong>Behavior</strong> <strong>and</strong> <strong>Rational</strong> <strong>Consumer</strong> <strong>Choice</strong> 12<br />
(b), the derivative taken at the observed choice<br />
o<br />
q allows us to assess whether or not<br />
o<br />
o<br />
( q , X ( y,<br />
q ) ) is utility-maximizing <strong>and</strong>, if not, in which direction the distortion goes.<br />
o<br />
o<br />
o o<br />
Specifically, any choice ( q , X ( y,<br />
q ) ) for which V ( y,<br />
q , q + q,<br />
θ ) > ( < ) 0 , can be<br />
improved upon by raising (reducing) q <strong>and</strong> reducing (raising) x.<br />
To shed some light on possible sources of distorted choice, we consider the decision utility<br />
~<br />
function U ( x,<br />
q,<br />
Q,<br />
θ ) , which is assumed to have the same qualitative properties as the<br />
experienced utility function stated in (1). In addition, we admit that decisions are based on<br />
~<br />
a perceived unit cost function P ( q)<br />
which is assumed to have the same qualitative<br />
~ ~<br />
properties as the true cost function, as stated in (2), <strong>and</strong> which induces X ( y,<br />
q)<br />
: = y / P(<br />
q)<br />
.<br />
~<br />
~ ~<br />
We then have the semi-reduced decision utility function V ( y,<br />
q,<br />
Q,<br />
θ ) = U ( X ( y,<br />
q),<br />
q,<br />
Q,<br />
θ ) .<br />
o<br />
By definition, observed choice q maximizes decision utility. Observed choice is<br />
~ o o<br />
*<br />
characterized by Vq<br />
( y,<br />
q , q + q,<br />
θ ) = 0 . Due to <strong>Pro</strong>position 1, any deviation q ( ) q<br />
o<br />
< ><br />
o o<br />
~ o o<br />
therefore implies V ( y,<br />
q , q + q,<br />
θ ) > ( < ) 0 = V ( y,<br />
q , q + q,<br />
θ ) or, in more detail,<br />
U<br />
o<br />
x<br />
X<br />
o<br />
q<br />
o<br />
q<br />
q<br />
o<br />
Q<br />
o<br />
x<br />
o<br />
q<br />
o<br />
q<br />
q<br />
~ ~ ~ ~<br />
+ U + U > ( < ) 0 = U X + U + U<br />
(3)<br />
where the superscript ‘o’ indicates that the derivatives are evaluated at the observed choice.<br />
*<br />
For the sake of concreteness, consider the case q q<br />
o o ~ o<br />
< , implying V q > Vq<br />
( = 0)<br />
. We see<br />
o ~ o<br />
from (3) that the latter inequality arises if at least one of the following holds: (a) U x < U x ,<br />
o ~ o o ~ o<br />
o ~ o<br />
o ~ o<br />
(b) X > X ⇔ P < P , (c) U > U , (d) U > U . Here, (a) reflects that the marginal<br />
q<br />
q<br />
q<br />
q<br />
q<br />
q<br />
utility from quantity is over-rated ex ante, whereas (b) reflects that the perceived<br />
(expected) marginal cost from quality is over-rated. 13 (c) <strong>and</strong> (d) reflect an ex ante underrating<br />
of the marginal utility from quality. (a) – (d) are possible sources of a downward<br />
distortion in q o .<br />
In view of the literature discussed above, a slightly more specific version of the<br />
experienced <strong>and</strong> decision utility functions would focus on materialism, i.e., the weight an<br />
individual attaches to quantity relative to quality. Let this weight be ω > 0 , such that the<br />
~<br />
experienced <strong>and</strong> decision utility functions are U ( ω x,<br />
q,<br />
Q,<br />
θ ) <strong>and</strong> U ( ω x,<br />
q,<br />
Q,<br />
θ ) ,<br />
~ o o ~ o o<br />
respectively. With xˆ : = ω x we have U x −U x = ω ( U xˆ<br />
−U<br />
xˆ<br />
) . Therefore, if a distortion<br />
o *<br />
q − q < 0 is caused by an over-rating of quantity, this distortion will increase in ω .<br />
The model as described up to this point applies to consumer products <strong>and</strong> their<br />
environmental friendliness. In the case of pro-environment behaviors like recycling or<br />
water conservation, some reinterpretation is in order. In this case, x would have to be<br />
interpreted as the total quantity (primary plus secondary), q as the recycling ratio, <strong>and</strong> p as<br />
the unit cost of total quantity. The unit cost is then smaller, the larger is the fraction of<br />
recycled material (Pq < 0), but the cost is likely to decrease at a decreasing rate (Pqq > 0).<br />
On the other h<strong>and</strong>, recycling may imply marginal disutility (Uq < 0) at an increasing rate<br />
13<br />
Note that o<br />
o 2 o<br />
X q = −(<br />
y / P(<br />
q ) Pq<br />
( q ) <strong>and</strong> ~ o ~ o 2 ~ o<br />
X q = −(<br />
y / P(<br />
q ) Pq<br />
( q ) . We assume that the level of unit cost at q o is<br />
correctly observed (<br />
~ o<br />
o<br />
P ( q ) = P(<br />
q ) ) whereas the expectation concerning the effect of a change in q o may be<br />
biased.<br />
Q<br />
o<br />
Q<br />
Q<br />
q
<strong>Pro</strong>-<strong>Environmental</strong> <strong>Behavior</strong> <strong>and</strong> <strong>Rational</strong> <strong>Consumer</strong> <strong>Choice</strong> 13<br />
(Uqq < 0) due to inconvenience or reduced service quality. Moreover, it is reasonable to<br />
assume U ≤ 0 in this case. The SRUF implied by such a set-up still satisfies <strong>Pro</strong>position<br />
1. 14<br />
xq<br />
In the empirical analysis, we will estimate the SRUF, using data on life satisfaction as<br />
an empirical approximation to experienced utility. Consistent with <strong>Pro</strong>position 1, a nonvanishing<br />
derivative with respect to q will be taken to indicate that the observed choice of<br />
environmental friendliness is not utility-maximizing, <strong>and</strong> the sign of the derivative will<br />
indicate the direction of distortion.<br />
3 Empirical Framework<br />
3.1 The Empirical Model<br />
In this paper we use individuals’ answers to the following question: “All things considered,<br />
how satisfied are you with your life as a whole these days?” Respondents are presented a<br />
card showing a scale from 1 to 10, where 1 is labeled “dissatisfied” <strong>and</strong> 10 is labeled<br />
“satisfied” <strong>and</strong> are asked to indicate their level of satisfaction using that scale. Following<br />
the literature (see, e.g., Frey <strong>and</strong> Stutzer 2002), the answer to the life satisfaction question,<br />
LS = 1. …,10, is taken as an empirical measure of the respondent’s experienced utility, u.<br />
We assume that reported life satisfaction of individual i in country c <strong>and</strong> year t, LS ict , is<br />
an ordered categorical variable, that is, we can observe only the range in which true (latent)<br />
experienced utility, u ict , lies, but not its exact level. Reported life satisfaction is then<br />
explained according to the following model:<br />
u = α y + βq<br />
+ γQ<br />
+ δθ + d + d + ε<br />
(4)<br />
ict ict ict ct ict<br />
ict = n ⇔ μ n ≤ uict<br />
< n+<br />
1<br />
LS μ<br />
c<br />
t<br />
where n represents the 10 discrete life satisfaction categories (1 to 10), μ n are nine<br />
estimated threshold values that differentiate the categories from each other, q are the<br />
measures of an individual’s environment-friendly consumption, Q is an indicator of<br />
environmental friendliness at the societal level, θ is a vector of k explanatory variables,<br />
d c <strong>and</strong> d t are country <strong>and</strong> year fixed effects, <strong>and</strong> ε represents the error term. The first line<br />
in (4) gives the empirical analogue to the SRUF, linearized at the point of observation. The<br />
second line specifies how reported life satisfaction is associated with unobserved<br />
experienced The measures utility. of environment-friendliness, q <strong>and</strong> Q, will be explained in the following<br />
subsection. The explanatory variables collected in θ comprise demographic characteristics<br />
(health, age, sex, income, household size, educational attainment, marital status,<br />
occupational status, size of locality) <strong>and</strong> per capita income on the one h<strong>and</strong> <strong>and</strong> indicators<br />
14<br />
In this case, Xq > 0. Assuming xq + U xQ ≤ 0<br />
of the functions U <strong>and</strong> P, Vqq < 0 still applies (see Appendix A).<br />
ict<br />
U <strong>and</strong> given the sign of the second derivatives with respect to q
<strong>Pro</strong>-<strong>Environmental</strong> <strong>Behavior</strong> <strong>and</strong> <strong>Rational</strong> <strong>Consumer</strong> <strong>Choice</strong> 14<br />
of attitudes (pro-environment attitude, materialistic attitude) on the other h<strong>and</strong>. Attitude<br />
indicators are included because attitudes may simultaneously influence life satisfaction <strong>and</strong><br />
pro-environment behaviors, such that their omission leads to biased estimates. In this<br />
sense, controlling for attitudes is an approximation to using individual fixed effects (which<br />
would be the preferred strategy in a sample with panel structure). 15 In addition, equation<br />
(4) will be augmented to include interactions between pro-environment behaviors <strong>and</strong><br />
individual <strong>and</strong> societal conditions. Such interactions permit to check whether, if at all,<br />
distorted choice is linked to attitudinal <strong>and</strong> cognitive conditions.<br />
The model from equation (4) will be estimated by means of an ordered probit maximum<br />
likelihood estimator.<br />
3.2 The Data Base<br />
This paper uses data from the World Values Surveys (WVS). The WVS were conducted in<br />
four waves (1981-1984, 1989-1993, 1994-1999 <strong>and</strong> 2000-2004), involving 267.870<br />
individuals in 84 countries, both developed <strong>and</strong> developing. 16 They include, especially,<br />
information on demographic characteristics <strong>and</strong> self-rated life satisfaction (as stated in the<br />
question quoted above). In addition, the third wave of the WVS includes the following<br />
questions concerning environment-friendly consumption:<br />
“Which, if any, of these things have you done in the last 12 months, out of concern for the<br />
environment?<br />
• Have you chosen household products that you think are better for the environment?<br />
• Have you decided for environmental reasons to reuse or recycle something rather<br />
than throw it away?<br />
• Have you tried to reduce water consumption for environmental reasons?”<br />
For each of these items (which we label Green<strong>Pro</strong>ducts, Recycling, WaterConservation)<br />
respondents can answer “have not” (0), “have done” (1). 17<br />
These three items constitute our indicators of pro-environment consumption. 18 The<br />
corresponding indicators of environmental friendliness at the societal level (labeled QSoc)<br />
are the percentages of respondents (by country <strong>and</strong> year) who have answered “have done”.<br />
15<br />
We believe that omission of common determinants of life satisfaction <strong>and</strong> pro-environmental behaviors is<br />
the main source of potential estimation bias. Important common determinants may be personality traits. Since<br />
these traits are unobserved, we try to proxy them by indicators of attitudes which may be thought to affect<br />
both life satisfaction <strong>and</strong> pro-environmental behaviors. By controlling for these determinants of life<br />
satisfaction, we account for endogeneity in the sense that people who are more satisfied due to these factors<br />
may be more inclined towards pro-environmental behavior.<br />
16<br />
See The European Values Study Foundation <strong>and</strong> World Values Survey Association, European <strong>and</strong> World<br />
Values Surveys four-wave integrated data file, 1981-2004, v.20060423, 2006, Aggregate File <strong>Pro</strong>ducers:<br />
ASEP/JDS, Madrid, Spain/Tilburg University, Tilburg, the Netherl<strong>and</strong>s. Aggregate File Distributors:<br />
ASEP/JDS <strong>and</strong> ZA, Cologne, Germany.<br />
17<br />
Additional categories in the data base are “don’t know“, “no answer“, “not applicable“, “not asked in<br />
survey“, <strong>and</strong> “missing; unknown“. Answers falling in these categories were omitted.<br />
18<br />
The circumstance that these indicators are binary variables does not affect the logic that a non-vanishing<br />
coefficient indicates a failure to maximize (experienced) utility: A positive [negative] coefficient<br />
β ≡ Δu<br />
/ Δq<br />
≡ Δu<br />
/ q implies that an individual who chooses (q = 0, X(y, q = 0)) [(q = 1, X(y, q = 1))]
<strong>Pro</strong>-<strong>Environmental</strong> <strong>Behavior</strong> <strong>and</strong> <strong>Rational</strong> <strong>Consumer</strong> <strong>Choice</strong> 15<br />
In addition to these behavioral items, answers to the following questions will be used as<br />
controls concerning pro-environment attitudes:<br />
“Here are two statements people sometimes make when discussing the environment <strong>and</strong><br />
economic growth. Which of them comes closer to your own point of view?<br />
• A: <strong>Pro</strong>tecting the environment should be given priority, even if it causes slower<br />
economic growth <strong>and</strong> some loss of jobs.<br />
• B: Economic growth <strong>and</strong> creating jobs should be the top priority, even if the<br />
environment suffers to some extent.”<br />
For this item (which we label EnvPriority) respondents can answer “economic growth <strong>and</strong><br />
creating jobs” (0), “protecting environment (1).<br />
“I am now going to read out statements about the environment. For each one I read out,<br />
can you tell me whether you agree strongly, agree, disagree, disagree strongly?<br />
• I would buy things at a 20 % higher price if it helped to protect the environment.”<br />
For this item (WTP20) respondents can answer “strongly agree”, “agree”, “disagree”,<br />
“strongly disagree”. In our empirical analysis, the indicator WTP20 is included as a binary<br />
variable which takes the value 0 if the response is “strongly disagree” or “disagree” <strong>and</strong> 1<br />
if the response is “agree” or “strongly agree”.<br />
Further variables to be included in the analysis are self-rated health, sex, age, marital<br />
status, household size, educational attainment, occupational status, household income, <strong>and</strong><br />
the size of the locality, as these variables have been found to be important correlates of<br />
happiness (Frey <strong>and</strong> Stutzer 2002). Finally, the regressions include purchasing power<br />
parity income per capita in the respective countries <strong>and</strong> years (taken from the Penn World<br />
Tables) as an additional control.<br />
Our regressions use data for up to 30,904 individuals in up to 67 countries, 1994-1999,<br />
depending on the configuration of explanatory variables (see Table B1 for the country-year<br />
configurations in which the questions were asked).<br />
3.3 <strong>Pro</strong>perties of the Data<br />
Summary statistics of the data are provided in Table B2 in Appendix B. A few additional<br />
comments on our data base are in order. First, as Table B3 in Appendix B shows, the<br />
environmental behaviors are positively, though not very strongly, correlated with life<br />
satisfaction. In addition, they are considerably correlated with each other. This suggests<br />
that it may be useful to include these variables one at a time, in order to avoid problems of<br />
collinearity (<strong>and</strong>, in addition, a loss in the number of observations that arises when these<br />
variables are combined). This is the approach with which we will start. It will be followed<br />
by a regression which includes the pro-environment behaviors simultaneously.<br />
o<br />
would be better off by choosing (q = 1, X(y, q = 1)) [(q = 0, X(y, q = 0))]. Observed choices q ict (<strong>and</strong><br />
implied ( ,<br />
o<br />
) y X ) can thus be utility maximizing only when the estimated β is zero (i.e. insignificant).<br />
ict ict q
<strong>Pro</strong>-<strong>Environmental</strong> <strong>Behavior</strong> <strong>and</strong> <strong>Rational</strong> <strong>Consumer</strong> <strong>Choice</strong> 16<br />
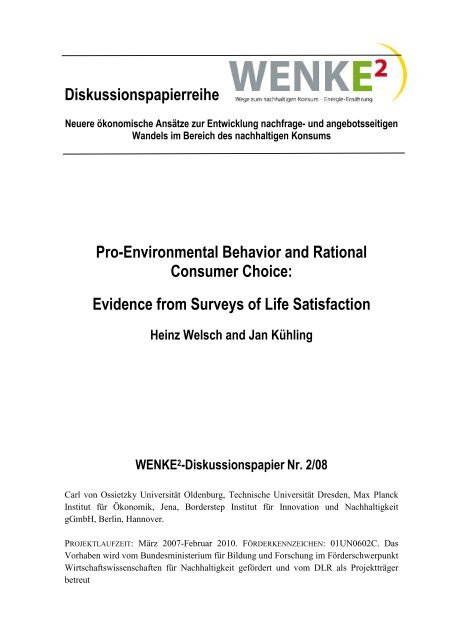
Second, given that not all of the required indicators are available for all individuals, we<br />
are faced with sub-samples that are smaller than the total sample. Moreover, these subsamples<br />
may be not representative. To check for this possibility, Figure 1 shows the<br />
frequencies of the ten life satisfaction categories for the complete sample <strong>and</strong> the various<br />
sub-samples in which the environment-related variables are available (see also Table B4 in<br />
Appendix B). The distributions within these sub-samples are very similar to those within<br />
the complete sample. We therefore consider the sub-samples in which the environmentrelated<br />
questions were asked as adequate representations of the distribution of life<br />
satisfaction.<br />
Figure 1: Frequency distribution of life satisfaction in total sample <strong>and</strong> sub-samples in<br />
which environment-related variables are available<br />
percent<br />
20.00<br />
18.00<br />
16.00<br />
14.00<br />
12.00<br />
10.00<br />
8.00<br />
6.00<br />
4.00<br />
2.00<br />
0.00<br />
1 2 3 4 5 6 7 8 9 10<br />
life satisfaction<br />
Total Sample<br />
Green products<br />
Recycling<br />
Water conservation<br />
Priority<br />
WTP20<br />
The next section addresses the question whether the apparent positive association between<br />
pro-environment consumption <strong>and</strong> subjective well-being from Table B3 is robust to the<br />
inclusion of income, country <strong>and</strong> time dummies, <strong>and</strong> the controls discussed above.<br />
4 Empirical Results<br />
4.1 Preliminaries<br />
The empirical analysis proceeds in several steps. Subsections 4.1 <strong>and</strong> 4.2 consider basic<br />
versions of model (4) from subsection 3.1 in which interactions of pro-environment<br />
consumption with individual <strong>and</strong> societal conditions are omitted. Subsection 4.3 introduces<br />
interactions with indicators of materialistic attitudes, thus checking the proposition that<br />
such attitudes may enhance choice distortions with respect to pro-environment<br />
consumption. Subsection 4.4 considers interactions with measures of education <strong>and</strong><br />
familiarity with pro-environmental behaviors.<br />
All 5
<strong>Pro</strong>-<strong>Environmental</strong> <strong>Behavior</strong> <strong>and</strong> <strong>Rational</strong> <strong>Consumer</strong> <strong>Choice</strong> 17<br />
The results from estimating the basic model versions are presented in Table 1 <strong>and</strong>, in<br />
more detail in Table B5. The first three ordered probit regressions (A-C) include the proenvironment<br />
behaviors one at a time whereas the fourth regression (D) includes them<br />
jointly. As a prelude, we first discuss the estimated life satisfaction thresholds <strong>and</strong> the<br />
socio-demographic controls (see Table B5).<br />
It can be stated that the estimated threshold values of the life satisfaction scale are, in<br />
general, fairly even spaced. An exception is provided by the fourth <strong>and</strong> the fifth threshold,<br />
which are markedly more distant from each other than are the other threshold values.<br />
These findings hold irrespective of which of the pro-environment variables are included.<br />
These results provide a justification for using an estimator for ordinal rather than cardinal<br />
dependent variables.<br />
We next address the results concerning the socio-demographic variables <strong>and</strong> per capita<br />
income. In spite of small numerical differences in coefficient values, the four regressions<br />
exhibit a common qualitative pattern: Life satisfaction is positively <strong>and</strong> significantly<br />
related to health, income, <strong>and</strong> the level of education. Females report higher life satisfaction<br />
than males, whereas age takes a U-shaped profile. Being married is associated with greater<br />
life satisfaction than being a single, whereas the opposite is true for being separated. Being<br />
retired, a housewife/houseman, or a student is associated with higher life satisfaction than<br />
working full time or part time, whereas being unemployed goes with considerably lower<br />
life satisfaction. Having university education is the strongest positive factor for life<br />
satisfaction, whereas being separated or unemployed are the strongest negative factors.<br />
Finally, in addition to individual income, higher per capita income is also associated with<br />
greater life satisfaction.<br />
All of these results hold while controlling for unobserved heterogeneity across countries<br />
<strong>and</strong> time. Controlling, in addition, for pro-environmental attitudes (EnvPriority, WTP20)<br />
does not affect these qualitative results (see Table B6).<br />
Our results concerning the socio-demographic covariates of life satisfaction are<br />
consistent with common findings from the international literature (see Frey <strong>and</strong> Stutzer<br />
2002 for a survey). This enhances our confidence in the adequacy of using data from the<br />
World Values Surveys in studying the relationship between pro-environment behaviors <strong>and</strong><br />
subjective well-being.<br />
4.2 <strong>Pro</strong>-Environment Consumption <strong>and</strong> Life Satisfaction<br />
In considering the relationship between life satisfaction <strong>and</strong> pro-environment consumption,<br />
it should be noted that all results pertinent to that relationship control for the covariates<br />
discussed in the preceding subsection. This implies, especially, that significant coefficients<br />
for the environmental variables do not implicitly measure positive life satisfaction effects<br />
of better health or higher personal or national income, even if pro-environment behaviors<br />
are correlated with these latter variables.<br />
Table 1 presents estimation results when attitude variables are disregarded. As<br />
regression A shows, consumption of environment-friendly goods goes along with<br />
significantly greater life satisfaction. The size of the coefficient is comparable to that of
<strong>Pro</strong>-<strong>Environmental</strong> <strong>Behavior</strong> <strong>and</strong> <strong>Rational</strong> <strong>Consumer</strong> <strong>Choice</strong> 18<br />
having elementary education vs. having no education <strong>and</strong> amounts to almost two thirds of<br />
the coefficient of being employed vs. being unemployed. According to regression B,<br />
recycling is also positively <strong>and</strong> significantly associated with greater life satisfaction, the<br />
coefficient being somewhat smaller than in regression A. An almost identical result holds<br />
with respect to water conservation (regression C). When the three pro-environment<br />
behaviors are included jointly (regression D), the associated coefficients become smaller.<br />
This is to be expected, given the correlations between these behaviors (see Table B3).<br />
However, in spite of these correlations, all three coefficients remain highly significant.<br />
Table 1 also shows that people are more satisfied when the respective behaviors are more<br />
widespread in their societies (variable QSoc) 19 , probably indicating the utility from better<br />
environmental quality.<br />
These results suggest that, controlling for nationality, time <strong>and</strong> the spread of proenvironmental<br />
behaviors as well as individual socio-economic characteristics, an<br />
individual is better off when displaying pro-environment consumption behavior.<br />
Alternatively, however, these results may arise because people with pro-environment<br />
attitudes – which trigger these behaviors – are more satisfied per se. This possibility is<br />
being checked in the regressions presented in Table 2. These regressions, A’ - D’, are<br />
similar to regressions A – D in Table 1 but include indicators of pro-environment attitudes<br />
(EnvPriority, WTP20) in addition to pro-environment behaviors. It can be seen that these<br />
attitudes are in fact significantly associated with greater life satisfaction. Nevertheless, the<br />
coefficients of the behaviors remain positive <strong>and</strong> significant. They are, however, of a<br />
smaller size than in their counterparts A – D, especially in the case of water conservation.<br />
19 In regression D, QSoc is the average across the three behaviors.
<strong>Pro</strong>-<strong>Environmental</strong> <strong>Behavior</strong> <strong>and</strong> <strong>Rational</strong> <strong>Consumer</strong> <strong>Choice</strong> 19<br />
Table 1: Estimated Life Satisfaction Equations. Attitudes not Included.<br />
A B C D<br />
Household income 0.067 0.066 0.068 0.066<br />
(23.12) (23.39) (23.93) (22.50)<br />
Green<strong>Pro</strong>ducts 0.116<br />
0.082<br />
(8.76)<br />
(5.55)<br />
Recycling<br />
0.102<br />
0.049<br />
(7.74)<br />
(3.25)<br />
WaterConservation 0.105 0.074<br />
(8.43) (5.38)<br />
QSoc<br />
0.017 0.017 0.016 0.016<br />
(8.58) (8.77) (8.30) (8.30)<br />
Attitudes No No No No<br />
Country Dummies Yes Yes Yes Yes<br />
Year dummies Yes Yes Yes Yes<br />
Demographics Yes Yes Yes Yes<br />
Pseudo R 2 0.270 0.276 0.275 0.274<br />
Observations 29588 30414 30904 28465<br />
Dependent variable: life satisfaction, Method: ordered probit. Cluster-robust z-statistics in<br />
parentheses.<br />
Table 2: Estimated Life Satisfaction Equations. Attitudes Included.<br />
A’ B’ C’ D’<br />
Household income 0.063 0.062 0.063 0.062<br />
(19.69) (19.66) (20.16) (19.16)<br />
Green<strong>Pro</strong>ducts 0.085<br />
0.060<br />
(5.80)<br />
(3.75)<br />
Recycling<br />
0.085<br />
0.047<br />
(5.70)<br />
(2.86)<br />
WaterConservation 0.069 0.044<br />
(4.96) (2.92)<br />
QSoc<br />
0.015 0.015 0.015 0.014<br />
(7.02) (7.09) (7.12) (6.88)<br />
EnvPriority<br />
0.088 0.086 0.088 0.084<br />
(6.27) (6.16) (6.36) (5.82)<br />
WTP20<br />
0.133 0.130 0.134 0.127<br />
(9.54) (9.38) (9.77) (8.89)<br />
Country Dummies Yes Yes Yes Yes<br />
Year dummies Yes Yes Yes Yes<br />
Demographics Yes Yes Yes Yes<br />
Pseudo R 2 0.259 0.262 0.261 0.261<br />
Observations 24069 24593 24944 23291<br />
Dependent variable: life satisfaction, Method: ordered probit. Cluster-robust z-statistics in<br />
parentheses.
<strong>Pro</strong>-<strong>Environmental</strong> <strong>Behavior</strong> <strong>and</strong> <strong>Rational</strong> <strong>Consumer</strong> <strong>Choice</strong> 20<br />
We thus find that pro-environment behaviors are associated with greater subjective wellbeing,<br />
even when we control for differences concerning attitudes towards the environment.<br />
The coefficients are of sizeable magnitude. Using the coefficient of (un)employment as a<br />
benchmark, the coefficients of the pro-environment behaviors amount to about one fourth.<br />
The coefficient is largest in the case of consuming green products <strong>and</strong> smallest in the case<br />
of water conservation.<br />
Against the background of our theoretical framework, significant positive coefficients<br />
suggest that pro-environment consumption is less than individually rational. This applies<br />
particularly with respect to green products <strong>and</strong> less so with respect to recycling <strong>and</strong> water<br />
conservation. The latter finding is consistent with the idea that intrinsic motives may be<br />
more important in the case of buying green products than with respect to recycling <strong>and</strong><br />
water conservation, as financial considerations may play a role in these latter cases.<br />
4.3 Distorted <strong>Choice</strong> <strong>and</strong> Materialistic Values<br />
One of the propositions discussed in section 2 states that more materialistically oriented<br />
individuals may be subject to greater choice distortions <strong>and</strong> utility losses than less<br />
materialistically oriented persons. We check this proposition by means of the following<br />
attitude question from the World Value Surveys:<br />
“People sometimes talk about what the aims of this country should be for the next ten<br />
years. On this card are listed some of the goals which different people would give top<br />
priority. Would you please say which one of these you, yourself, consider the most<br />
important? First choice:<br />
• A high level of economic growth<br />
• Strong defence forces<br />
• People have more say about how things are done<br />
• Trying to make our cities <strong>and</strong> countryside more beautiful”<br />
We call this item Materialism <strong>and</strong> code it as follows: Materialism = 1 if “A high level of<br />
economic growth” is the respondent’s first choice <strong>and</strong> Materialism = 0 if it is not the first<br />
choice.<br />
We include Materialism in the life satisfaction equation both as a separate explanatory<br />
variable <strong>and</strong> as an interaction term with our pro-environment behaviors. In doing so, we<br />
continue to include the attitude variables from Table 2. The results are displayed in Table<br />
3.
<strong>Pro</strong>-<strong>Environmental</strong> <strong>Behavior</strong> <strong>and</strong> <strong>Rational</strong> <strong>Consumer</strong> <strong>Choice</strong> 21<br />
Table 3: Estimated Life Satisfaction Equations with Materialistic Values<br />
<strong>Behavior</strong>:<br />
<strong>Behavior</strong>:<br />
<strong>Behavior</strong>:<br />
Green<strong>Pro</strong>ducts Recycling WaterConservation<br />
Household income 0.063<br />
0.062<br />
0.063<br />
(19.61)<br />
(19.58)<br />
(20.13)<br />
<strong>Behavior</strong> 0.040<br />
0.037<br />
0.051<br />
(1.72)<br />
(1.58)<br />
(2.24)<br />
Materialism -0.053<br />
-0.057<br />
-0.036<br />
(2.55)<br />
(2.77)<br />
(1.73)<br />
<strong>Behavior</strong>*<br />
0.071<br />
0.075<br />
0.028<br />
Materialism<br />
(2.53)<br />
(2.68)<br />
(1.01)<br />
QSoc<br />
0.015<br />
0.015<br />
0.014<br />
(7.04)<br />
(7.07)<br />
(7.08)<br />
EnvPriority<br />
0.087<br />
0.085<br />
0.086<br />
(6.15)<br />
(6.08)<br />
(6.20)<br />
WTP20<br />
0.132<br />
0.128<br />
0.132<br />
(9.41)<br />
(9.23)<br />
(9.57)<br />
Country Dummies Yes Yes Yes<br />
Year dummies Yes Yes Yes<br />
Demographics Yes Yes Yes<br />
Pseudo R 2 0.259 0.261 0.260<br />
Observations 23845 24363 24708<br />
Dependent variable: life satisfaction, Method: ordered probit. Cluster-robust z-statistics in<br />
parentheses.<br />
The first observation to be made is that a materialistic value orientation is significantly<br />
associated with less life satisfaction, a finding which is consistent with previous literature<br />
(see Frey <strong>and</strong> Stutzer 2002). Quantitatively, considering growth to be the most important<br />
national goal is associated with a similar loss in life satisfaction as a drop in household<br />
income by one category on the 10-point scale.<br />
Including materialism <strong>and</strong> the behavior-materialism interactions implies that the<br />
coefficients on green products <strong>and</strong> on recycling become insignificant, whereas the<br />
interactions of green products with materialism <strong>and</strong> of recycling with materialism both<br />
have positive <strong>and</strong> significant coefficients. If our interpretation is valid, choice distortions<br />
with respect to these two types of environment-friendly behavior are thus predominantly to<br />
be found in people holding materialistic values. However, since their share in our sample is<br />
about 61 percent (see Table B2), these distortions are not a minority phenomenon. Since<br />
these people are likely to place a large weight on the level of consumption – as opposed to<br />
the environmentally relevant quality – an overrating of the utility from a higher<br />
consumption level may play a particularly large role in biasing their choice away from<br />
environmental friendliness.<br />
This finding applies to the consumption of green products <strong>and</strong> to recycling, but not to<br />
water conservation. In this case, the coefficient on the un-interacted behavior remains<br />
significant <strong>and</strong> is only somewhat diminished in comparison with its counterpart in Table 2.
<strong>Pro</strong>-<strong>Environmental</strong> <strong>Behavior</strong> <strong>and</strong> <strong>Rational</strong> <strong>Consumer</strong> <strong>Choice</strong> 22<br />
The interaction with materialism is insignificant in this case. <strong>Choice</strong> distortions with<br />
respect to water conservation thus affect materialists <strong>and</strong> non-materialists alike. Different<br />
weights placed on the level of consumption do not appear to have an effect on the choice<br />
with respect to water conservation.<br />
In addition to the materialism proxy mentioned above, we checked these results using<br />
another indicator which takes the value 1 if “a good income” is considered the most<br />
important feature of a job vis a vis several alternatives (“a safe job with no risk”, “working<br />
with people you like”, “doing an important job” <strong>and</strong> “do something for community”). This<br />
attitude indicator is also negatively associated with life satisfaction (as is Materialism) <strong>and</strong><br />
its interaction with green products has a positive (though insignificant) coefficient.<br />
4.4 Distorted <strong>Choice</strong> <strong>and</strong> Cognitive Conditions<br />
The accuracy of affective forecasting may depend on cognitive conditions such as general<br />
education or familiarity with the choices under consideration. To address this issue, we<br />
consider life satisfaction regressions which include interactions of pro-environmental<br />
behaviors with measures of education levels <strong>and</strong> of familiarity with pro-environmental<br />
behavior.<br />
Table 4 presents the results with respect to levels of general education. The coefficient<br />
values shown in the line ‘behavior’ refer to the reference group of people with no formal<br />
education, whereas the coefficients in the lines containing the interactions measure<br />
differences from that reference group. For all three behaviors, the coefficients for the<br />
reference group are considerably larger than in the counterpart regressions from Table 2.<br />
People without formal education are thus particularly liable to committing mistakes in their<br />
environmentally relevant choices. The coefficients on the behavior-education interactions<br />
are always negative, which means that the mistakes are smaller in better educated people.<br />
Having secondary education reduces mistakes significantly <strong>and</strong> to a considerable extent.<br />
Having university education reduces the mistakes even further. In the case of green<br />
products, mistakes are 80 percent smaller in people with university education relative to<br />
the reference group.
<strong>Pro</strong>-<strong>Environmental</strong> <strong>Behavior</strong> <strong>and</strong> <strong>Rational</strong> <strong>Consumer</strong> <strong>Choice</strong> 23<br />
Table 4: Estimated Life Satisfaction Equations with <strong>Behavior</strong>-Education Interactions<br />
<strong>Behavior</strong>:<br />
<strong>Behavior</strong>:<br />
<strong>Behavior</strong>:<br />
Green<strong>Pro</strong>ducts Recycling WaterConservation<br />
Household income 0.063<br />
0.061<br />
0.063<br />
(19.64)<br />
(19.54)<br />
(20.06)<br />
<strong>Behavior</strong><br />
0.175<br />
0.145<br />
0.180<br />
(3.76)<br />
(3.14)<br />
(4.15)<br />
<strong>Behavior</strong>*<br />
-0.071<br />
-0.007<br />
-0.093<br />
ElemEdu<br />
(1.19)<br />
(0.12)<br />
(1.66)<br />
<strong>Behavior</strong>*<br />
-0.075<br />
-0.107<br />
-0.149<br />
IncomplSecEdu<br />
(1.14)<br />
(1.65)<br />
(2.39)<br />
<strong>Behavior</strong>*<br />
-0.108<br />
-0.118<br />
-1.30<br />
SecondaryEdu<br />
(1.96)<br />
(2.17)<br />
(2.52)<br />
<strong>Behavior</strong>*<br />
-0.060<br />
-0.030<br />
-0.043<br />
IntermedGenEdu (0.96)<br />
(0.48)<br />
(0.71)<br />
<strong>Behavior</strong>*<br />
-0.073<br />
-0.003<br />
-0.131<br />
MaturityLevelEdu (1.25)<br />
(0.05)<br />
(2.35)<br />
<strong>Behavior</strong>*<br />
-0.162<br />
-0.098<br />
-0.180<br />
SomeUnivEdu<br />
(2.45)<br />
((1.47)<br />
(2.86)<br />
<strong>Behavior</strong>*<br />
-0.139<br />
-0.110<br />
-0.133<br />
UnivEdu<br />
(2.40)<br />
(1.92)<br />
(2.44)<br />
QSoc<br />
0.015<br />
0.015<br />
0.015<br />
(7.02)<br />
(7.05)<br />
(7.23)<br />
EnvPriority<br />
0.089<br />
0.086<br />
0.089<br />
(6.31)<br />
(6.20)<br />
(6.42)<br />
WTP20<br />
0.133<br />
0.129<br />
0.133<br />
(9.52)<br />
(9.36)<br />
(9.72)<br />
Country Dummies Yes Yes Yes<br />
Year dummies Yes Yes Yes<br />
Demographics Yes Yes Yes<br />
Pseudo R 2 0.259 0.263 0.261<br />
Observations 24069 24593 24944<br />
Dependent variable: life satisfaction, Method: ordered probit. Cluster-robust z-statistics in<br />
parentheses.<br />
To proxy for general familiarity with pro-environmental behaviors we use the percentage<br />
of people who say they have engaged in these behaviors (QSoc). When we include<br />
interactions between the individual behaviors <strong>and</strong> these percentages, we find the<br />
interactions to be negative <strong>and</strong> significant in the cases of green products <strong>and</strong> recycling<br />
(Table 5). The coefficients of the un-interacted behaviors are larger than in the counterpart<br />
regressions in Table 2. We thus conclude that when green products <strong>and</strong> recycling are more<br />
widespread in society, mistakes concerning these behaviors become smaller. This may be<br />
taken to indicate that some ‘social learning’ of the utility from these activities takes place.<br />
In the case of water conservation, the coefficient on the interaction term is also negative,<br />
but insignificant. ‘Social learning’ thus seems to be less marked, possibly because water
<strong>Pro</strong>-<strong>Environmental</strong> <strong>Behavior</strong> <strong>and</strong> <strong>Rational</strong> <strong>Consumer</strong> <strong>Choice</strong> 24<br />
conservation is an activity which is less visible than consumption of green products or<br />
recycling.<br />
Table 5: Estimated Life Satisfaction Equations with <strong>Behavior</strong>-Familiarity Interactions<br />
<strong>Behavior</strong>:<br />
<strong>Behavior</strong>:<br />
<strong>Behavior</strong>:<br />
Green<strong>Pro</strong>ducts Recycling WaterConservation<br />
Household income 0.062<br />
0.062<br />
0.063<br />
(19.64)<br />
(19.57)<br />
(20.13)<br />
<strong>Behavior</strong><br />
0.297<br />
0.258<br />
0.138<br />
(6.09)<br />
(5.03)<br />
(3.13)<br />
<strong>Behavior</strong>*<br />
-0.004<br />
-0.004<br />
-0.001<br />
QSoc<br />
(4.55)<br />
(3.53)<br />
(1.65)<br />
QSoc<br />
0.018<br />
0.018<br />
0.016<br />
(8.19)<br />
(7.92)<br />
(7.21)<br />
EnvPriority<br />
0.090<br />
0.087<br />
0.088<br />
(6.36)<br />
(6.22)<br />
(6.37)<br />
WTP20<br />
0.134<br />
0.130<br />
0.134<br />
(9.60)<br />
(9.43)<br />
(9.77)<br />
Country Dummies Yes Yes Yes<br />
Year dummies Yes Yes Yes<br />
Demographics Yes Yes Yes<br />
Pseudo R 2 0.260 0.262 0.261<br />
Observations 24069 24593 24944<br />
Dependent variable: life satisfaction, Method: ordered probit. Cluster-robust z-statistics in<br />
parentheses.<br />
5 Conclusions<br />
Previous literature in behavioral economics has shown that people systematically<br />
mispredict the utility consequences of their choices. This implies that people make<br />
distorted choices which fail to be utility-maximizing even by their own st<strong>and</strong>ards.<br />
Specifically, choices are distorted towards goals that are predominantly extrinsically<br />
motivated (acquisition <strong>and</strong> possession) <strong>and</strong> away from more intrinsically motivated goals.<br />
In addition, people are more inclined towards such distortions the more materialistic their<br />
general value orientation is.<br />
From a methodological point of view, discrimination between the distorted choice<br />
hypothesis <strong>and</strong> the familiar rational choice model requires that choices <strong>and</strong> their utility<br />
consequences can be measured independently. Revealed-preference methods fail to allow<br />
for such a discrimination since they are based on the rationality assumption <strong>and</strong>, hence, do<br />
not permit to test that assumption. By contrast, using data on life satisfaction as an<br />
empirical approximation to experienced utility allows for such a test.<br />
This paper has used life satisfaction data to explore the hypothesis that consumer<br />
behavior may be distorted towards the quantity consumed <strong>and</strong> away from the pro-
<strong>Pro</strong>-<strong>Environmental</strong> <strong>Behavior</strong> <strong>and</strong> <strong>Rational</strong> <strong>Consumer</strong> <strong>Choice</strong> 25<br />
environment quality of consumption. This hypothesis reflects the idea that environmentfriendly<br />
consumption may be driven, at least in part, by intrinsic motives (such as empathy<br />
or altruism). The empirical strategy has involved estimation of appropriately specified life<br />
satisfaction equations with environment-friendliness of consumption among the<br />
explanatory variables.<br />
The empirical analysis has been based on a choice-theoretic model of proenvironmental<br />
consumption. <strong>Rational</strong>, utility-maximizing choice in such a framework<br />
would imply a vanishing coefficient for environmental friendliness, whereas a positive<br />
coefficient suggests that the choice of environmental friendliness is biased downwards.<br />
The framework has also highlighted several channels through which these distortions may<br />
arise: (a) an under-rating of the utility from more environmental-friendliness of<br />
consumption, (b) an over-rating of the costs of more environmental-friendliness of<br />
consumption, (c) an over-rating of the utility from the quantity consumed.<br />
Our ordered-probit life satisfaction regressions, involving about 30,000 individuals<br />
around the world, yield positive <strong>and</strong> significant coefficients for several indicators of proenvironment<br />
behavior. These results suggest that people under-rate the utility<br />
consequences of environment-friendly consumption. The results are robust to controlling<br />
not only for socio-demographic characteristics but also for differences in personal<br />
attitudes. Especially, the results do not merely reflect differences in environmental<br />
preferences. Under-rating of utility from environment-friendly consumption tends to be<br />
more pronounced in individuals with materialistic value orientations (except for the case of<br />
water conservation). This is consistent with the idea that the under-rating of<br />
environmentally relevant quality of consumption is partly the mirror image of an overrating<br />
of the quantity consumed. However, we also find that cognitive factors related to<br />
general education <strong>and</strong> familiarity with pro-environmental behaviors affect the size of the<br />
distortion. This seems to indicate that genuine misjudgements of the benefits <strong>and</strong> costs of<br />
pro-environmental behaviors also play a role. Overall, it appears that both attitudinal <strong>and</strong><br />
cognitive aspects are relevant for explaining less than individually rational choices of proenvironmental<br />
As always in behavior. life satisfaction research, a major caveat refers to the possibility that our<br />
variables of interest are correlated with unobserved determinants of life satisfaction,<br />
especially personality traits. Our data does not permit to address this problem in an optimal<br />
fashion, by using individual fixed effects. However, by including a large array of sociodemographic<br />
<strong>and</strong> attitudinal variables, we control for this issue in the best possible way.<br />
Future research may involve checking the robustness of our findings, as appropriate<br />
longitudinal panel data become available.
<strong>Pro</strong>-<strong>Environmental</strong> <strong>Behavior</strong> <strong>and</strong> <strong>Rational</strong> <strong>Consumer</strong> <strong>Choice</strong> 26<br />
6 References<br />
Andreoni, J. (1990), Impure Altruism <strong>and</strong> Donations to Public Goods: A Theory of Warm-<br />
Glow Giving, Economic Journal 100, 464-477.<br />
Bruni, L., Porta, P., eds. (2007), Economics <strong>and</strong> Happiness: Framing the Analysis, Oxford:<br />
Oxford University Press.<br />
Carroll, N., Frijters, P., Shields, M.A. (2008), Quantifying the Costs of Drought: New<br />
Evidence from Life Satisfaction Data, Journal of Population Economics,<br />
forthcoming.<br />
Clark, A.E., Georgellis, Y., Sanfey, S. (2001), Scarring: The Psychological Impact of Past<br />
Unemployment, Economica 68, 221-241.<br />
Clark, A.E., Frijters, P., Shields, M.A. (2008), Relative Income, Happiness <strong>and</strong> Utility: An<br />
Explanation for the Easterlin Paradox <strong>and</strong> Other Puzzles, Journal of Economic<br />
Literature 46, 95-144.<br />
Deci, E.L., Ryan, R.M. (2000), The “What” <strong>and</strong> “Why” of Goal Pursuits: Human Needs<br />
<strong>and</strong> the Self-Determination of <strong>Behavior</strong>, Psychological Inquiry 11, 227-268.<br />
Di Tella, R., MacCulloch, R. (2006), Some Uses of Happiness Data in Economics, Journal<br />
of Economic Perspectives 20, 25-46.<br />
Easterlin, R. A. (2001), Income <strong>and</strong> Happiness: Towards a Unified Theory, Economic<br />
Journal 111, 465-484.<br />
Ferrer-i-Carbonell, A., Gowdy, J. (2007), <strong>Environmental</strong> Degradation <strong>and</strong> Happiness,<br />
Ecological Economics 60, 509-516.<br />
Frederick, S., Loewenstein, G. (1999), Hedonic Adaptation, in: Kahneman, D., Diener, E.,<br />
Schwarz, N. (eds.), Well-Being: The Foundations of Hedonics Psychology,<br />
Chapter 16, New York: Russell Sage Foundation.<br />
Frey, B.S., Stutzer, A. (2002), What Can Economists Learn from Happiness Research?,<br />
Journal of Economic Literature 40, 402-435.<br />
Frey, B.S., Stutzer, A. (2004), Economic Consequences of Mispredicting Utility, Working<br />
Paper No. 218, Institute for Empirical Research in Economics, University of<br />
Zurich.<br />
Frijters, P., Van Praag, B. (1998), The Effects of Climate on Welfare <strong>and</strong> Well-Being in<br />
Russia, Climate Change 39, 61-81.<br />
Gilbert, D.T., Pinel, E.C., Wilson, T.D., Blumberg, S.J., Wheatley, T.P. (1998), Immune<br />
Neglect: A Source of Durability Bias in Affective Forecasting, Journal of<br />
Personality <strong>and</strong> Social Psychology 75, 617-638.<br />
Harbaugh, W.T. (1998), The Prestige Motive for Making Charitable Transfers, American<br />
Economic Review 88, 277-282.<br />
Israel, D., Levinson, A. (2003), Examining the Relationship between Household<br />
Satisfaction <strong>and</strong> Pollution, Manuscript, Indiana State University.
<strong>Pro</strong>-<strong>Environmental</strong> <strong>Behavior</strong> <strong>and</strong> <strong>Rational</strong> <strong>Consumer</strong> <strong>Choice</strong> 27<br />
Kahneman, D. Wakker, P.P., Sarin, R. (1997), Back to Bentham? Explorations of<br />
Experienced Utility, Quarterly Journal of Economics 112, 375-405.<br />
Kahneman, D., Sugden, R. (2005), Experienced Utility as a St<strong>and</strong>ard of Policy Evaluation,<br />
<strong>Environmental</strong> <strong>and</strong> Resource Economics 32, 161-181.<br />
Kasser, T., Ryan, R.M. (1996), Further Examining the American Dream: Differential<br />
Correlates of Intrinsic <strong>and</strong> Extrinsic Goals, Personality <strong>and</strong> Social Psychology<br />
Bulletin 22, 280-287.<br />
Layard, R. (2005), Happiness: Lessons from a New Science, New York: Penguin.<br />
Layard, R. (2007), Rethinking Public Economics: The Implications of Rivalry <strong>and</strong> Habit,<br />
in: Bruni, L., Porta, P. (eds.), Economics <strong>and</strong> Happiness: Framing the Analysis,<br />
Oxford: Oxford University Press.<br />
Loewenstein, G., Adler, D. (1995), A Bias in the Prediction of Tastes, Economic Journal<br />
105, 929-937.<br />
Loewenstein, G., Schkade, D.A. (1999), Wouldn’t It Be Nice? Predicting Future Feelings,<br />
in: Kahneman, D., Diener, E., Schwarz, N. (eds.), Well Being: The Foundations<br />
of Hedonic Psychology, New York: Russell Sage Foundation.<br />
Loewenstein, G., O’Donoghue, T., Rabin, M. (2003), <strong>Pro</strong>jection Bias in Predicting Future<br />
Utility, Quarterly Journal of Economics 118, 1209-1248.<br />
Luechinger, S., Raschky, P.A. (2006), Measuring the Effects of Natural Hazards on<br />
Society: The Life Satisfaction Approach, Manuscript, University of Zurich.<br />
Maslow, A. (1968), Towards a Psychology of Being, 2 nd Edition, New York: Van<br />
Nostr<strong>and</strong>.<br />
Meier, S., Stutzer, A. (2008), Is Volunteering Rewarding in Itself? Economica, 75, 39-59.<br />
Rehdanz, K., Maddison, D. (2005), Climate <strong>and</strong> Happiness, Ecological Economics 52,<br />
111-125.<br />
Rogers, C. (1961), On Becoming a Person, Boston: Houghton Mifflin.<br />
Simon, H. A. (1972), Theories of Bounded <strong>Rational</strong>ity, in: McGuire, C.B., Radner, R.<br />
(eds.), Decision <strong>and</strong> Organization, Amsterdam: North Holl<strong>and</strong>.<br />
Sirgy, M.J. (1998), Materialism <strong>and</strong> Quality of Life, Social Indicators Research 43, 227-<br />
260.<br />
Stutzer, A. (2004), The Role of Income Aspirations in Individual Happiness, Journal of<br />
Economic <strong>Behavior</strong> <strong>and</strong> Organization 54, 89-109.<br />
Stutzer, A., Frey, B.S. (2007), What Happiness Research Can Tell Us about Self-Control<br />
<strong>Pro</strong>blems <strong>and</strong> Utility Misprediction, in: B.S. Frey <strong>and</strong> A. Stutzer (eds.),<br />
Economics <strong>and</strong> Psychology: A <strong>Pro</strong>mising New Cross-Disciplinary Field,<br />
Cambridge (MA) <strong>and</strong> London: MIT Press, 169-195.<br />
The European Values Study Foundation <strong>and</strong> World Values Survey Association, European<br />
<strong>and</strong> World Values Surveys four-wave integrated data file, 1981-2004,<br />
v.20060423, 2006, Aggregate File <strong>Pro</strong>ducers: ASEP/JDS, Madrid, Spain/Tilburg
<strong>Pro</strong>-<strong>Environmental</strong> <strong>Behavior</strong> <strong>and</strong> <strong>Rational</strong> <strong>Consumer</strong> <strong>Choice</strong> 28<br />
University, Tilburg, the Netherl<strong>and</strong>s. Aggregate File Distributors: ASEP/JDS <strong>and</strong><br />
ZA, Cologne, Germany.<br />
Van Praag, B. (1993), The Relativity of the Welfare Concept, in: Nussbaum, M., Sen, A.<br />
(eds.), The Quality of Life; New York: Oxford University Press.<br />
Van Praag, B., Baarsma, B. (2005) Using Happiness Surveys to Value Intangibles: The<br />
Case of Airport Noise, Economic Journal 52, 111-125.<br />
Welsch, H. (2002), Preferences over <strong>Pro</strong>sperity <strong>and</strong> Pollution: <strong>Environmental</strong> Valuation<br />
Based on Happiness Surveys, Kyklos 55, 473-494.<br />
Welsch, H. (2006), Environment <strong>and</strong> Happiness: Valuation of Air Pollution Using Life<br />
Satisfaction Data, Ecological Economics 58, 801-813.<br />
Welsch, H. Kühling, J. (2008) , Using Happiness Data for <strong>Environmental</strong> Valuation: Issues<br />
<strong>and</strong> Appkications, Journal of Economic Surveys, forthcoming.<br />
Wilson, T.D., Gilbert, D.T. (2003), Affective Forecasting, in: M. Zanna (ed.), Advances in<br />
Experimental Social Psychology, Vol. 35, New York: Elsevier, 345-411.
<strong>Pro</strong>-<strong>Environmental</strong> <strong>Behavior</strong> <strong>and</strong> <strong>Rational</strong> <strong>Consumer</strong> <strong>Choice</strong> 29<br />
7 Appendix A<br />
The first <strong>and</strong> second derivatives with respect to q of the semi-reduced utility function read<br />
as follows:<br />
V = U X + U + U ,<br />
V<br />
q<br />
qq<br />
x<br />
= ( U<br />
= U<br />
xx<br />
xx<br />
q<br />
X<br />
X<br />
2<br />
q<br />
q<br />
q<br />
+ U<br />
xq<br />
+ 2(<br />
U<br />
xq<br />
Q<br />
+ U<br />
xQ<br />
+ U<br />
) X<br />
xQ<br />
q<br />
) X<br />
+ U<br />
q<br />
x<br />
+ U<br />
X<br />
x<br />
qq<br />
X<br />
+ U<br />
qq<br />
qx<br />
+ U<br />
X<br />
qq<br />
q<br />
+ U<br />
+ U<br />
QQ<br />
qq<br />
+ U<br />
+ 2U<br />
With the properties of the utility function <strong>and</strong> of the unit cost function stated in (1) <strong>and</strong> (2),<br />
2<br />
respectively, U xx X q + 2(<br />
U xq + U xQ ) X q < 0 . Then V qq < 0 if U x X qq + U qq + UQQ<br />
+ 2U<br />
qQ is<br />
negative or not too positive. A sufficient condition for this to be the case is that (a) X < 0<br />
<strong>and</strong> (b) U qQ < −(<br />
U qq + U QQ ) / 2 . Since<br />
2<br />
y<br />
Pq<br />
( q)<br />
X qq = − [ P ( q)<br />
2 ]<br />
2 qq − , condition (a)<br />
P(<br />
q)<br />
P(<br />
q)<br />
requires that Pqq is sufficiently large. Condition (b) requires that ( qq QQ ) U − U + is<br />
sufficiently large. Overall, the requirement for Vqq < 0 is that the marginal cost with respect<br />
to q increases <strong>and</strong> the marginal utility with respect to q decrease at sufficiently large rates.<br />
qQ<br />
qQ<br />
+ U<br />
Qx<br />
X<br />
q<br />
+ U<br />
Qq<br />
+ U<br />
QQ<br />
.<br />
<strong>Pro</strong>-<strong>Environmental</strong> <strong>Behavior</strong> <strong>and</strong> <strong>Rational</strong> <strong>Consumer</strong> <strong>Choice</strong> 30<br />
8 Appendix B<br />
Table B1: Country-year configurations in which WVS asked for pro-environment<br />
behaviors <strong>and</strong> attitudes<br />
Green<strong>Pro</strong>ducts (1994-1998)<br />
Albania [1998], Argentina [1995], Armenia [1997], Australia [1995], Azerbaijan [1997], Bangladesh<br />
[1996], Belarus [1996], Bosnia <strong>and</strong> Herzegovina [1998], Brazil [1997], Bulgaria [1997], Chile [1996],<br />
China [1995], Croatia [1996], Czech Republic [1998], Dominican Republic [1996], Estonia [1996], Finl<strong>and</strong><br />
[1996], Georgia [1996], Germany [1997], Hungary[1998], India [1995], Japan [1995], Latvia [1996],<br />
Lithuania [1997], Macedonia, Republic of [1998], Mexico [1996], New Zeal<strong>and</strong> [1998], Nigeria [1995],<br />
Norway [1996], Peru [1996], Philippines [1996], Pol<strong>and</strong> [1997], Puerto Rico [1995], Republic of Korea<br />
[1996], Romania [1998], Russian Federation [1995], Serbia <strong>and</strong> Montenegro [1996], Slovakia [1998],<br />
Slovenia [1995], South Africa [1996], Spain [1995], Sweden [1996], Taiwan <strong>Pro</strong>vince of China [1994],<br />
United States [1995], Uruguay [1996], Venezuela [1996]<br />
Recycling (1994-1999)<br />
Albania [1998], Argentina [1995], Armenia [1997], Australia [1995], Azerbaijan [1997], Bangladesh<br />
[1996], Belarus [1996], Bosnia <strong>and</strong> Herzegovina [1998], Brazil [1997], Bulgaria [1997], Chile [1996],<br />
China [1995], Croatia [1996], Czech Republic [1998], Dominican Republic [1996], El Salvador [1999],<br />
Estonia [1996], Finl<strong>and</strong> [1996], Georgia [1996], Germany [1997], Hungary [1998], India [1995], Japan<br />
[1995], Lithuania [1997], Macedonia, Republic of [1998], Mexico [1996], New Zeal<strong>and</strong> [1998], Nigeria<br />
[1995], Norway [1996], Peru [1996], Philippines [1996], Pol<strong>and</strong> [1997], Puerto Rico [1995], Republic of<br />
Korea [1996], Romania [1998], Russian Federation [1995], Serbia <strong>and</strong> Montenegro [1996], Slovakia<br />
[1998], Slovenia [1995], South Africa [1996], Spain [1995], Sweden [1996], Taiwan <strong>Pro</strong>vince of China<br />
[1994], United States [1995], Uruguay [1996], Venezuela [1996]<br />
WaterConservation (1994-1999)<br />
Albania [1998], Argentina [1995], Armenia [1997], Australia [1995], Azerbaijan [1997], Bangladesh<br />
[1996], Belarus [1996], Bosnia <strong>and</strong> Herzegovina [1998], Brazil [1997], Bulgaria [1997], Chile [1996],<br />
China [1995], Croatia [1996], Czech Republic [1998], Dominican Republic [1996], El Salvador [1999],<br />
Estonia [1996], Finl<strong>and</strong> [1996], Georgia [1996], Germany [1997], Hungary [1998], India [1995], Japan<br />
[1995], Latvia [1996], Lithuania [1997], Macedonia, Republic of [1998], Mexico [1996], New Zeal<strong>and</strong><br />
[1998], Nigeria [1995], Norway [1996], Peru [1996], Philippines [1996], Pol<strong>and</strong> [1997], Puerto Rico<br />
[1995], Republic of Korea [1996], Republic of Moldova [1996], Romania [1998], Russian Federation<br />
[1995], Serbia <strong>and</strong> Montenegro [1996], Slovakia [1998], Slovenia [1995], South Africa [1996], Spain<br />
[1995], Sweden [1996], Taiwan <strong>Pro</strong>vince of China [1994], Ukraine [1996], United States [1995], Uruguay<br />
[1996], Venezuela [1996]<br />
EnvPriority (1994-2002)<br />
Albania [1998], Albania [2002], Algeria [2002], Argentina [1995], Argentina [1999], Armenia [1997],<br />
Australia [1995], Azerbaijan [1997], Bangladesh [1996], Bangladesh [2002], Belarus [1996], Bosnia <strong>and</strong><br />
Herzegovina [1998], Bosnia <strong>and</strong> Herzegovina [2001], Brazil [1997], Bulgaria [1997], Canada [2000],
<strong>Pro</strong>-<strong>Environmental</strong> <strong>Behavior</strong> <strong>and</strong> <strong>Rational</strong> <strong>Consumer</strong> <strong>Choice</strong> 31<br />
Chile [1996], Chile [2000], China [1995], China [2001], Croatia [1996], Czech Republic [1998],<br />
Dominican Republic [1996], Egypt [2000], El Salvador [1999], Estonia [1996], Finl<strong>and</strong> [1996], Georgia<br />
[1996], Germany [1997], Hungary [1998], India [1995], India [2001], Indonesia [2001], Iran (Islamic<br />
Republic of) [2000], Israel [2001], Japan [1995], Japan [2000], Jordan [2001], Kyrgyzstan [2003], Latvia<br />
[1996], Lithuania [1997], Macedonia, Republic of [1998], Macedonia, Republic of [2001], Mexico [1996],<br />
Mexico [2000], Morocco [2001], Morocco [2001], New Zeal<strong>and</strong> [1998], Nigeria [1995], Nigeria [2000],<br />
Norway [1996], Pakistan [1997], Pakistan [2001], Peru [1996], Peru [2001], Philippines [1996],<br />
Philippines [2001], Pol<strong>and</strong> [1997], Puerto Rico [1995], Puerto Rico [2001], Republic of Korea [1996],<br />
Republic of Korea [2001], Republic of Moldova [1996], Republic of Moldova [2002], Romania [1998],<br />
Russian Federation [1995], Saudi Arabia [2003], Serbia <strong>and</strong> Montenegro [1996], Serbia <strong>and</strong> Montenegro<br />
[2001], Singapore [2002], Slovakia [1998], Slovenia [1995], South Africa [1996], South Africa [2001],<br />
Spain [1995], Spain [2000], Sweden [1996], Sweden [1999], Switzerl<strong>and</strong> [1996], Taiwan <strong>Pro</strong>vince of China<br />
[1994], Tanzania, United Republic Of [2001], Turkey [1996], Turkey [2001], Ug<strong>and</strong>a [2001], Ukraine<br />
[1996], United States [1995], United States [1999], Uruguay [1996], Venezuela [1996], Venezuela [2000],<br />
Viet Nam [2001]<br />
WTP20 (1994-1999)<br />
Albania [1998], Argentina [1995], Armenia [1997], Australia [1995], Azerbaijan [1997], Bangladesh<br />
[1996], Belarus [1996], Bosnia <strong>and</strong> Herzegovina [1998], Brazil [1997], Bulgaria [1997], Chile [1996],<br />
China [1995], Croatia [1996], Czech Republic [1998], Dominican Republic [1996], El Salvador [1999],<br />
Estonia [1996], Finl<strong>and</strong> [1996], Georgia [1996], Germany [1997], Hungary [1998], India [1995], Japan<br />
[1995], Latvia [1996], Lithuania [1997], Macedonia, Republic of [1998], Mexico [1996], New Zeal<strong>and</strong><br />
[1998], Nigeria [1995], Norway [1996], Peru [1996], Philippines [1996], Pol<strong>and</strong> [1997], Puerto Rico<br />
[1995], Republic of Korea [1996], Republic of Moldova [1996], Romania [1998], Russian Federation<br />
[1995], Serbia <strong>and</strong> Montenegro [1996], Slovakia [1998], Slovenia [1995], South Africa [1996], Spain<br />
[1995], Sweden [1996], Switzerl<strong>and</strong> [1996], Taiwan <strong>Pro</strong>vince of China [1994], Turkey [1996], Ukraine<br />
[1996], United States [1995], Uruguay [1996], Venezuela [1996]
<strong>Pro</strong>-<strong>Environmental</strong> <strong>Behavior</strong> <strong>and</strong> <strong>Rational</strong> <strong>Consumer</strong> <strong>Choice</strong> 32<br />
Table B2: Summary statistics<br />
Variable N Minimu<br />
m<br />
Maximum Mean St<strong>and</strong>ard<br />
Deviation<br />
Life Satisfaction 263097 1.00 10.00 6.6157 2.48754<br />
Health 215997 1.00 5.00 3.7510 .92775<br />
Sex 267660 .00 1.00 .5196 .49962<br />
Age 264839 15.00 101.00 41.2372 16.33260<br />
Age 2 264839 225.00 10201.00 1967.2576 1514.62709<br />
Single 267870 .00 1.00 .2345 .42371<br />
Married 267870 .00 1.00 .5889 .49204<br />
Living together 267870 .00 1.00 .0416 .19976<br />
Divorced 267870 .00 1.00 .0360 .18640<br />
Separated 267870 .00 1.00 .0151 .12194<br />
Widowed 267870 .00 1.00 .0658 .24787<br />
Size household 244024 1.00 21.00 3.5985 1.93352<br />
No education 187668 .00 1.00 .1197 .32466<br />
Elementary education 187668 .00 1.00 .1523 .35927<br />
Incomplete<br />
education<br />
secondary 187668 .00 1.00 .0897 .28574<br />
Secondary education 187668 .00 1.00 .1640 .37028<br />
Intermediate general education 187668 .00 1.00 .0983 .29778<br />
Maturity<br />
education<br />
level certificate 187668 .00 1.00 .1652 .37139<br />
Some university education 187668 .00 1.00 .0740 .26177<br />
University education 187668 .00 1.00 .1367 .34356<br />
Full time employed 259689 .00 1.00 .3913 .48803<br />
Part time employed 259689 .00 1.00 .0739 .26155<br />
Self employed 259689 .00 1.00 .0861 .28058<br />
Retired 259689 .00 1.00 .1392 .34612<br />
Housewife 259689 .00 1.00 .1438 .35087<br />
Student 259689 .00 1.00 .0693 .25388<br />
Other occupation 259689 .00 1.00 .0172 .12988<br />
Unemployed 259689 .00 1.00 .0794 .27032<br />
Size of locality 181216 1.00 9.00 4.8880 2.51581<br />
Average income (macro, PPP) 185668 .95 33.44 11.4858 7.83303<br />
Household income 228938 1.00 11.00 4.6795 2.47724<br />
Green<strong>Pro</strong>ducts 57770 .00 1.00 .4735 .49930<br />
Recycling 59294 .00 1.00 .4743 .49934<br />
WaterConservation 64870 .00 1.00 .5097 .49991<br />
EnvPriority 109033 .00 1.00 .5409 .49833<br />
WTP20 65447 .00 1.00 .4816 .49967<br />
Materialism 185550 .00 1.00 .6081 .48818
Table B3: Correlations among major variables<br />
Correlation<br />
Life Household<br />
matrix<br />
Life<br />
Satisfaction<br />
Household<br />
income<br />
satisfaction<br />
1<br />
(n=263,097)<br />
0.203<br />
(n=224,968)<br />
Green<strong>Pro</strong>ducts 0.206<br />
Recycling<br />
Water<br />
Conservation<br />
EnvPriority<br />
WTP20<br />
(n=56,171)<br />
0.193<br />
(n=57,648)<br />
0.087<br />
(n=63,087)<br />
0.074<br />
(n=106.465)<br />
0.119<br />
(n=63.739)<br />
income<br />
1<br />
(n=228,938)<br />
0.178<br />
(n=49,762)<br />
0.160<br />
(n=50,931)<br />
0.041<br />
(n=55,796)<br />
0.054<br />
(n=96,024)<br />
0.068<br />
(n=56,513)<br />
Note: All correlations are significant at the 1-percent level.<br />
Green<strong>Pro</strong>ducts Recycling Water<br />
1<br />
(n=57.770)<br />
0.478<br />
(n=55,444)<br />
0.247<br />
(n=56,754)<br />
0.127<br />
(n=48,642)<br />
0.120<br />
(n=54,479)<br />
1<br />
(n=59,294)<br />
0.277<br />
(n=58,295)<br />
0.116<br />
(n=49,872)<br />
0.108<br />
(n=55,835)<br />
Conservation<br />
1<br />
(n=64,870)<br />
0.093<br />
(n=54,285)<br />
0.100<br />
(n=60,602)<br />
EnvPriority WTP20<br />
1<br />
(n=109,033)<br />
0.217<br />
(n=55,708)<br />
1<br />
(n=65,447)
Table B4: Distribution of life satisfaction in various sub-samples<br />
Total sample Sub-samples in which environment-related variables are available<br />
WaterConservatio<br />
Life Green<strong>Pro</strong>ducts Recycling<br />
n EnvPriority WTP20 All 5<br />
Satisfacti Frequen Perce Frequen Perce Frequen Perce Frequen<br />
Frequen<br />
Frequen<br />
Frequen<br />
on cy nt cy nt cy nt cy Percent cy Percent cy Percent cy Percent<br />
1 12101 4.60 1730 5.66 1749 5.75 1847 5.78 2155 5.01 1689 5.47 1197 5.14<br />
2 8301 3.16 1162 3.80 1140 3.75 1255 3.93 1368 3.18 1161 3.76 766 3.29<br />
3 14009 5.32 2146 7.02 2090 6.87 2309 7.22 2845 6.61 2174 7.04 1477 6.34<br />
4 15179 5.77 2315 7.57 2273 7.47 2488 7.78 2935 6.82 2344 7.59 1581 6.79<br />
5 36712 13.95 4579 14.97 4509 14.83 4801 15.02 6682 15.53 4611 14.93 3373 14.48<br />
6 26892 10.22 3122 10.21 3104 10.21 3259 10.19 4291 9.97 3167 10.25 2337 10.03<br />
7 36194 13.76 3915 12.80 3890 12.79 4078 12.76 5842 13.58 3987 12.91 3044 13.07<br />
8 48519 18.44 4981 16.28 4954 16.29 5128 16.04 7017 16.31 5039 16.32 4010 17.22<br />
9 29205 11.10 3023 9.88 3047 10.02 3105 9.71 4240 9.85 3052 9.88 2494 10.71<br />
10 35985 13.68 3614 11.82 3658 12.03 3698 11.57 5649 13.13 3660 11.85 3012 12.93<br />
Total 263097 100.00 30587 100.00 30414 100.00 31968 100.00 43024 100.00 30884 100.00 23291 100.00<br />
Mean 6.62 6.28 6.29 6.23 6.42 6.29 6.45
Wirtschaftskulturelle Einflussfaktoren für das Aufbrechen von Routinen der Sozialen Praxis 35<br />
Table B5: Estimated life satisfaction equations. Attitudes not Included. Complete results.<br />
A B C D<br />
Threshold (LS = 1) 0.756 0.798 0.786 0.773<br />
Threshold (LS = 2) 1.061 1.103 1.096 1.080<br />
Threshold (LS = 3) 1.453 1.497 1.493 1.470<br />
Threshold (LS = 4) 1.773 1.821 1.820 1.788<br />
Threshold (LS = 5) 2.292 2.342 2.337 2.308<br />
Threshold (LS = 6) 2.611 2.662 2.655 2.628<br />
Threshold (LS = 7) 3.006 3.057 3.051 3.025<br />
Threshold (LS = 8) 3.567 3.616 3.612 3.590<br />
Threshold (LS = 9) 4.021 4.069 4.065 4.047<br />
Health 0.273<br />
0.278 0.276 0.273<br />
(37.31) (38.47) (38.60) (36.64)<br />
Male<br />
Reference Group<br />
Female 0.047<br />
(3.57)<br />
Age -0.030<br />
(-11.44)<br />
Age 2 0.000359<br />
(12.63)<br />
Single<br />
Married 0.193<br />
(8.67)<br />
Living together 0.050<br />
(1.51)<br />
Divorced -0.069<br />
(-1.94)<br />
Separated -0.164<br />
(-3.39)<br />
Widowed -0.010<br />
(-0.31)<br />
Size household 0.010<br />
(2.27)<br />
No education<br />
Elementary education 0.111<br />
(4.37)<br />
Incomplete secondary<br />
0.138<br />
education<br />
(4.65)<br />
Secondary education 0.149<br />
(5.64)<br />
Intermediate general<br />
0.120<br />
education<br />
(4.13)<br />
Maturity level certificate 0.188<br />
education<br />
(6.88)<br />
Some university education 0.122<br />
(3.82)<br />
0.052 0.052<br />
(3.99) (3.99)<br />
-0.031 -0.030<br />
(-11.81) (-11.80)<br />
0.00365 0.000358<br />
(13.02) (12.91)<br />
Reference Group<br />
0.187 0.178<br />
(8.52) (8.18)<br />
0.047 0.039<br />
(1.42) (1.19)<br />
-0.067 -0.078<br />
(-1.91) (-2.25)<br />
-0.175 -0.185<br />
(-3.68) (-3.91)<br />
-0.017 -0.019<br />
(-0.51) (-0.60)<br />
0.012 0.012<br />
(2.64) (2.73)<br />
Reference Group<br />
0.108<br />
(4.32)<br />
0.132<br />
(4.52)<br />
0.174<br />
(6.83)<br />
0.121<br />
(4.23)<br />
0.194<br />
(7.19)<br />
0.128<br />
(4.07)<br />
0.101<br />
(4.11)<br />
0.133<br />
(4.63)<br />
0.167<br />
(6.64)<br />
0.114<br />
(4.01)<br />
0.182<br />
(6.83)<br />
0.127<br />
(4.07)<br />
0.042<br />
(3.10)<br />
-0.031<br />
(-11.67)<br />
0.000369<br />
(12.74)<br />
0.189<br />
(8.36)<br />
0.051<br />
(1.51)<br />
-0.066<br />
(-1.85)<br />
-0.178<br />
(-3.63)<br />
-0.015<br />
(-0.44)<br />
0.012<br />
(2.48)<br />
0.097<br />
(3.74)<br />
0.126<br />
(4.18)<br />
0.149<br />
(5.64)<br />
0.108<br />
(3.64)<br />
0.167<br />
(5.97)<br />
0.104<br />
(3.18)
Wirtschaftskulturelle Einflussfaktoren für das Aufbrechen von Routinen der Sozialen Praxis 36<br />
University education 0.209<br />
0.227 0.219 0.187<br />
(7.42) (8.19) (8.00) (6.50)<br />
A B C D<br />
Full time employed<br />
Reference Group<br />
Part time employed -0.030 -0.029 -0.039 -0.037<br />
(-1.30) (-1.25) (-1.68) (-1.55)<br />
Self employed 0.010<br />
0.010 0.012 0.007<br />
(0.43) (0.42) (0.50) (0.30)<br />
Retired 0.090<br />
0.085 0.086 0.095<br />
(3.53) (3.37) (3.48) (3.66)<br />
Housewife 0.058<br />
0.060 0.056 0.064<br />
(2.50) (2.63) (2.46) (2.69)<br />
Student 0.076<br />
0.079 0.070 0.081<br />
(2.58) (2.69) (2.41) (2.70)<br />
Other occupation 0.095<br />
0.102 0.078 0.098<br />
(2.13) (2.35) (1.82) (2.15)<br />
Unemployed -0.172 -0.174 -0.181 -0.169<br />
(-7.25) (-7.43) (-7.79) (-6.99)<br />
Size of locality 0.003<br />
0.002 0.002 0.001<br />
(0.99) (0.82) (0.75) (0.31)<br />
Average income (macro, 0.020<br />
0.020 0.023 0.021<br />
PPP)<br />
(6.45) (6.77) (7.62) (6.85)<br />
Household income 0.067<br />
0.066 0.068 0.066<br />
(23.12) (23.39) (23.93) (22.50)<br />
Green products 0.116<br />
0.082<br />
(8.76)<br />
(5.55)<br />
Recycling<br />
0.102<br />
0.049<br />
(7.74)<br />
(3.25)<br />
Water conservation 0.105 0.074<br />
(8.43) (5.38)<br />
QSoc<br />
0.017<br />
0.017 0.016 0.016<br />
(8.58) (8.77) (8.60) (8.30)<br />
Country Dummies Yes Yes Yes Yes<br />
Year dummies Yes Yes Yes Yes<br />
Attitudes No No No No<br />
Pseudo R 2 0.270 0.276 0.275 0.274<br />
Observations 29588 30414 30904 28465<br />
Dependent variable: life satisfaction. method: ordered probit. Cluster-robust z-statistics in<br />
parentheses.
Wirtschaftskulturelle Einflussfaktoren für das Aufbrechen von Routinen der Sozialen Praxis 37<br />
Table B6: Estimated life satisfaction equations. Attitudes Included. Complete results.<br />
A B C D<br />
Threshold (LS = 1) 0.508 0.545 0.534 0.523<br />
Threshold (LS = 2) 0.798 0.834 0.826 0.813<br />
Threshold (LS = 3) 1.186 1.227 1.220 1.201<br />
Threshold (LS = 4) 1.500 1.540 1.536 1.512<br />
Threshold (LS = 5) 2.023 2.062 2.055 2.035<br />
Threshold (LS = 6) 2.338 2.381 2.374 2.351<br />
Threshold (LS = 7) 2.735 2.777 2.769 2.748<br />
Threshold (LS = 8) 3.301 3.342 3.334 3.317<br />
Threshold (LS = 9) 3.758 3.798 3.790 3.777<br />
Health 0.258<br />
0.262 0.258 0.258<br />
(31.78) (32.61) (32.45) (31.29)<br />
Male<br />
Reference Group<br />
Female 0.054<br />
(3.68)<br />
Age -0.032<br />
(-10.79)<br />
Age 2 0.000384<br />
(11.83)<br />
Single<br />
Married 0.217<br />
(8.84)<br />
Living together 0.099<br />
(2.70)<br />
Divorced -0.051<br />
(-1.32)<br />
Separated -0.175<br />
(-3.28)<br />
Widowed 0.000<br />
(0.00)<br />
Size household 0.006<br />
(1.09)<br />
No education<br />
Elementary education 0.089<br />
(3.03)<br />
Incomplete secondary<br />
0.119<br />
education<br />
(3.54)<br />
Secondary education 0.119<br />
(4.05)<br />
Intermediate general<br />
0.087<br />
education<br />
(2.65)<br />
Maturity level certificate 0.157<br />
education<br />
(5.04)<br />
Some university education 0.086<br />
(2.42)<br />
0.058 0.058<br />
(3.99) (4.04)<br />
-0.032 -0.032<br />
(-11.03) (-10.95)<br />
0.00387 0.000379<br />
(12.08) (11.92)<br />
Reference Group<br />
0.218 0.203<br />
(3.99) (8.42)<br />
0.103 0.093<br />
(2.82) (2.56)<br />
-0.041 -0.057<br />
(-1.07) (-1.48)<br />
-0.187 -0.203<br />
(-3.55) (-3.85)<br />
0.011 -0.003<br />
(0.30) (-0.09)<br />
0.005 0.006<br />
(1.05) (1.23)<br />
Reference Group<br />
0.094<br />
(3.24)<br />
0.106<br />
(3.22)<br />
0.126<br />
(4.34)<br />
0.094<br />
(2.91)<br />
0.166<br />
(5.39)<br />
0.091<br />
(2.58)<br />
0.090<br />
(3.13)<br />
0.117<br />
(3.56)<br />
0.126<br />
(4.37)<br />
0.089<br />
(2.77)<br />
0.159<br />
(5.23)<br />
0.093<br />
(2.65)<br />
0.048<br />
(3.22)<br />
-0.033<br />
(-10.89)<br />
0.000390<br />
(11.85)<br />
0.218<br />
(8.75)<br />
0.103<br />
(2.77)<br />
-0.037<br />
(-0.94)<br />
-0.186<br />
(-3.43)<br />
0.009<br />
(0.24)<br />
0.005<br />
(0.99)<br />
0.085<br />
(2.84)<br />
0.112<br />
(3.28)<br />
0.109<br />
(3.65)<br />
0.082<br />
(2.46)<br />
0.142<br />
(4.51)<br />
0.073<br />
(2.01)
Wirtschaftskulturelle Einflussfaktoren für das Aufbrechen von Routinen der Sozialen Praxis 38<br />
University education 0.161<br />
0.178 0.175 0.148<br />
(5.06)<br />
(5.66) (5.63) (4.56)<br />
A B C D<br />
Full time employed<br />
Reference Group<br />
Part time employed -0.052<br />
-0.050 -0.061 -0.055<br />
(-2.01) (-1.95) (-2.38) (-2.08)<br />
Self employed -0.019<br />
-0.014 -0.015 -0.022<br />
(-0.72) (-0.54) (-0.58) (-0.83)<br />
Retired 0.076<br />
0.070 0.075 0.080<br />
(2.66)<br />
(2.46) (2.66) (2.74)<br />
Housewife 0.051<br />
0.055 0.050 0.056<br />
(1.96)<br />
(2.15) (1.97) (2.15)<br />
Student 0.068<br />
0.071 0.055 0.073<br />
(2.11)<br />
(2.23) (1.75) (2.24)<br />
Other occupation 0.113<br />
0.112 0.100 0.116<br />
(2.29)<br />
(2.30) (2.08) (2.29)<br />
Unemployed -0.190<br />
-0.189 -0.197 -0.187<br />
(-7.26) (-7.27) (-7.63) (-7.03)<br />
Size of locality -0.001<br />
-0.001 -0.001 -0.003<br />
(-0.49) (-0.43) (-0.50) (-0.93)<br />
Average income (macro, 0.019<br />
0.020 0.021 0.020<br />
PPP)<br />
(5.82)<br />
(6.12) (6.64) (6.01)<br />
Household income 0.063<br />
0.062 0.063 0.062<br />
(19.69) (19.66) (20.16) (19.16)<br />
Green products 0.085<br />
0.060<br />
(5.80)<br />
(3.75)<br />
Recycling<br />
0.085<br />
0.047<br />
(5.70)<br />
(2.86)<br />
Water conservation 0.069 0.044<br />
(4.96) (2.92)<br />
QSoc<br />
0.015<br />
0.015 0.015 0.014<br />
(7.02)<br />
(7.09) (7.12) (6.88)<br />
WTP20 0.133<br />
0.130 0.134 0.127<br />
(9.54)<br />
(9.38) (9.77) (8.89)<br />
EnvPriority 0.088<br />
0.086 0.088 0.084<br />
(6.27)<br />
(6.16) (6.36) (5.82)<br />
Country Dummies Yes Yes Yes Yes<br />
Year dummies Yes Yes Yes Yes<br />
Pseudo R 2 0.259 0.262 0.261 0.261<br />
Observations 24069 24593 24944 23291<br />
Dependent variable: life satisfaction. method: ordered probit. Cluster-robust z-statistics in<br />
parentheses.