Two crossover regions in the dynamics of glass forming ... - Fisica
Two crossover regions in the dynamics of glass forming ... - Fisica
Two crossover regions in the dynamics of glass forming ... - Fisica

Create successful ePaper yourself
Turn your PDF publications into a flip-book with our unique Google optimized e-Paper software.
2446 J. Chem. Phys., Vol. 117, No. 5, 1 August 2002 Corezzi et al.<br />
should properly call <strong>the</strong> dielectric onset observed <strong>in</strong> <strong>the</strong><br />
-<strong>crossover</strong> region <strong>the</strong> (a,) onset. However, <strong>the</strong> <strong>in</strong>tensity<br />
onset and frequency gap <strong>in</strong> <strong>the</strong> -<strong>crossover</strong> region <strong>in</strong>dicate<br />
that <strong>the</strong>re is, <strong>in</strong> PPGE, a qualitative difference between <strong>the</strong><br />
a process and <strong>the</strong> high-temperature a process, i.e., below<br />
and above <strong>the</strong> <strong>crossover</strong>. In particular, <strong>the</strong> presence <strong>of</strong> a<br />
frequency gap between <strong>the</strong> extrapolated a and a processes<br />
at <strong>the</strong> <strong>crossover</strong> could be <strong>in</strong>terpreted, follow<strong>in</strong>g general<br />
scal<strong>in</strong>g pr<strong>in</strong>ciples, as an <strong>in</strong>dication <strong>of</strong> a length scale for <strong>the</strong><br />
a mode that is larger than that <strong>of</strong> <strong>the</strong> a modes emerg<strong>in</strong>g<br />
from <strong>the</strong> process.<br />
E. Comparison between PPGE and DGEBA<br />
The overall behavior <strong>of</strong> both epoxy res<strong>in</strong>s is <strong>the</strong> same<br />
Figs. 6, 7, 9, and 10: We f<strong>in</strong>d two <strong>crossover</strong> <strong>regions</strong> separated<br />
by a frequency difference <strong>of</strong> about four decades. The <br />
<strong>crossover</strong> seems to conform to scenario I onset, <strong>the</strong> <br />
<strong>crossover</strong> belongs to scenario II. The characteristic temperatures<br />
<strong>of</strong> <strong>crossover</strong> effects <strong>in</strong> DGEBA are compiled <strong>in</strong> Table II<br />
toge<strong>the</strong>r with those for PPGE. Unlike PPGE, <strong>in</strong> DGEBA<br />
low-temperature conductivity data for assess<strong>in</strong>g <strong>the</strong> presence<br />
<strong>of</strong> a - bend <strong>in</strong>dicat<strong>in</strong>g <strong>the</strong> start <strong>of</strong> different temperature<br />
dependences for <strong>the</strong> different transport activities are not<br />
available, and <strong>the</strong> weak bend <strong>of</strong> <strong>the</strong> dielectric -process <strong>in</strong>tensity<br />
(T) at <strong>the</strong> -<strong>crossover</strong> temperature is hardly perceived.<br />
From Fig. 10, <strong>the</strong> cooperativity <strong>of</strong> <strong>the</strong> process,<br />
extrapolated to <strong>the</strong> -<strong>crossover</strong> temperature, is about N 5 for DGEBA, i.e., a bit larger than that for PPGE. The<br />
1/2 (1)<br />
extrapolation <strong>of</strong> N gives N1 at Ton 291 K for <strong>the</strong><br />
(1)<br />
l<strong>in</strong>ear fit, and Ton 306 K for <strong>the</strong> best adjustment <strong>of</strong> Eq. 4<br />
c<br />
with T0209 K A5.5 and Ton325 K. The cooperativity<br />
N at <strong>the</strong> <strong>glass</strong> transition temperature, <strong>in</strong>dependently determ<strong>in</strong>ed<br />
from DSC measurements is N(T g)7520 for<br />
PPGE and N(T g)11030 for DGEBA. 66 These values<br />
are consistent with<strong>in</strong> <strong>the</strong> experimental errors with those extrapolated<br />
accord<strong>in</strong>g to Eq. 4, and give comparable values<br />
for <strong>the</strong> cooperativity length at <strong>the</strong> <strong>glass</strong> transition temperature<br />
for both PPGE and DGEBA (T g)3.30.3 and<br />
3.80.4 nm, respectively.<br />
As recalled <strong>in</strong> Sec. III, <strong>the</strong> determ<strong>in</strong>ation <strong>of</strong> T0 as <strong>the</strong><br />
temperature where <strong>the</strong> trace tends to diverge is not unambiguous<br />
<strong>in</strong> fact, it ranges from <strong>the</strong> values reported <strong>in</strong> Table<br />
III to values more than 10 K lower. It is worth not<strong>in</strong>g that<br />
despite this large uncerta<strong>in</strong>ty <strong>the</strong> best adjustments <strong>of</strong> Eq. 4<br />
with different values <strong>of</strong> T0 do not entail changes <strong>in</strong> <strong>the</strong> ex-<br />
(1)<br />
trapolated values <strong>of</strong> Ton and N(T g) that are significant<br />
with<strong>in</strong> <strong>the</strong> experimental errors.<br />
Note that <strong>the</strong> frequency–temperature position <strong>of</strong> and <br />
relaxations <strong>in</strong> PPGE and DGEBA are nearly identical Table<br />
III. This <strong>in</strong>dicates that <strong>the</strong> molecular mechanism <strong>of</strong> <strong>the</strong> secondary<br />
relaxations <strong>in</strong> both substances is similar. This aspect<br />
and <strong>the</strong> fact that <strong>the</strong>re are two pronounced secondary processes<br />
<strong>in</strong> cross-l<strong>in</strong>ked DGEBA systems 67,68 may be <strong>the</strong> start<strong>in</strong>g<br />
po<strong>in</strong>t <strong>of</strong> fur<strong>the</strong>r studies on this topic.<br />
F. Comparison with o<strong>the</strong>r substances<br />
There are several substances with two secondary relaxations<br />
<strong>in</strong>vestigated <strong>in</strong> <strong>the</strong> literature. 69–75 However, only <strong>in</strong> a<br />
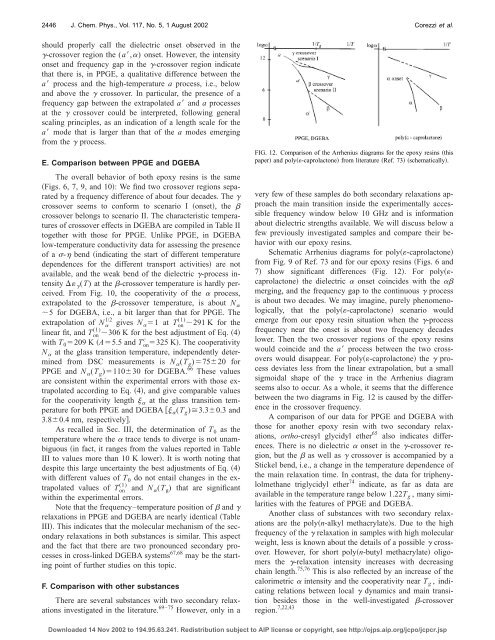
FIG. 12. Comparison <strong>of</strong> <strong>the</strong> Arrhenius diagrams for <strong>the</strong> epoxy res<strong>in</strong>s this<br />
paper and poly-caprolactone from literature Ref. 73 schematically.<br />
very few <strong>of</strong> <strong>the</strong>se samples do both secondary relaxations approach<br />
<strong>the</strong> ma<strong>in</strong> transition <strong>in</strong>side <strong>the</strong> experimentally accessible<br />
frequency w<strong>in</strong>dow below 10 GHz and is <strong>in</strong>formation<br />
about dielectric strengths available. We will discuss below a<br />
few previously <strong>in</strong>vestigated samples and compare <strong>the</strong>ir behavior<br />
with our epoxy res<strong>in</strong>s.<br />
Schematic Arrhenius diagrams for poly-caprolactone<br />
from Fig. 9 <strong>of</strong> Ref. 73 and for our epoxy res<strong>in</strong>s Figs. 6 and<br />
7 show significant differences Fig. 12. For polycaprolactone<br />
<strong>the</strong> dielectric onset co<strong>in</strong>cides with <strong>the</strong> <br />
merg<strong>in</strong>g, and <strong>the</strong> frequency gap to <strong>the</strong> cont<strong>in</strong>uous process<br />
is about two decades. We may imag<strong>in</strong>e, purely phenomenologically,<br />
that <strong>the</strong> poly-caprolactone scenario would<br />
emerge from our epoxy res<strong>in</strong> situation when <strong>the</strong> -process<br />
frequency near <strong>the</strong> onset is about two frequency decades<br />
lower. Then <strong>the</strong> two <strong>crossover</strong> <strong>regions</strong> <strong>of</strong> <strong>the</strong> epoxy res<strong>in</strong>s<br />
would co<strong>in</strong>cide and <strong>the</strong> a process between <strong>the</strong> two <strong>crossover</strong>s<br />
would disappear. For poly-caprolactone <strong>the</strong> process<br />
deviates less from <strong>the</strong> l<strong>in</strong>ear extrapolation, but a small<br />
sigmoidal shape <strong>of</strong> <strong>the</strong> trace <strong>in</strong> <strong>the</strong> Arrhenius diagram<br />
seems also to occur. As a whole, it seems that <strong>the</strong> difference<br />
between <strong>the</strong> two diagrams <strong>in</strong> Fig. 12 is caused by <strong>the</strong> difference<br />
<strong>in</strong> <strong>the</strong> <strong>crossover</strong> frequency.<br />
A comparison <strong>of</strong> our data for PPGE and DGEBA with<br />
those for ano<strong>the</strong>r epoxy res<strong>in</strong> with two secondary relaxations,<br />
ortho-cresyl glycidyl e<strong>the</strong>r 65 also <strong>in</strong>dicates differences.<br />
There is no dielectric onset <strong>in</strong> <strong>the</strong> -<strong>crossover</strong> region,<br />
but <strong>the</strong> as well as <strong>crossover</strong> is accompanied by a<br />
Stickel bend, i.e., a change <strong>in</strong> <strong>the</strong> temperature dependence <strong>of</strong><br />
<strong>the</strong> ma<strong>in</strong> relaxation time. In contrast, <strong>the</strong> data for triphenylolmethane<br />
triglycidyl e<strong>the</strong>r 74 <strong>in</strong>dicate, as far as data are<br />
available <strong>in</strong> <strong>the</strong> temperature range below 1.22T g , many similarities<br />
with <strong>the</strong> features <strong>of</strong> PPGE and DGEBA.<br />
Ano<strong>the</strong>r class <strong>of</strong> substances with two secondary relaxations<br />
are <strong>the</strong> polyn-alkyl methacrylates. Due to <strong>the</strong> high<br />
frequency <strong>of</strong> <strong>the</strong> relaxation <strong>in</strong> samples with high molecular<br />
weight, less is known about <strong>the</strong> details <strong>of</strong> a possible <strong>crossover</strong>.<br />
However, for short polyn-butyl methacrylate oligomers<br />
<strong>the</strong> -relaxation <strong>in</strong>tensity <strong>in</strong>creases with decreas<strong>in</strong>g<br />
cha<strong>in</strong> length. 75,76 This is also reflected by an <strong>in</strong>crease <strong>of</strong> <strong>the</strong><br />
calorimetric <strong>in</strong>tensity and <strong>the</strong> cooperativity near T g , <strong>in</strong>dicat<strong>in</strong>g<br />
relations between local <strong>dynamics</strong> and ma<strong>in</strong> transition<br />
besides those <strong>in</strong> <strong>the</strong> well-<strong>in</strong>vestigated -<strong>crossover</strong><br />
region. 7,22,43<br />
Downloaded 14 Nov 2002 to 194.95.63.241. Redistribution subject to AIP license or copyright, see http://ojps.aip.org/jcpo/jcpcr.jsp