Two crossover regions in the dynamics of glass forming ... - Fisica
Two crossover regions in the dynamics of glass forming ... - Fisica
Two crossover regions in the dynamics of glass forming ... - Fisica

You also want an ePaper? Increase the reach of your titles
YUMPU automatically turns print PDFs into web optimized ePapers that Google loves.
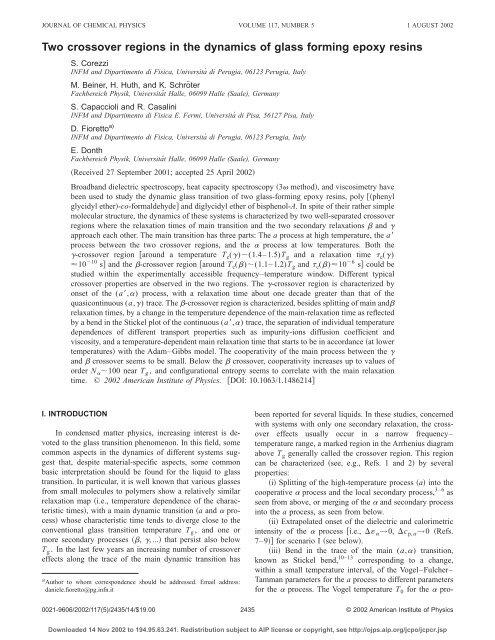
JOURNAL OF CHEMICAL PHYSICS VOLUME 117, NUMBER 5 1 AUGUST 2002<br />
<strong>Two</strong> <strong>crossover</strong> <strong>regions</strong> <strong>in</strong> <strong>the</strong> <strong>dynamics</strong> <strong>of</strong> <strong>glass</strong> form<strong>in</strong>g epoxy res<strong>in</strong>s<br />
S. Corezzi<br />
INFM and Dipartimento di <strong>Fisica</strong>, Università di Perugia, 06123 Perugia, Italy<br />
M. Be<strong>in</strong>er, H. Huth, and K. Schröter<br />
Fachbereich Physik, Universität Halle, 06099 Halle (Saale), Germany<br />
S. Capaccioli and R. Casal<strong>in</strong>i<br />
INFM and Dipartimento di <strong>Fisica</strong> E. Fermi, Università di Pisa, 56127 Pisa, Italy<br />
D. Fioretto a)<br />
INFM and Dipartimento di <strong>Fisica</strong>, Università di Perugia, 06123 Perugia, Italy<br />
E. Donth<br />
Fachbereich Physik, Universität Halle, 06099 Halle (Saale), Germany<br />
Received 27 September 2001; accepted 25 April 2002<br />
Broadband dielectric spectroscopy, heat capacity spectroscopy 3 method, and viscosimetry have<br />
been used to study <strong>the</strong> dynamic <strong>glass</strong> transition <strong>of</strong> two <strong>glass</strong>-form<strong>in</strong>g epoxy res<strong>in</strong>s, poly phenyl<br />
glycidyl e<strong>the</strong>r-co-formaldehyde and diglycidyl e<strong>the</strong>r <strong>of</strong> bisphenol-A. In spite <strong>of</strong> <strong>the</strong>ir ra<strong>the</strong>r simple<br />
molecular structure, <strong>the</strong> <strong>dynamics</strong> <strong>of</strong> <strong>the</strong>se systems is characterized by two well-separated <strong>crossover</strong><br />
<strong>regions</strong> where <strong>the</strong> relaxation times <strong>of</strong> ma<strong>in</strong> transition and <strong>the</strong> two secondary relaxations and <br />
approach each o<strong>the</strong>r. The ma<strong>in</strong> transition has three parts: The a process at high temperature, <strong>the</strong> a<br />
process between <strong>the</strong> two <strong>crossover</strong> <strong>regions</strong>, and <strong>the</strong> process at low temperatures. Both <strong>the</strong><br />
-<strong>crossover</strong> region around a temperature T c()(1.4– 1.5)T g and a relaxation time c()<br />
10 10 s and <strong>the</strong> -<strong>crossover</strong> region around T c()(1.1– 1.2)T g and c()10 6 s could be<br />
studied with<strong>in</strong> <strong>the</strong> experimentally accessible frequency–temperature w<strong>in</strong>dow. Different typical<br />
<strong>crossover</strong> properties are observed <strong>in</strong> <strong>the</strong> two <strong>regions</strong>. The -<strong>crossover</strong> region is characterized by<br />
onset <strong>of</strong> <strong>the</strong> (a,) process, with a relaxation time about one decade greater than that <strong>of</strong> <strong>the</strong><br />
quasicont<strong>in</strong>uous (a,) trace. The -<strong>crossover</strong> region is characterized, besides splitt<strong>in</strong>g <strong>of</strong> ma<strong>in</strong> and<br />
relaxation times, by a change <strong>in</strong> <strong>the</strong> temperature dependence <strong>of</strong> <strong>the</strong> ma<strong>in</strong>-relaxation time as reflected<br />
by a bend <strong>in</strong> <strong>the</strong> Stickel plot <strong>of</strong> <strong>the</strong> cont<strong>in</strong>uous (a,) trace, <strong>the</strong> separation <strong>of</strong> <strong>in</strong>dividual temperature<br />
dependences <strong>of</strong> different transport properties such as impurity-ions diffusion coefficient and<br />
viscosity, and a temperature-dependent ma<strong>in</strong> relaxation time that starts to be <strong>in</strong> accordance at lower<br />
temperatures with <strong>the</strong> Adam–Gibbs model. The cooperativity <strong>of</strong> <strong>the</strong> ma<strong>in</strong> process between <strong>the</strong> <br />
and <strong>crossover</strong> seems to be small. Below <strong>the</strong> <strong>crossover</strong>, cooperativity <strong>in</strong>creases up to values <strong>of</strong><br />
order N 100 near T g , and configurational entropy seems to correlate with <strong>the</strong> ma<strong>in</strong> relaxation<br />
time. © 2002 American Institute <strong>of</strong> Physics. DOI: 10.1063/1.1486214<br />
I. INTRODUCTION<br />
In condensed matter physics, <strong>in</strong>creas<strong>in</strong>g <strong>in</strong>terest is devoted<br />
to <strong>the</strong> <strong>glass</strong> transition phenomenon. In this field, some<br />
common aspects <strong>in</strong> <strong>the</strong> <strong>dynamics</strong> <strong>of</strong> different systems suggest<br />
that, despite material-specific aspects, some common<br />
basic <strong>in</strong>terpretation should be found for <strong>the</strong> liquid to <strong>glass</strong><br />
transition. In particular, it is well known that various <strong>glass</strong>es<br />
from small molecules to polymers show a relatively similar<br />
relaxation map i.e., temperature dependence <strong>of</strong> <strong>the</strong> characteristic<br />
times, with a ma<strong>in</strong> dynamic transition a and process<br />
whose characteristic time tends to diverge close to <strong>the</strong><br />
conventional <strong>glass</strong> transition temperature T g , and one or<br />
more secondary processes , , ... that persist also below<br />
T g . In <strong>the</strong> last few years an <strong>in</strong>creas<strong>in</strong>g number <strong>of</strong> <strong>crossover</strong><br />
effects along <strong>the</strong> trace <strong>of</strong> <strong>the</strong> ma<strong>in</strong> dynamic transition has<br />
a<br />
Author to whom correspondence should be addressed. Email address:<br />
daniele.fioretto@pg.<strong>in</strong>fn.it<br />
been reported for several liquids. In <strong>the</strong>se studies, concerned<br />
with systems with only one secondary relaxation, <strong>the</strong> <strong>crossover</strong><br />
effects usually occur <strong>in</strong> a narrow frequency–<br />
temperature range, a marked region <strong>in</strong> <strong>the</strong> Arrhenius diagram<br />
above T g generally called <strong>the</strong> <strong>crossover</strong> region. This region<br />
can be characterized see, e.g., Refs. 1 and 2 by several<br />
properties:<br />
i Splitt<strong>in</strong>g <strong>of</strong> <strong>the</strong> high-temperature process a <strong>in</strong>to <strong>the</strong><br />
cooperative process and <strong>the</strong> local secondary process, 3–6 as<br />
seen from above, or merg<strong>in</strong>g <strong>of</strong> <strong>the</strong> and secondary process<br />
<strong>in</strong>to <strong>the</strong> a process, as seen from below.<br />
ii Extrapolated onset <strong>of</strong> <strong>the</strong> dielectric and calorimetric<br />
<strong>in</strong>tensity <strong>of</strong> <strong>the</strong> process i.e., →0, c p,→0 Refs.<br />
7–9 for scenario I see below.<br />
iii Bend <strong>in</strong> <strong>the</strong> trace <strong>of</strong> <strong>the</strong> ma<strong>in</strong> (a,) transition,<br />
known as Stickel bend, 10–13 correspond<strong>in</strong>g to a change,<br />
with<strong>in</strong> a small temperature <strong>in</strong>terval, <strong>of</strong> <strong>the</strong> Vogel–Fulcher–<br />
Tamman parameters for <strong>the</strong> a process to different parameters<br />
for <strong>the</strong> process. The Vogel temperature T 0 for <strong>the</strong> pro-<br />
0021-9606/2002/117(5)/2435/14/$19.00 2435<br />
© 2002 American Institute <strong>of</strong> Physics<br />
Downloaded 14 Nov 2002 to 194.95.63.241. Redistribution subject to AIP license or copyright, see http://ojps.aip.org/jcpo/jcpcr.jsp
2436 J. Chem. Phys., Vol. 117, No. 5, 1 August 2002 Corezzi et al.<br />
cess is, as a rule scenario II, see below, smaller than <strong>the</strong><br />
Vogel temperature for <strong>the</strong> a process, i.e., T 0()T 0(a).<br />
iv Separation <strong>of</strong> <strong>the</strong> <strong>in</strong>dividual temperature dependences<br />
<strong>of</strong> different transport properties such as self-diffusion<br />
and viscosity. 14–16 This is connected with <strong>the</strong> breakdown<br />
<strong>of</strong> <strong>the</strong> Stokes–E<strong>in</strong>ste<strong>in</strong> law <strong>of</strong> diffusion. 17<br />
v The plot <strong>of</strong> <strong>the</strong> logarithm <strong>of</strong> <strong>the</strong> characteristic time<br />
for <strong>the</strong> ma<strong>in</strong> transition versus <strong>the</strong> reciprocal configurational<br />
entropy more precisely, versus 1/TS c, <strong>in</strong>spired by <strong>the</strong><br />
Adam–Gibbs relation, 18 shows a bend. 19<br />
By proper extrapolations, characteristic <strong>crossover</strong> temperatures<br />
for <strong>the</strong> above-mentioned effects are found to range<br />
with<strong>in</strong> a temperature <strong>in</strong>terval <strong>of</strong> about 10 K. 1,20 For <strong>the</strong> sake<br />
<strong>of</strong> brevity, we will refer to <strong>the</strong> <strong>crossover</strong> temperature as an<br />
average temperature value <strong>of</strong> <strong>the</strong> <strong>crossover</strong> region. For fragile<br />
<strong>glass</strong>-formers a typical <strong>crossover</strong> temperature T c is about<br />
T c1.2T g . The correspond<strong>in</strong>g relaxation time region <strong>in</strong> <strong>the</strong><br />
Arrhenius diagram is typically around c10 6 s. However,<br />
both values c and T c /T g show a large variance <strong>in</strong> groups<br />
<strong>of</strong> different substances, as discussed <strong>in</strong> Refs. 1 and 21. We<br />
know also a series <strong>of</strong> substances where T c tends systematically<br />
to <strong>the</strong> <strong>glass</strong> transition temperature, T c→T g : <strong>the</strong> polynalkyl<br />
methacrylates, where T g is reached near <strong>the</strong> hexyl<br />
member. 22<br />
As recalled at po<strong>in</strong>t i, <strong>crossover</strong> effects are <strong>of</strong>ten accompanied<br />
by <strong>the</strong> occurrence <strong>of</strong> a splitt<strong>in</strong>g phenomenon, i.e.,<br />
separation <strong>of</strong> <strong>the</strong> relaxation times <strong>of</strong> dynamic <strong>glass</strong> transition<br />
and a secondary relaxation. In a rough, prelim<strong>in</strong>ary classification<br />
we can recognize two scenarios <strong>of</strong> <strong>the</strong> <strong>crossover</strong><br />
region 7,23,24 see also Refs. 25–27 <strong>in</strong> connection with <strong>the</strong><br />
type <strong>of</strong> splitt<strong>in</strong>g region:<br />
Scenario I. Separate onset <strong>of</strong> <strong>the</strong> process about one to<br />
two frequency decades frequency gap below <strong>the</strong> cont<strong>in</strong>uous<br />
trace <strong>of</strong> <strong>the</strong> a and processes. This last trace shows <strong>the</strong>re a<br />
more or less pronounced bend <strong>in</strong> <strong>the</strong> Arrhenius diagram. The<br />
<strong>crossover</strong> region can be def<strong>in</strong>ed by <strong>the</strong> extrapolation to zero<br />
<strong>of</strong> <strong>the</strong> <strong>in</strong>tensity.<br />
Scenario II. A cont<strong>in</strong>uous trace <strong>of</strong> <strong>the</strong> ma<strong>in</strong> (a,) transition<br />
where <strong>the</strong> <strong>crossover</strong> region can be def<strong>in</strong>ed by <strong>the</strong> extrapolation<br />
from low temperatures <strong>of</strong> <strong>the</strong> trace <strong>of</strong> <strong>the</strong> process,<br />
runn<strong>in</strong>g <strong>in</strong>to <strong>the</strong> ma<strong>in</strong> process with a large ‘‘angle’’ <strong>in</strong><br />
<strong>the</strong> Arrhenius diagram and with a usually small relaxation<br />
<strong>in</strong>tensity e.g., ( a , ) near T c.<br />
It was speculated 24 that <strong>the</strong> molecular cage for <strong>the</strong> a<br />
process is larger for scenario II than for scenario I, <strong>in</strong>duc<strong>in</strong>g<br />
for scenario II ‘‘more cont<strong>in</strong>uity’’ between <strong>the</strong> a process and<br />
<strong>the</strong> cooperative process, with <strong>in</strong>creas<strong>in</strong>g size <strong>of</strong> <strong>the</strong> cooperativity<br />
<strong>regions</strong> below <strong>the</strong> <strong>crossover</strong>. 28<br />
The aim <strong>of</strong> <strong>the</strong> present paper is <strong>the</strong> experimental study <strong>of</strong><br />
<strong>the</strong> dynamic <strong>glass</strong> transition <strong>in</strong> two epoxy res<strong>in</strong>s: polyphenyl<br />
glycidyl e<strong>the</strong>r-co-formaldehyde PPGE and diglycidyl<br />
e<strong>the</strong>r <strong>of</strong> bisphenol-A DGEBA. The ma<strong>in</strong> <strong>in</strong>terest for <strong>the</strong>se<br />
systems is that <strong>the</strong>y both show two secondary relaxations<br />
that approach <strong>the</strong> ma<strong>in</strong> transition <strong>in</strong>side <strong>the</strong> experimentally<br />
accessible frequency w<strong>in</strong>dow. Follow<strong>in</strong>g <strong>the</strong> tradition <strong>of</strong><br />
polymer physics, <strong>the</strong> secondary relaxation at lower frequencies<br />
is called <strong>the</strong> process, and that at higher frequency is<br />
called <strong>the</strong> process. We use <strong>the</strong> term <strong>crossover</strong> region to<br />
<strong>in</strong>dicate a temperature–frequency region where changes take<br />
FIG. 1. a Real and b imag<strong>in</strong>ary part <strong>of</strong> <strong>the</strong> complex dielectric constant<br />
*() for PPGE selected data at several temperatures 331.8, 327.9,<br />
323.1, 317.9, 313.0, 308.0, 303.1, 298.3, 293.1, 287.5, 283.9, 278.9, 274.4,<br />
270.1, 266.3, 262.1 K above T g , <strong>in</strong> <strong>the</strong> range 10 2 –310 9 Hz. The solid<br />
l<strong>in</strong>es represent a fit with two HN functions. In <strong>the</strong> <strong>in</strong>set: dielectric loss at<br />
some temperatures 213, 193, 173, 153, 133 K below T g , show<strong>in</strong>g <strong>the</strong> <br />
process and <strong>the</strong> less <strong>in</strong>tense process. The best fit with a symmetrical<br />
Cole–Cole function plus a HN function is shown by solid l<strong>in</strong>es.<br />
place <strong>in</strong> <strong>the</strong> dynamic behavior <strong>of</strong> <strong>the</strong> system. From broadband<br />
dielectric spectroscopy we have <strong>in</strong>dication <strong>of</strong> two wellseparated<br />
<strong>crossover</strong> <strong>regions</strong> <strong>crossover</strong> and <strong>crossover</strong>,<br />
with c()10 6 s and c()10 10 s. We use additionally<br />
viscosity measurements and heat capacity spectroscopy<br />
3 method to study <strong>the</strong> follow<strong>in</strong>g two questions:<br />
A Which property ii–v can be observed <strong>in</strong> <strong>the</strong> two<br />
different <strong>crossover</strong> <strong>regions</strong> <strong>crossover</strong> and <strong>crossover</strong>?<br />
Especially, can <strong>the</strong> two <strong>crossover</strong> <strong>regions</strong> also be classified<br />
with<strong>in</strong> scenario I or scenario II?<br />
B What is <strong>the</strong> character <strong>of</strong> <strong>the</strong> part <strong>of</strong> <strong>the</strong> ma<strong>in</strong> transition<br />
between <strong>the</strong> two <strong>crossover</strong>s? Especially, is it more a<br />
high-temperature process similar to <strong>the</strong> a process, <strong>the</strong>refore<br />
called a, or is it more a cooperative process similar to <strong>the</strong><br />
process, hence <strong>the</strong> name ?<br />
The results for our low-molecular-weight epoxy res<strong>in</strong>s<br />
will be f<strong>in</strong>ally compared with dielectric measurements from<br />
literature on o<strong>the</strong>r substances with two secondary relaxations.<br />
II. EXPERIMENT<br />
A. Samples<br />
The sample <strong>of</strong> DGEBA used <strong>in</strong> this study was purchased<br />
from Shell Co. under <strong>the</strong> trade name <strong>of</strong> Epon 828 average<br />
molecular weight 380 g/mol, correspond<strong>in</strong>g to n0.14 <strong>in</strong><br />
<strong>the</strong> chemical formula reported <strong>in</strong> Fig. 1a. It is a widely<br />
used commercial epoxy res<strong>in</strong>, and was measured as pur-<br />
Downloaded 14 Nov 2002 to 194.95.63.241. Redistribution subject to AIP license or copyright, see http://ojps.aip.org/jcpo/jcpcr.jsp
J. Chem. Phys., Vol. 117, No. 5, 1 August 2002 <strong>Two</strong> <strong>crossover</strong> <strong>regions</strong> <strong>in</strong> <strong>the</strong> <strong>dynamics</strong> <strong>of</strong> epoxy res<strong>in</strong>s<br />
FIG. 2. a Real and b imag<strong>in</strong>ary part <strong>of</strong> *() for DGEBA selected<br />
data at several temperatures 353, 343, 333, 323, 313, 303, 298, 293, 288,<br />
283, 278, 273, 268, 263, 259, 256 K above T g , <strong>in</strong> <strong>the</strong> range 10 2 –2<br />
10 10 Hz. The solid l<strong>in</strong>es represent a fit with two HN functions. In <strong>the</strong><br />
<strong>in</strong>set: dielectric loss at some temperatures 223, 203, 183, 163, 143 K<br />
below T g , show<strong>in</strong>g <strong>the</strong> process at higher frequencies and <strong>the</strong> process at<br />
lower frequencies. The best fit with a symmetrical Cole–Cole function plus<br />
a HN function is shown by solid l<strong>in</strong>es.<br />
chased. PPGE is an epoxy res<strong>in</strong> with average molecular<br />
weight <strong>of</strong> 345 g/mol. It was obta<strong>in</strong>ed from Aldrich Chemicals<br />
and was measured as received. The chemical formula <strong>of</strong><br />
this material is given <strong>in</strong> Fig. 2a. The conventional <strong>glass</strong><br />
transition temperatures are T g2551 K for DGEBA and<br />
T g2581 K for PPGE. The T g values were obta<strong>in</strong>ed by an<br />
equal-area construction from differential scann<strong>in</strong>g calorimetry<br />
DSC curves, acquired by a Perk<strong>in</strong>-Elmer DSC 7 apparatus,<br />
at a heat<strong>in</strong>g rate <strong>of</strong> dT/dt10 K/m<strong>in</strong>.<br />
B. Measurements<br />
1. Dielectric spectroscopy<br />
Due to <strong>the</strong> strong permanent dipoles orig<strong>in</strong>at<strong>in</strong>g from <strong>the</strong><br />
presence <strong>of</strong> epoxy groups 2.1 D per epoxy group, both<br />
DGEBA and PPGE are particularly suitable for a dielectric<br />
<strong>in</strong>vestigation. Measurements <strong>of</strong> <strong>the</strong> dielectric constant<br />
*(,T)i <strong>in</strong> PPGE were carried out by means <strong>of</strong><br />
an Alpha Novocontrol dielectric analyzer Pisa & Ma<strong>in</strong>z<br />
and an impedance analyzer HP4194A Pisa <strong>in</strong> <strong>the</strong> frequency<br />
range from 10 2 to 10 7 Hz. A network analyzer HP8753A<br />
Perugia was used to cover <strong>the</strong> frequency range from 10 7 to<br />
310 9 Hz. Iso<strong>the</strong>rmal frequency scans were performed <strong>in</strong><br />
<strong>the</strong> temperature <strong>in</strong>terval from 357.8 to 133.2 K, dur<strong>in</strong>g several<br />
series <strong>of</strong> measurements.<br />
The dielectric constant <strong>of</strong> DGEBA was measured <strong>in</strong> <strong>the</strong><br />
frequency range from 10 1 to 10 6 Hz by a Novocontrol BDS<br />
4000 based on a Solartron FRA 1260 Halle. The temperature<br />
<strong>in</strong>terval was from 123.2 to 293.2 K, i.e., from far below<br />
to well above <strong>the</strong> <strong>glass</strong> transition temperature, <strong>in</strong> steps <strong>of</strong> 5<br />
degrees. The results are compared with previously published<br />
dielectric data <strong>in</strong> <strong>the</strong> frequency range from 10 2 to 2<br />
10 10 Hz Ref. 8 and data at lower frequencies down to<br />
10 2 Hz Ref. 29. Altoge<strong>the</strong>r we present dielectric results<br />
for DGEBA cover<strong>in</strong>g 12 decades <strong>of</strong> frequency, obta<strong>in</strong>ed <strong>in</strong><br />
<strong>the</strong> temperature range from 123.2 to 353.2 K.<br />
The real and imag<strong>in</strong>ary parts <strong>of</strong> <strong>the</strong> dielectric constant,<br />
() and (), <strong>of</strong> our samples are displayed <strong>in</strong> Figs. 1<br />
and 2 at several temperatures. The iso<strong>the</strong>rmal data for <strong>the</strong><br />
dielectric constant were analyzed <strong>in</strong> terms <strong>of</strong> l<strong>in</strong>ear superposition<br />
<strong>of</strong> relaxation and conductivity contributions additive<br />
ansatz, with each relaxation process described by a<br />
Havriliak–Negami HN function:<br />
* k<br />
k<br />
1i HNk 1 k k<br />
i<br />
. 1<br />
0<br />
In Eq. 1 <strong>the</strong> <strong>in</strong>dex k runs over <strong>the</strong> relaxation processes and<br />
<strong>the</strong> conductivity effect is taken <strong>in</strong>to account by <strong>the</strong> term<br />
i/ 0 0 is <strong>the</strong> dielectric permittivity <strong>of</strong> vacuum. is<br />
<strong>the</strong> high-frequency limit <strong>of</strong> outside <strong>the</strong> dispersion zone,<br />
and k is <strong>the</strong> dielectric strength <strong>of</strong> each process. The fit<br />
with this phenomenological function allows us to extract<br />
characteristic parameters for <strong>the</strong> different relaxation peaks,<br />
i.e., <strong>the</strong> frequency <strong>of</strong> maximum loss and <strong>the</strong> peak shape. The<br />
frequency <strong>of</strong> maximum , f max , can be analytically calculated<br />
from <strong>the</strong> HN fitt<strong>in</strong>g parameters by<br />
1/1<br />
1<br />
f max2 HN 1 s<strong>in</strong><br />
21 s<strong>in</strong> 1/1<br />
2437<br />
1<br />
21 . 2<br />
From this quantity a characteristic relaxation time max<br />
(2f max) 1 , can be easily obta<strong>in</strong>ed, usually preferred to<br />
HN s<strong>in</strong>ce it is a model-<strong>in</strong>dependent parameter. Concern<strong>in</strong>g<br />
<strong>the</strong> shape <strong>of</strong> <strong>the</strong> dielectric peak, <strong>the</strong> HN function gives <strong>the</strong><br />
asymptotic behavior <strong>of</strong> () <strong>in</strong> <strong>the</strong> low- and highfrequency<br />
limits as power laws, m and n respectively,<br />
whose exponents are simply expressed <strong>in</strong> terms <strong>of</strong><br />
<strong>the</strong> HN shape parameters and through <strong>the</strong> relations m<br />
(1) and n(1).<br />
The real and <strong>the</strong> imag<strong>in</strong>ary parts <strong>of</strong> *() have been<br />
fitted simultaneously by us<strong>in</strong>g <strong>the</strong> nonl<strong>in</strong>ear least-squares<br />
Levenberg–Marquard rout<strong>in</strong>e. The uncerta<strong>in</strong>ties <strong>of</strong> <strong>the</strong> fitt<strong>in</strong>g<br />
parameters have been estimated by means <strong>of</strong> a Monte Carlo<br />
procedure. In particular, start<strong>in</strong>g from each experimental<br />
spectrum 100 ‘‘artificial’’ data sets have been produced by<br />
means <strong>of</strong> <strong>the</strong> bootstrap Monte Carlo method, 30 replac<strong>in</strong>g a<br />
random fraction <strong>of</strong> orig<strong>in</strong>al po<strong>in</strong>ts by duplicated orig<strong>in</strong>al<br />
po<strong>in</strong>ts. Each data set has been fitted by means <strong>of</strong> <strong>the</strong><br />
Levenberg–Marquardt rout<strong>in</strong>e, giv<strong>in</strong>g a distribution <strong>of</strong> fitt<strong>in</strong>g<br />
parameters. An estimate <strong>of</strong> <strong>the</strong> error <strong>of</strong> each parameter has<br />
been obta<strong>in</strong>ed by <strong>the</strong> standard deviation <strong>of</strong> <strong>the</strong> probability<br />
distribution <strong>of</strong> <strong>the</strong> fitt<strong>in</strong>g parameters. F<strong>in</strong>ally, <strong>the</strong> errors <strong>of</strong> <strong>the</strong><br />
HN fitt<strong>in</strong>g parameters have been used to estimate <strong>the</strong> error <strong>of</strong><br />
<strong>the</strong> relaxation time max .<br />
Downloaded 14 Nov 2002 to 194.95.63.241. Redistribution subject to AIP license or copyright, see http://ojps.aip.org/jcpo/jcpcr.jsp
2438 J. Chem. Phys., Vol. 117, No. 5, 1 August 2002 Corezzi et al.<br />
2. Heat capacity spectroscopy (HCS)<br />
The dynamic effusivity c p *(,T)c pic p <br />
is <strong>the</strong> heat conductivity, <strong>the</strong> density, and c p * <strong>the</strong> dynamic<br />
heat capacity was measured by <strong>the</strong> 3 method 31 <strong>in</strong> <strong>the</strong> frequency<br />
range from 0.2 to 2000 Hz. Nickel heaters with a<br />
thickness <strong>of</strong> about 70 nm on polye<strong>the</strong>r e<strong>the</strong>r ketone PEEK<br />
substrates were used. The temperature coefficient <strong>of</strong> resistance<br />
was about 2000 ppm/K. The nickel heater was placed<br />
<strong>in</strong> a Wheatstone bridge that was equilibrated automatically<br />
dur<strong>in</strong>g <strong>the</strong> measurements. The rema<strong>in</strong><strong>in</strong>g difference signal<br />
across <strong>the</strong> bridge was preamplified by a low-noise preamplifier<br />
EG&G 5113. A 12-bit analog to digital converter was<br />
used to collect <strong>the</strong> data. Amplitude and phase <strong>of</strong> <strong>the</strong> third<br />
harmonic were determ<strong>in</strong>ed afterwards by a selective Fourier<br />
transformation. Fur<strong>the</strong>r experimental details about our setup<br />
are described elsewhere. 32,33<br />
Measurements on two different heaters were performed<br />
for both epoxy samples: small nickel heaters (1.56 mm 2 )<br />
were used for high frequencies 1 Hz, large nickel heaters<br />
(510 mm 2 ) were used for low frequencies 0.2–20 Hz.<br />
This ensures <strong>the</strong> signal amplitude and precision to be large<br />
enough at high frequencies amplitude 1/2 and <strong>the</strong> <strong>the</strong>rmal<br />
wavelength to be small compared to <strong>the</strong> heater dimensions<br />
at low frequencies as required by <strong>the</strong> data evaluation<br />
concept. The samples were equilibrated for 30 m<strong>in</strong> before an<br />
iso<strong>the</strong>rmal frequency sweep was started<br />
The frequency-dependent width <strong>of</strong> <strong>the</strong> peak, T, and<br />
<strong>the</strong> dynamic <strong>glass</strong> transition temperature, T , were determ<strong>in</strong>ed<br />
by Gaussian fits to <strong>the</strong> isochronal (const) data for<br />
<strong>the</strong> imag<strong>in</strong>ary part c p(T). The calorimetric <strong>in</strong>tensity<br />
was obta<strong>in</strong>ed from a tangent construction to <strong>the</strong> real part<br />
c p(T) see Fig. 3c. To get f<strong>in</strong>ally (1/c p) values from<br />
our 3 method output, <strong>the</strong> data were adjusted to heat capacities<br />
c p * from temperature-modulated DSC TMDSC at <br />
2/60 s. A fixed factor correction was used: all isochrones<br />
<strong>of</strong> one 3 run were divided by a heater-specific mean value<br />
<strong>of</strong> . The error caused by this temperature- and frequency<strong>in</strong>dependent<br />
mean value correction is found to be small. 34<br />
The isochronal HCS sweeps <strong>of</strong> Fig. 3 are transferred <strong>in</strong>to<br />
iso<strong>the</strong>rmal c p * data versus frequency <strong>in</strong> Fig. 4.<br />
3. Viscosity measurements<br />
The shear viscosity was measured with a Rheometrics<br />
Dynamic Analyzer RDA-II and a Dynamic Stress Rheometer<br />
DSR <strong>in</strong>struments from Rheometrics Scientific <strong>in</strong> plate-plate<br />
geometry. Parallel plates with a diameter <strong>of</strong> 25 mm were<br />
used <strong>in</strong> <strong>the</strong> temperature range from 276 to 379 K for PPGE<br />
and <strong>in</strong> <strong>the</strong> range from 269 to 339 K for DGEBA. The sample<br />
thickness was about 1.5 mm. A shear rate sweep over one<br />
decade was performed at each temperature to prove <strong>the</strong> Newtonian<br />
behavior <strong>of</strong> <strong>the</strong> liquid. The <strong>the</strong>rmal expansion <strong>of</strong> <strong>the</strong><br />
tools about 2.5 m/K and <strong>the</strong> samples was corrected dur<strong>in</strong>g<br />
<strong>the</strong> measurements. Some data po<strong>in</strong>ts at temperatures between<br />
267 and 259 K were added for DGEBA by extend<strong>in</strong>g<br />
<strong>the</strong> sample between two 8 mm plates to a hyperboloid<br />
with a f<strong>in</strong>al length <strong>of</strong> about 8 mm for details see Ref. 35.<br />
In <strong>the</strong> temperature range from 332 to 453 K viscosity<br />
was measured by an Ubbelohde type viscosimeter (k<br />
FIG. 3. Real and imag<strong>in</strong>ary parts <strong>of</strong> <strong>the</strong> HCS signal, c p * , as a function <strong>of</strong><br />
temperature for a PPGE and b DGEBA 2 Hz, triangle; 20 Hz, diamond;<br />
200 Hz, circle; 2 kHz, square. The method <strong>of</strong> determ<strong>in</strong><strong>in</strong>g <strong>the</strong> calorimetric<br />
parameters T and T from a Gaussian fit to <strong>the</strong> imag<strong>in</strong>ary part and<br />
(1/c p) from a tangent construction to <strong>the</strong> real part is shown <strong>in</strong> part c,<br />
where isochronal data at 20 Hz for PPGE are used.<br />
0.05 mm 2 /s 2 ). An oil bath was used to control <strong>the</strong> sample<br />
temperature. The viscosity was calculated accord<strong>in</strong>g to <br />
t U k from flow time t U , capillary constant k, and<br />
temperature-dependent density . The density (T) 01<br />
V(T273)) for DGEBA was measured by a Guy–<br />
Lussac-type picnometer at temperatures between 296 and<br />
318 K and extrapolated to higher temperatures. A <strong>the</strong>rmal<br />
FIG. 4. Real and imag<strong>in</strong>ary parts <strong>of</strong> c p * as a function <strong>of</strong> frequency for<br />
PPGE upper frame and DGEBA lower frame. The solid l<strong>in</strong>es show an<br />
example <strong>of</strong> a HN fit to <strong>the</strong> data correspond<strong>in</strong>g to T274 K for PPGE, and<br />
T269.1 K for DGEBA. The dashed l<strong>in</strong>es are only guides to <strong>the</strong> eyes.<br />
Downloaded 14 Nov 2002 to 194.95.63.241. Redistribution subject to AIP license or copyright, see http://ojps.aip.org/jcpo/jcpcr.jsp
J. Chem. Phys., Vol. 117, No. 5, 1 August 2002 <strong>Two</strong> <strong>crossover</strong> <strong>regions</strong> <strong>in</strong> <strong>the</strong> <strong>dynamics</strong> <strong>of</strong> epoxy res<strong>in</strong>s<br />
FIG. 5. Logarithm <strong>of</strong> viscosity vs temperature for PPGE and DGEBA, obta<strong>in</strong>ed<br />
by different devices as expla<strong>in</strong>ed <strong>in</strong> <strong>the</strong> legend.<br />
expansion coefficient V(6.260.03)10 4 K 1 and a<br />
density at 273 K 01.18230.0003 g/cm 3 were obta<strong>in</strong>ed<br />
for DGEBA. The correspond<strong>in</strong>g values for PPGE taken from<br />
measurements <strong>in</strong> <strong>the</strong> range from 287 to 332 K were V<br />
(6.30.1)10 4 K 1 and 01.22660.0003 g/cm 3 .<br />
Figure 5 shows <strong>the</strong> viscosity data for DGEBA and PPGE<br />
over <strong>the</strong> whole temperature range measured. For comparison,<br />
<strong>the</strong> same figure <strong>in</strong>cludes some viscosity data for DGEBA<br />
from dynamical mechanical measurements, carried out via a<br />
Rheometrics RMS 800 <strong>in</strong> <strong>the</strong> range from 255 to 374 K and<br />
published <strong>in</strong> a previous article 36 where experimental details<br />
can also be found.<br />
III. RESULTS<br />
The iso<strong>the</strong>rmal dielectric spectra <strong>of</strong> PPGE and DGEBA<br />
Figs. 1 and 2 show clearly <strong>the</strong> presence <strong>of</strong> two relaxation<br />
processes for TT g : <strong>the</strong> ma<strong>in</strong> process and a secondary<br />
process. As <strong>the</strong> temperature <strong>in</strong>creases above T g , <strong>the</strong> <br />
relaxation shifts toward higher frequencies, approach<strong>in</strong>g <strong>the</strong><br />
secondary peak <strong>in</strong> <strong>the</strong> GHz region. For TT g <strong>the</strong> ma<strong>in</strong> relaxation<br />
is out <strong>of</strong> <strong>the</strong> accessible frequency w<strong>in</strong>dow, and it is<br />
possible to identify a fur<strong>the</strong>r very small secondary process<br />
whose loss peak position is <strong>in</strong>termediate between <strong>the</strong> <br />
and processes see <strong>in</strong>set <strong>in</strong> Figs. 1b and 2b. Concern<strong>in</strong>g<br />
<strong>the</strong> spectral shape, both <strong>the</strong> ma<strong>in</strong> and secondary relaxations<br />
<strong>of</strong> PPGE and DGEBA show a pronounced non-Debye<br />
character i.e., 1 and/or 0 <strong>in</strong> Eq. 1; <strong>in</strong> particular,<br />
<strong>the</strong> relaxation can be well represented by a symmetrical<br />
Cole–Cole function i.e., 1 with 0.5. The dielectric<br />
strength <strong>of</strong> <strong>the</strong> relaxation is very small compared to that <strong>of</strong><br />
<strong>the</strong> relaxation e.g., we f<strong>in</strong>d below T g to be around<br />
0.05, that is about 1% <strong>of</strong> , for both PPGE and DGEBA,<br />
so that we cannot follow its trace above T g any more. In <strong>the</strong><br />
present analysis we neglect its contribution and use <strong>the</strong> sum<br />
<strong>of</strong> two HN terms, one for <strong>the</strong> and <strong>the</strong> o<strong>the</strong>r for <strong>the</strong> <br />
relaxation, to describe <strong>the</strong> spectra above T g . The fitt<strong>in</strong>g<br />
curves are drawn as solid l<strong>in</strong>es <strong>in</strong> Figs. 1 and 2, where <strong>the</strong><br />
conductivity contribution has been cut <strong>of</strong>f from <strong>the</strong> lowerfrequency<br />
part <strong>of</strong> <strong>the</strong> spectra for reasons <strong>of</strong> clarity. Due to <strong>the</strong><br />
progressive overlap <strong>of</strong> <strong>the</strong> and relaxations, it becomes<br />
more and more difficult to obta<strong>in</strong> mean<strong>in</strong>gful values for <strong>the</strong><br />
shape parameters by <strong>in</strong>creas<strong>in</strong>g <strong>the</strong> temperature. We thus<br />
2439<br />
chose to fit <strong>the</strong> high-temperature (T303 K) spectra <strong>of</strong><br />
PPGE by constra<strong>in</strong><strong>in</strong>g <strong>the</strong> shape <strong>of</strong> <strong>the</strong> relaxation to vary<br />
with<strong>in</strong> <strong>the</strong> range <strong>of</strong> values found at lower temperatures,<br />
where <strong>the</strong> time–temperature superposition pr<strong>in</strong>ciple appears<br />
to be well satisfied (m 0.640.02;n 0.400.01). In<br />
<strong>the</strong> case <strong>of</strong> DGEBA, <strong>the</strong> fit procedure <strong>of</strong> <strong>the</strong> spectra has been<br />
repeated by exploit<strong>in</strong>g <strong>the</strong> data at lower frequencies and<br />
adopt<strong>in</strong>g at <strong>the</strong> highest temperatures (T288 K) <strong>the</strong> criterion<br />
<strong>of</strong> keep<strong>in</strong>g <strong>in</strong>variant <strong>the</strong> parameter n 0.4 as found at<br />
lower temperature. This criterion was motivated by <strong>the</strong><br />
time–temperature superposition pr<strong>in</strong>ciple and supported by<br />
previous light-scatter<strong>in</strong>g results 36 for <strong>the</strong> shape <strong>of</strong> <strong>the</strong> ma<strong>in</strong><br />
process <strong>in</strong> DGEBA over <strong>the</strong> same temperature <strong>in</strong>terval as <strong>the</strong><br />
present dielectric <strong>in</strong>vestigation. In fact, <strong>the</strong> mutual consistency<br />
<strong>of</strong> dielectric and depolarized light-scatter<strong>in</strong>g shape parameters<br />
was observed, although <strong>the</strong> characteristic times <strong>of</strong><br />
<strong>the</strong> process revealed by <strong>the</strong> two techniques were different.<br />
S<strong>in</strong>ce <strong>in</strong> case <strong>of</strong> light-scatter<strong>in</strong>g spectra <strong>the</strong>re is no signature<br />
<strong>of</strong> <strong>the</strong> secondary peak visible <strong>in</strong> <strong>the</strong> dielectric ones, a more<br />
reliable determ<strong>in</strong>ation <strong>of</strong> <strong>the</strong> shape parameters could be<br />
made, giv<strong>in</strong>g m 0.9 and n 0.4. 36 In our dielectric fit<br />
procedure <strong>the</strong> shape parameter m was set as free; anyway,<br />
its value was found almost constant around 0.9 see also<br />
Table I, thus validat<strong>in</strong>g <strong>the</strong> guess <strong>of</strong> a shape <strong>in</strong>variance. The<br />
parameters for <strong>the</strong> relaxation <strong>of</strong> PPGE and DGEBA obta<strong>in</strong>ed<br />
from <strong>the</strong> HN fit at several temperatures are given <strong>in</strong><br />
Table I with error estimates.<br />
The iso<strong>the</strong>rmal HCS spectra <strong>of</strong> PPGE and DGEBA reported<br />
<strong>in</strong> Fig. 4 show a well-def<strong>in</strong>ed peak <strong>in</strong> <strong>the</strong> imag<strong>in</strong>ary<br />
part c p(), correspond<strong>in</strong>g to <strong>the</strong> characteristic relaxation<br />
step <strong>in</strong> <strong>the</strong> real part c p(). In <strong>the</strong> frequency and temperature<br />
range <strong>in</strong>vestigated here only one relaxation process is<br />
observed. In pr<strong>in</strong>ciple, all c p * iso<strong>the</strong>rms could be approximated<br />
by a s<strong>in</strong>gle HN function, giv<strong>in</strong>g for each temperature,<br />
after reduction by , <strong>the</strong> frequency <strong>of</strong> maximum c p , <strong>the</strong><br />
calorimetric <strong>in</strong>tensity c p , and <strong>the</strong> shape parameters, <strong>in</strong> a<br />
manner similar to Eq. 1. However, several sources <strong>of</strong> error<br />
make <strong>the</strong> data c p *() subject to considerable<br />
uncerta<strong>in</strong>ty 32,37 and limit, toge<strong>the</strong>r with <strong>the</strong> narrow frequency<br />
range accessible, <strong>the</strong> possibility for determ<strong>in</strong><strong>in</strong>g a reliable set<br />
<strong>of</strong> fit parameters. In <strong>the</strong> present case, only for a few temperatures<br />
can <strong>the</strong> whole set <strong>of</strong> HN fit parameters be determ<strong>in</strong>ed<br />
with reasonable accuracy. In particular, <strong>the</strong> fit <strong>of</strong> c p *()<br />
for PPGE at 274 K results <strong>in</strong> (c p)(5.960.30)<br />
10 4 J 2 cm 4 K 2 s 1 , HN(6.71.9)10 3 s, m<br />
0.680.04, and n0.440.07, while <strong>the</strong> fit <strong>of</strong> c p *()<br />
for DGEBA at 269.1 K gives (c p)(5.370.55)<br />
10 4 J 2 cm 4 K 2 s 1 , HN(1.670.09)10 3 s, m<br />
0.670.06, and n0.390.11. The correspond<strong>in</strong>g fitt<strong>in</strong>g<br />
curves are reported as solid l<strong>in</strong>es <strong>in</strong> Fig. 4. For each system,<br />
<strong>the</strong> data at all o<strong>the</strong>r temperatures were fitted by fix<strong>in</strong>g <strong>the</strong><br />
shape parameters with<strong>in</strong> <strong>the</strong> range allowed by <strong>the</strong>se values.<br />
The results for c p and max are <strong>in</strong> fair agreement with those<br />
obta<strong>in</strong>ed <strong>in</strong> <strong>the</strong> correspond<strong>in</strong>g temperature range from tangent<br />
construction and Gaussian fits to isochronal data. We<br />
note that shape parameters obta<strong>in</strong>ed by HCS are not far away<br />
from those obta<strong>in</strong>ed by dielectric spectroscopy. Usually it is<br />
found 31,37–39 that c p peaks tend to be narrower and more<br />
symmetric than <strong>the</strong> correspond<strong>in</strong>g dielectric loss curves.<br />
Downloaded 14 Nov 2002 to 194.95.63.241. Redistribution subject to AIP license or copyright, see http://ojps.aip.org/jcpo/jcpcr.jsp
2440 J. Chem. Phys., Vol. 117, No. 5, 1 August 2002 Corezzi et al.<br />
TABLE I. Havriliak–Negami fit parameters for <strong>the</strong> relaxation <strong>of</strong> PPGE and DGEBA at several temperatures. When a shape parameter was undergo<strong>in</strong>g<br />
additional constra<strong>in</strong>ts as expla<strong>in</strong>ed <strong>in</strong> <strong>the</strong> text, <strong>the</strong> respective error is not reported.<br />
T K<br />
PPGE<br />
HN s m n T K HN s m n However, <strong>the</strong> significant uncerta<strong>in</strong>ty <strong>of</strong> HCS parameters restra<strong>in</strong>s<br />
us from go<strong>in</strong>g <strong>in</strong>to a deeper comparison.<br />
The dielectric relaxation times max obta<strong>in</strong>ed from <strong>the</strong><br />
fitt<strong>in</strong>g procedure, toge<strong>the</strong>r with <strong>the</strong> calorimetric characteristic<br />
times max obta<strong>in</strong>ed from <strong>the</strong> location <strong>of</strong> <strong>the</strong> peak <strong>in</strong> <strong>the</strong><br />
isochronal or iso<strong>the</strong>rmal c p spectra, are reported <strong>in</strong> <strong>the</strong><br />
Arrhenius plot <strong>of</strong> Figs. 6 and 7 and compared with <strong>the</strong> viscosity<br />
data. The trace <strong>of</strong> calorimetry and dielectrics co<strong>in</strong>cide<br />
with<strong>in</strong> <strong>the</strong> experimental uncerta<strong>in</strong>ty, and <strong>the</strong>ir temperature<br />
dependence closely parallels that <strong>of</strong> . Figure 8 shows a<br />
conv<strong>in</strong>c<strong>in</strong>g check <strong>of</strong> <strong>the</strong> relation max <strong>in</strong> our samples, up<br />
to 332 K <strong>in</strong> PPGE and 343 K <strong>in</strong> DGEBA. It displays that a<br />
l<strong>in</strong>ear fit <strong>of</strong> log max vs log has slope 0.990.02 and 0.98<br />
0.02 <strong>in</strong> PPGE and DGEBA, respectively. Accord<strong>in</strong>g to<br />
max, <strong>the</strong> viscosity data are rescaled up to <strong>the</strong> highest temperatures<br />
measured, and shown as solid l<strong>in</strong>es <strong>in</strong> <strong>the</strong> Arrhenius<br />
plot <strong>of</strong> Figs. 6a and 7a. We notice that <strong>the</strong> proportionality<br />
<strong>of</strong> max to <strong>in</strong> supercooled liquids has a physical basis<br />
<strong>in</strong> <strong>the</strong> -scale universality predicted by <strong>the</strong> mode coupl<strong>in</strong>g<br />
<strong>the</strong>ory and verified <strong>in</strong> different systems e.g., see Ref. 40,<br />
but it is possible that at sufficiently high temperatures a<br />
max/T regime ensues, as predicted by <strong>the</strong> hydrodynamic<br />
Debye model and recently observed <strong>in</strong> low-molecular-weight<br />
organic compounds. 13 However, <strong>the</strong> possible differences <strong>in</strong><br />
Figs. 6 and 7 due to a maxT rescal<strong>in</strong>g <strong>of</strong> <strong>the</strong> viscosity<br />
data for temperatures higher than those represented <strong>in</strong> Fig. 8<br />
have no significant effect on <strong>the</strong> analysis and discussion reported<br />
<strong>in</strong> <strong>the</strong> follow<strong>in</strong>g.<br />
Toge<strong>the</strong>r with <strong>the</strong> secondary relaxation times, Figs. 6a<br />
and 7a give <strong>the</strong> complete relaxation map <strong>of</strong> our samples <strong>in</strong><br />
<strong>the</strong> supercooled and <strong>glass</strong>y state, as revealed by dielectric<br />
spectroscopy, HCS, and viscosity measurements. As known,<br />
<strong>the</strong> <strong>glass</strong> transition phenomenon is commonly described as<br />
an ergodic- to nonergodic-state transition and T g is def<strong>in</strong>ed as<br />
<strong>the</strong> temperature at which <strong>the</strong> ergodicity is broken on <strong>the</strong> ex-<br />
DGEBA<br />
331.8 (7.63)109 0.63 0.41 2.70.6 343 (9.52.3)1010 10.03 0.42 0.60.3<br />
327.9 (1.040.06)108 0.63 0.40 3.10.6 333 (2.40.5)109 10.03 0.42 1.30.2<br />
323.1 (1.800.05)108 0.64 0.40 3.20.3 323 (5.00.5)109 10.04 0.42 2.00.3<br />
317.9 (3.60.2)108 0.63 0.40 3.40.4 313 (1.250.08)108 0.950.03 0.41 2.70.2<br />
313.0 (6.60.2)108 0.63 0.40 3.80.3 303 (4.480.13)108 0.880.02 0.41 3.50.4<br />
308.0 (1.450.06)107 0.63 0.39 4.10.4 298 (1.080.05)107 0.870.02 0.41 3.90.5<br />
303.1 (3.80.2)107 0.610.02 0.390.02 4.40.2 293 (3.210.08)107 0.880.02 0.39 4.20.3<br />
298.3 (1.070.03)106 0.620.02 0.390.02 4.70.3 288 (8.90.4)107 0.860.03 0.400.05 4.70.3<br />
293.1 (4.130.06)106 0.640.015 0.390.02 4.90.2 283 (3.750.12)106 0.860.03 0.400.04 5.10.3<br />
287.5 (2.1900.013)105 0.630.02 0.390.02 5.390.15 278 (2.210.06)105 0.830.02 0.390.02 5.710.03<br />
283.9 (7.80.3)105 0.640.02 0.400.02 5.60.2 273 (2.120.08)104 0.850.01 0.400.01 6.210.03<br />
278.9 (5.70.2)104 0.650.01 0.400.01 5.90.2 268 (3.390.09)103 0.850.01 0.400.01 6.830.05<br />
274.4 (4.820.13)103 0.650.01 0.400.01 6.380.05 263 (7.10.3)102 0.820.02 0.430.02 7.370.05<br />
270.1 (5.220.17)102 0.650.01 0.390.01 6.80.2 261 (3.20.2)101 0.820.02 0.430.02 7.730.08<br />
266.3 (5.70.1)101 0.650.02 0.400.01 7.20.2 259 (1.650.04)1 0 0.830.02 0.400.01 7.80.2<br />
262.1 (1.020.08)10 1 0.670.03 0.400.01 7.50.2 256 (2.250.06)10 1 0.820.04 0.400.01 8.00.2<br />
FIG. 6. a Arrhenius plot for PPGE. The temperature dependence <strong>of</strong> <strong>the</strong><br />
dynamic <strong>glass</strong> transition is reconstructed via <strong>the</strong> trace <strong>of</strong> max(2f max) 1<br />
from open circles and c p solid triangles, and via <strong>the</strong> viscosity data<br />
<strong>the</strong> solid l<strong>in</strong>e shows experimental data <strong>of</strong> log( 1 ), with log 8.3 and <br />
<strong>in</strong> Pa s. The dielectric and relaxation times are reported with diamond<br />
and squares, respectively. The dash l<strong>in</strong>e is an Arrhenius fit to <strong>the</strong> TT g <br />
relaxation data log 0s14.70.2, E a6.670.15 kcal/mol; its extrapolation<br />
above T g is drawn with dot l<strong>in</strong>e. The dash-dotted l<strong>in</strong>e is an<br />
Arrhenius fit to <strong>the</strong> -relaxation data log 0 s14.60.3, E a11.3<br />
0.2 kcal/mol. The- and -<strong>crossover</strong> <strong>regions</strong> are <strong>in</strong>dicated by arrows.<br />
b Temperature dependence <strong>of</strong> <strong>the</strong> dielectric strengths <strong>of</strong> PPGE. The <strong>in</strong>set<br />
shows, <strong>in</strong> an enlarged scale, circles and down triangles above<br />
T g , and <strong>the</strong> calorimetric <strong>in</strong>tensity c p up triangles, <strong>in</strong> units J kg 1 K 1 .<br />
The solid l<strong>in</strong>e is a l<strong>in</strong>ear fit to , extrapolated to <strong>the</strong> onset temperature<br />
T on . The dashed l<strong>in</strong>e is not a fit, but only a guide to <strong>the</strong> eyes, drawn to<br />
demonstrate <strong>the</strong> compatibility <strong>of</strong> <strong>the</strong> c p trend with <strong>the</strong> dielectric onset.<br />
Error bars smaller than <strong>the</strong> symbol size are omitted.<br />
Downloaded 14 Nov 2002 to 194.95.63.241. Redistribution subject to AIP license or copyright, see http://ojps.aip.org/jcpo/jcpcr.jsp
J. Chem. Phys., Vol. 117, No. 5, 1 August 2002 <strong>Two</strong> <strong>crossover</strong> <strong>regions</strong> <strong>in</strong> <strong>the</strong> <strong>dynamics</strong> <strong>of</strong> epoxy res<strong>in</strong>s<br />
FIG. 7. a Arrhenius plot for DGEBA. The temperature dependence <strong>of</strong> <strong>the</strong><br />
dynamic <strong>glass</strong> transition is reconstructed via <strong>the</strong> trace <strong>of</strong> max(2f max) 1<br />
from open circles and c p solid triangles, and via <strong>the</strong> viscosity data<br />
<strong>the</strong> solid l<strong>in</strong>e shows experimental data <strong>of</strong> log( 1 ), with log 8.4 and <br />
<strong>in</strong> Pa s, also <strong>in</strong>clud<strong>in</strong>g data from Ref. 36. The dielectric - and -relaxation<br />
times are reported with diamond and squares, respectively. The dashed l<strong>in</strong>e<br />
is an Arrhenius fit to <strong>the</strong> TT g relaxation data log 0 s14.35<br />
0.13, E a6.60.1 kcal/mol; its extrapolation above T g is drawn with a<br />
dotted l<strong>in</strong>e. The dash-dotted l<strong>in</strong>e is an Arrhenius fit to <strong>the</strong> relaxation<br />
data log 0 s14.780.09, E a11.380.08 kcal/mol. The - and<br />
-<strong>crossover</strong> <strong>regions</strong> are <strong>in</strong>dicated by arrows. b Temperature dependence <strong>of</strong><br />
<strong>the</strong> dielectric strengths <strong>of</strong> DGEBA. The <strong>in</strong>set shows circles and <br />
down triangles above T g , and <strong>the</strong> calorimetric <strong>in</strong>tensity c p up triangles,<br />
<strong>in</strong> units J kg 1 K 1 . The solid l<strong>in</strong>e is a l<strong>in</strong>ear fit to , extrapolated<br />
to <strong>the</strong> onset temperature T on . The dashed l<strong>in</strong>e is drawn as a guide to<br />
<strong>the</strong> eyes. Error bars smaller than <strong>the</strong> symbol size are omitted.<br />
perimental time scale. The characteristic time (T g) may<br />
strongly depend on <strong>the</strong> experimental probe used and on <strong>the</strong><br />
cool<strong>in</strong>g rate; <strong>in</strong> particular, <strong>in</strong> a typical dielectric experiment<br />
<strong>the</strong> out-<strong>of</strong>-equilibrium state occurs when <strong>the</strong> structural relaxation<br />
time approximately exceeds 10 2 s. The dielectric value<br />
<strong>of</strong> T g calculated <strong>in</strong> our samples by follow<strong>in</strong>g this criterion is<br />
given <strong>in</strong> <strong>the</strong> second column <strong>of</strong> Table II, where good agreement<br />
with <strong>the</strong> calorimetric value from conventional DSC can<br />
be noticed. Also <strong>in</strong>cluded <strong>in</strong> Table II is <strong>the</strong> steepness <strong>in</strong>dex<br />
md(log )/d(T g /T) TTg , which quantifies <strong>the</strong> fragility <strong>of</strong><br />
<strong>the</strong> system <strong>in</strong> terms <strong>of</strong> its temperature behavior at T g .<br />
At lower temperatures <strong>the</strong> system is <strong>in</strong> <strong>the</strong> nonequilibrium<br />
<strong>glass</strong>y state. There, two secondary processes and <br />
process coexist, both show<strong>in</strong>g Arrhenius behavior. The correspond<strong>in</strong>g<br />
fitt<strong>in</strong>g parameters are listed <strong>in</strong> Table III. The dotted<br />
segment <strong>in</strong> Figs. 6a and 7a shows that at temperatures<br />
higher than T g <strong>the</strong> trace deviates significantly from <strong>the</strong><br />
extrapolation <strong>of</strong> <strong>the</strong> behavior below T g . In particular, it first<br />
becomes flatter i.e., lower apparent activation energy and<br />
<strong>the</strong>n goes on with <strong>in</strong>creas<strong>in</strong>g slope i.e., <strong>in</strong>creas<strong>in</strong>g apparent<br />
activation energy, which becomes comparable to that found<br />
below T g . Different approaches for analyz<strong>in</strong>g relaxation<br />
functions <strong>in</strong> <strong>the</strong> case <strong>of</strong> <strong>the</strong> overlap <strong>of</strong> <strong>the</strong> two processes are<br />
debated <strong>in</strong> literature, 41–47 and <strong>the</strong>ir repercussions are especially<br />
expected <strong>in</strong> <strong>the</strong> Arrhenius diagram <strong>in</strong> <strong>the</strong> region where<br />
2441<br />
FIG. 8. Ma<strong>in</strong> frame: dielectric relaxation time max vs viscosity <strong>in</strong> a<br />
log–log representation, where <strong>the</strong> relation max corresponds to a l<strong>in</strong>ear<br />
behavior with slope 1. a The solid l<strong>in</strong>e slope 0.990.02 is a l<strong>in</strong>ear fit to<br />
<strong>the</strong> data <strong>of</strong> PPGE over six decades, <strong>in</strong> <strong>the</strong> temperature range 276–332 K. b<br />
The straight l<strong>in</strong>e slope 0.980.02 is a l<strong>in</strong>ear fit to <strong>the</strong> data <strong>of</strong> DGEBA over<br />
ten decades, <strong>in</strong> <strong>the</strong> temperature range 256–343 K. Inset: Conductivity vs<br />
reciprocal viscosity 1 <strong>in</strong> a log–log representation. The straight l<strong>in</strong>es are<br />
fits <strong>of</strong> <strong>the</strong> relation n const. a The fitt<strong>in</strong>g l<strong>in</strong>e corresponds to n0.77<br />
0.03 <strong>in</strong> <strong>the</strong> lower-temperature range solid l<strong>in</strong>e and n0.940.03 <strong>in</strong> <strong>the</strong><br />
higher-temperature range dashed l<strong>in</strong>e for PPGE, and b to n1.02<br />
0.03 <strong>in</strong> <strong>the</strong> temperature range 300–378 K for DGEBA. Data correspond<strong>in</strong>g<br />
to characteristic temperatures are <strong>in</strong>dicated for <strong>the</strong> mean<strong>in</strong>g <strong>of</strong> T and<br />
T on see text.<br />
<strong>the</strong> processes tend to merge. Then we cannot completely rule<br />
out <strong>the</strong> possibility <strong>of</strong> some <strong>in</strong>fluence <strong>of</strong> <strong>the</strong> analysis method<br />
on <strong>the</strong> higher temperature values. However, such an <strong>in</strong>fluence<br />
does not affect <strong>the</strong> data for <strong>the</strong> relaxation <strong>in</strong> <strong>the</strong><br />
region where <strong>the</strong> separation from <strong>the</strong> process is two decades<br />
at least, s<strong>in</strong>ce under this condition an analysis <strong>of</strong> <strong>the</strong><br />
separation us<strong>in</strong>g <strong>the</strong> additive ansatz is always<br />
justified. 43,44,46 In particular, we notice that a deviation from<br />
<strong>the</strong> extrapolated Arrhenius behavior <strong>of</strong> <strong>the</strong> trace occurs just<br />
above T g where <strong>the</strong> separation <strong>of</strong> <strong>the</strong> and time scales is<br />
nearly ten decades, and this is actually confirmed by deconvolut<strong>in</strong>g<br />
<strong>the</strong> and processes accord<strong>in</strong>g to alternative fitt<strong>in</strong>g<br />
procedures 48,49 based on <strong>the</strong> Williams ansatz. 41–47 Moreover,<br />
<strong>the</strong> effect <strong>of</strong> different fitt<strong>in</strong>g approaches on <strong>the</strong> relaxation<br />
time values at higher temperatures has been proven 48 not to<br />
affect qualitatively <strong>the</strong> trend <strong>of</strong> (T), and we have no reason<br />
to th<strong>in</strong>k also <strong>the</strong> higher-temperature bend<strong>in</strong>g <strong>of</strong> <strong>the</strong> <br />
trace to be an artifact <strong>of</strong> <strong>the</strong> evaluation method.<br />
Also <strong>the</strong> dc conductivity, , can be used as an efficient<br />
probe <strong>of</strong> <strong>the</strong> <strong>dynamics</strong> <strong>of</strong> supercooled systems. It should be<br />
noted that different samples <strong>of</strong> <strong>the</strong> same material might show<br />
different absolute values, s<strong>in</strong>ce this is proportional to <strong>the</strong><br />
amount <strong>of</strong> impurities <strong>in</strong> <strong>the</strong> sample typically chlor<strong>in</strong>e, <strong>in</strong><br />
epoxy compounds. However, <strong>the</strong> temperature dependence <strong>of</strong><br />
Downloaded 14 Nov 2002 to 194.95.63.241. Redistribution subject to AIP license or copyright, see http://ojps.aip.org/jcpo/jcpcr.jsp
2442 J. Chem. Phys., Vol. 117, No. 5, 1 August 2002 Corezzi et al.<br />
TABLE II. Calorimetric and dielectric <strong>glass</strong> transition temperature, T g , and temperatures used <strong>in</strong> identify<strong>in</strong>g <strong>crossover</strong> effects <strong>in</strong> PPGE and DGEBA. The<br />
methods to determ<strong>in</strong>e T B , T ,andT on are described <strong>in</strong> <strong>the</strong> text. T AG is taken from Ref. 60. The frequency is def<strong>in</strong>ed as (T ).<br />
T g cal<br />
K<br />
T g diel<br />
K m<br />
T B<br />
K<br />
T AG<br />
K<br />
is not affected by this problem, and a s<strong>in</strong>gle curve can be<br />
obta<strong>in</strong>ed that is representative <strong>of</strong> <strong>the</strong> whole temperature behavior.<br />
The temperature dependence is expected to be closely<br />
related to that <strong>of</strong> viscosity. In particular, an <strong>in</strong>verse proportionality<br />
<strong>of</strong> to would be expected <strong>in</strong> <strong>the</strong> hydrodynamic<br />
regime, though examples <strong>of</strong> supercooled liquids are not rare<br />
where a modified relation such as n const holds, with<br />
0n1. 50 Actually, <strong>the</strong> <strong>in</strong>set <strong>of</strong> Fig. 8b shows that a<br />
simple proportionality is verified <strong>in</strong> DGEBA at least above<br />
306 K, where both conductivity and viscosity data are available<br />
for this system. In contrast, a s<strong>in</strong>gle regime does not<br />
describe <strong>the</strong> data <strong>of</strong> PPGE <strong>in</strong>set <strong>of</strong> Fig. 8a. In this case <strong>the</strong><br />
data <strong>in</strong> a log–log representation can be approximated by<br />
two straight l<strong>in</strong>es, correspond<strong>in</strong>g to n0.77 at lower temperature<br />
and n0.94 at higher temperature, cross<strong>in</strong>g around<br />
293–298 K.<br />
The most traditional way <strong>of</strong> plott<strong>in</strong>g relaxation times and<br />
viscosity and conductivity data as a function <strong>of</strong> temperature<br />
is <strong>the</strong> Arrhenius diagram, which magnifies <strong>the</strong> deviation from<br />
<strong>the</strong>rmal activated behavior. On <strong>the</strong> o<strong>the</strong>r hand, a representation<br />
that goes <strong>in</strong>to details <strong>of</strong> <strong>the</strong> temperature dependence and<br />
magnifies deviations from Vogel–Fulcher–Tamman VFT<br />
behavior at <strong>the</strong> same time is given by plott<strong>in</strong>g <strong>the</strong> quantity<br />
d log 10(1/x)/dT 1/2 vs T, <strong>the</strong> so-called Stickel plot, 11<br />
where x is <strong>the</strong> physical quantity usually reported <strong>in</strong> <strong>the</strong><br />
Arrhenius diagram. In <strong>the</strong> Stickel plot a VFT behavior translates<br />
<strong>in</strong>to a l<strong>in</strong>ear behavior. Figure 9 shows that a VFT regime<br />
extend<strong>in</strong>g over a wide temperature range can be certa<strong>in</strong>ly<br />
identified <strong>in</strong> both systems at higher temperature. At <strong>the</strong><br />
same time it demonstrates a clear deviation <strong>of</strong> <strong>the</strong> lowertemperature<br />
data that could at first be approximated by a<br />
VFT equation with a different set <strong>of</strong> parameters. S<strong>in</strong>ce <strong>the</strong>re<br />
is not a sharp but a cont<strong>in</strong>uous change <strong>in</strong> <strong>the</strong> trace <strong>of</strong> <strong>the</strong> data<br />
<strong>in</strong> <strong>the</strong> Stickel plot, a <strong>crossover</strong> temperature T B can be identified<br />
with some difficulty: we located T B where a bend starts<br />
<strong>in</strong> <strong>the</strong> higher temperature data, with a typical uncerta<strong>in</strong>ty <strong>of</strong><br />
about 10 K see Table II. It should be noticed that <strong>in</strong>tr<strong>in</strong>sic<br />
limits affect <strong>the</strong> Stickel procedure—it operates a shr<strong>in</strong>kage <strong>of</strong><br />
several decades <strong>of</strong> dynamical data to a l<strong>in</strong>ear scale proportional<br />
to <strong>the</strong> temperature range, result<strong>in</strong>g <strong>in</strong> a smaller sensitivity<br />
for <strong>the</strong> low-temperature side, where a huge slow<strong>in</strong>g<br />
down <strong>of</strong> <strong>the</strong> <strong>dynamics</strong> occurs <strong>in</strong> few tens <strong>of</strong> degrees—and<br />
different analytical strategies 39,51,52 can be adopted for test<strong>in</strong>g<br />
<strong>the</strong> applicability <strong>of</strong> <strong>the</strong> VFT equation and for identify<strong>in</strong>g<br />
changes <strong>in</strong> <strong>the</strong> temperature dependence <strong>of</strong> relaxation data. 53<br />
It is found that <strong>the</strong> results for <strong>the</strong> lower-temperature range<br />
are ma<strong>in</strong>ly affected, where <strong>the</strong> validity itself <strong>of</strong> <strong>the</strong> VFT<br />
equation is questionable. Anyway, o<strong>the</strong>r procedures confirm<br />
<strong>the</strong> higher-temperature VFT regime <strong>in</strong> our data <strong>the</strong> fitt<strong>in</strong>g<br />
curves for TT B are reported <strong>in</strong> Fig. 9 as straight l<strong>in</strong>es, but<br />
T <br />
K<br />
log 10 <br />
rad s 1 <br />
T on( →0)<br />
K T /T g cal<br />
T on /T g cal<br />
PPGE 2581 258.40.5 105 29310 298 2983 6.2 3915 1.150.02 1.510.03<br />
DGEBA 2551 253.70.5 95 27510 288 2853 6.1 3514 1.120.02 1.380.02<br />
<strong>in</strong>dicate a large variability <strong>in</strong> <strong>the</strong> set <strong>of</strong> VFT parameters describ<strong>in</strong>g<br />
<strong>the</strong> lower-temperature data depend<strong>in</strong>g on <strong>the</strong> data<br />
range fitted and a possible underestimation <strong>of</strong> T B . The best<br />
VFT parameters obta<strong>in</strong>ed for max and <strong>in</strong> <strong>the</strong> high- and<br />
low-temperature <strong>regions</strong> separated by T B are listed <strong>in</strong> Table<br />
III. We observe that <strong>the</strong> set <strong>of</strong> parameters <strong>in</strong> Table III fitt<strong>in</strong>g<br />
<strong>the</strong> data for TT B also fit <strong>the</strong> data up to T B10 K comparably<br />
well.<br />
It must be noticed that <strong>in</strong> a previous <strong>in</strong>vestigation <strong>of</strong><br />
DGEBA see Fig. 5 <strong>of</strong> Ref. 50 we <strong>in</strong>terpreted <strong>the</strong> small<br />
deviation <strong>of</strong> conductivity data from <strong>the</strong> l<strong>in</strong>ear behavior <strong>in</strong> <strong>the</strong><br />
Stickel plot <strong>in</strong> a narrow temperature region 365–380 K as<br />
<strong>the</strong> presence <strong>of</strong> a fur<strong>the</strong>r deviation from a s<strong>in</strong>gle VFT behavior.<br />
The possibility given here Fig. 9b <strong>of</strong> access<strong>in</strong>g much<br />
higher temperatures with viscosity data leads us to exclude<br />
<strong>the</strong> existence <strong>of</strong> such deviation and, with<strong>in</strong> <strong>the</strong> experimental<br />
error, to identify a s<strong>in</strong>gle VFT regime from T B up to <strong>the</strong><br />
highest temperatures.<br />
A fur<strong>the</strong>r source <strong>of</strong> <strong>in</strong>formation about <strong>crossover</strong> effects<br />
along <strong>the</strong> trace <strong>of</strong> <strong>the</strong> dynamic <strong>glass</strong> transition are <strong>the</strong> relaxation<br />
strengths. The fitt<strong>in</strong>g procedure <strong>of</strong> <strong>the</strong> dielectric spectra<br />
gives <strong>the</strong> strengths <strong>of</strong> ma<strong>in</strong> and secondary relaxations as<br />
a function <strong>of</strong> temperature for PPGE and DGEBA, as reported<br />
<strong>in</strong> Figs. 6b and 7b, respectively. They show very similar<br />
trends and comparable absolute values. Below <strong>the</strong> <strong>glass</strong> transition<br />
temperature, <strong>the</strong> -relaxation strength shows a<br />
very small value, systematically decreas<strong>in</strong>g by <strong>in</strong>creas<strong>in</strong>g <strong>the</strong><br />
temperature by a factor <strong>of</strong> 3 over 100 K. In contrast, <strong>the</strong><br />
-relaxation strength shows a relatively small value, but<br />
systematically <strong>in</strong>creases by <strong>in</strong>creas<strong>in</strong>g <strong>the</strong> temperature by<br />
50% over 120 K. Above <strong>the</strong> <strong>glass</strong> transition temperature,<br />
<strong>the</strong> rate <strong>of</strong> <strong>in</strong>crease <strong>of</strong> gets much higher, accompanied<br />
by a rapid decrease <strong>of</strong> <strong>the</strong> -relaxation strength . Figure<br />
7b shows that <strong>in</strong> DGEBA really becomes very small<br />
and l<strong>in</strong>early extrapolates to zero at a f<strong>in</strong>ite onset temperature<br />
→0 for T→T on. In <strong>the</strong> case <strong>of</strong> PPGE <strong>the</strong> data do not<br />
give direct access to <strong>the</strong> onset region, and a larger extrapolation<br />
<strong>of</strong> <strong>the</strong> l<strong>in</strong>ear fit solid l<strong>in</strong>e <strong>in</strong> Fig. 6b is needed to<br />
locate T on .<br />
We end this section by <strong>in</strong>troduc<strong>in</strong>g an additional <strong>in</strong>dicator<br />
<strong>of</strong> dynamic <strong>crossover</strong>s that we have considered <strong>in</strong> <strong>the</strong><br />
present study, <strong>the</strong> cooperativity N , which is <strong>the</strong> number <strong>of</strong><br />
particles per cooperatively rearrang<strong>in</strong>g region 18,24 CRR.<br />
Calorimetric parameters from HCS are used to calculate N <br />
as <strong>the</strong> ratio between <strong>the</strong> volume <strong>of</strong> a CRR, V 3 , and <strong>the</strong><br />
mean volume <strong>of</strong> one molecule, accord<strong>in</strong>g to a Nyquist-type<br />
fluctuation formula 54–56 derived <strong>in</strong> <strong>the</strong> von Laue approach to<br />
<strong>the</strong>rmo<strong>dynamics</strong>: 57<br />
N RT 2 1/c /M 0T 2 RT 2 1/c p/M 0T 2 . 3<br />
Downloaded 14 Nov 2002 to 194.95.63.241. Redistribution subject to AIP license or copyright, see http://ojps.aip.org/jcpo/jcpcr.jsp
J. Chem. Phys., Vol. 117, No. 5, 1 August 2002 <strong>Two</strong> <strong>crossover</strong> <strong>regions</strong> <strong>in</strong> <strong>the</strong> <strong>dynamics</strong> <strong>of</strong> epoxy res<strong>in</strong>s<br />
TABLE III. Parameters <strong>of</strong> Arrhenius fit, (T) 0 exp(Ea /RT), to and secondary relaxation times, and <strong>of</strong> VFT fit, x(T)x 0 expB/(TT0), to ma<strong>in</strong> relaxation time x max , from dielectric spectroscopy and<br />
viscosity ().<br />
Secondary relaxations Ma<strong>in</strong> relaxation<br />
relax. (TT g) relax. (TT g) max TT B or T TT B or T max TT B or T <br />
T0 K<br />
B<br />
K<br />
log 0 s<br />
T0 K<br />
B<br />
K<br />
log 0 Pa s<br />
T0 K<br />
B<br />
K<br />
log 0 s<br />
log 0 s<br />
Ea kcal mol 1 <br />
log 0 s<br />
Ea kcal mol 1 <br />
PPGE 6.670.15 14.70.2 11.30.2 14.60.3 12.20.1 80030 2401 3.830.01 7847 239.70.4 15.70.2 18160 2041<br />
DGEBA 6.60.1 14.350.13 11.380.08 14.780.09 12.20.1 72020 234.40.8 3.800.02 7176 234.20.3 18.00.7 2060180 2092<br />
FIG. 9. Stickel plot „i.e., d log 10(1/x)/dT 1/2 vs T… for a PPGE and b<br />
DGEBA, obta<strong>in</strong>ed from x max , , and . The symbols are expla<strong>in</strong>ed <strong>in</strong><br />
<strong>the</strong> legend. The straight l<strong>in</strong>e is a VFT fit to <strong>the</strong> high-temperature data.<br />
Arrows <strong>in</strong>dicate <strong>the</strong> temperature <strong>of</strong> bend<strong>in</strong>g, T B , and <strong>the</strong> temperature, T on ,<br />
where <strong>the</strong> dielectric strength tends to zero.<br />
In this formula, <strong>the</strong> isochoric specific heat c v is approximated<br />
by <strong>the</strong> isobaric specific heat c p , and (1/c p) is calculated<br />
as (1/c p)1/c p,<strong>glass</strong>1/c p,liquid with c p,<strong>glass</strong> and<br />
c p,liquid be<strong>in</strong>g <strong>the</strong> specific heat values for <strong>the</strong> <strong>glass</strong> and <strong>the</strong><br />
liquid at <strong>the</strong> dynamic <strong>glass</strong> temperature T from a tangent<br />
construction Fig. 3c. The average temperature fluctuation<br />
<strong>of</strong> a CRR, T, is determ<strong>in</strong>ed as <strong>the</strong> Gaussian dispersion <strong>of</strong><br />
c p(T). 55 M 0 is <strong>the</strong> molecular weight and R <strong>the</strong> molar gas<br />
constant. The temperature dependence <strong>of</strong> cooperativity as<br />
obta<strong>in</strong>ed from Eq. 3 is presented <strong>in</strong> Fig. 10. It should be<br />
noted that o<strong>the</strong>r approaches produce different expressions<br />
and yield significantly different estimates for <strong>the</strong> size <strong>of</strong> <strong>the</strong><br />
CRR. 58,59<br />
IV. DISCUSSION<br />
2443<br />
The above-reported results show that our epoxy res<strong>in</strong>s<br />
have a rich relaxation map characterized by, at least, <strong>the</strong><br />
ma<strong>in</strong> (a,) transition and two secondary processes labeled <br />
and . In this section two <strong>crossover</strong> <strong>regions</strong> will be recognized,<br />
somehow related to <strong>the</strong> and processes and called<br />
- and -<strong>crossover</strong> <strong>regions</strong>. The follow<strong>in</strong>g discussion will<br />
also try to give an answer to <strong>the</strong> two questions A and B<br />
asked at <strong>the</strong> end <strong>of</strong> <strong>the</strong> Introduction, i.e., which <strong>of</strong> <strong>the</strong> <strong>crossover</strong><br />
properties ii–v listed <strong>in</strong> <strong>the</strong> Introduction can be observed<br />
<strong>in</strong> <strong>the</strong> - and -<strong>crossover</strong> region, and what is <strong>the</strong><br />
character <strong>of</strong> that part <strong>of</strong> <strong>the</strong> ma<strong>in</strong> transition between <strong>the</strong> two<br />
<strong>crossover</strong>s. We will start with PPGE. The comparison with<br />
DGEBA and o<strong>the</strong>r systems with two secondary relaxations<br />
will be delegated to <strong>the</strong> last two subsections E and F.<br />
Downloaded 14 Nov 2002 to 194.95.63.241. Redistribution subject to AIP license or copyright, see http://ojps.aip.org/jcpo/jcpcr.jsp
2444 J. Chem. Phys., Vol. 117, No. 5, 1 August 2002 Corezzi et al.<br />
FIG. 10. Temperature-dependent cooperativity for PPGE and DGEBA. The<br />
l<strong>in</strong>es are fits to <strong>the</strong> data us<strong>in</strong>g Eq. 4. The Vogel temperature PPGE: T0 214 K; DGEBA: T0209 K was fixed and <strong>the</strong> A value was varied systematically<br />
to f<strong>in</strong>d <strong>the</strong> optimal fit bold l<strong>in</strong>e and <strong>the</strong> correspond<strong>in</strong>g cross-<br />
c (1)<br />
over temperature PPGE: A5.3, Ton327 K, Ton 309 K; DGEBA: A<br />
c (1)<br />
5.5, Ton325 K, Ton 306 K. The th<strong>in</strong> l<strong>in</strong>es are shown to give an impression<br />
<strong>of</strong> adjustments with different A values and <strong>the</strong>ir compatibility with<br />
(1)<br />
data. Correspond<strong>in</strong>g Ton are given <strong>in</strong> <strong>the</strong> legend. The straight l<strong>in</strong>es are l<strong>in</strong>ear<br />
(1) (1)<br />
fits to <strong>the</strong> data PPGE: Ton 296 K; DGEBA: Ton 291 K. Typical errors<br />
are <strong>in</strong>dicated.<br />
A. -<strong>crossover</strong> region<br />
Referr<strong>in</strong>g to <strong>the</strong> Arrhenius diagram and to <strong>the</strong> dielectric<br />
<strong>in</strong>tensity for PPGE Fig. 6, we f<strong>in</strong>d <strong>in</strong> <strong>the</strong> region where<br />
<strong>the</strong> relaxation times <strong>of</strong> ma<strong>in</strong> transition and relaxation approach<br />
each o<strong>the</strong>r, two properties that are typical <strong>of</strong> scenario<br />
I described <strong>in</strong> <strong>the</strong> Introduction, namely <strong>the</strong> onset <strong>of</strong> <strong>the</strong> <br />
process with l<strong>in</strong>early <strong>in</strong>creas<strong>in</strong>g dielectric <strong>in</strong>tensity property<br />
ii <strong>of</strong> <strong>the</strong> Introduction and <strong>the</strong> presence <strong>of</strong> a frequency gap<br />
<strong>in</strong> <strong>the</strong> Arrhenius plot between <strong>the</strong> extrapolated trace <strong>of</strong> <strong>the</strong> <br />
process and <strong>the</strong> cont<strong>in</strong>uous trace <strong>of</strong> <strong>the</strong> a and processes.<br />
We refer to <strong>the</strong> region where <strong>the</strong> <strong>in</strong>tensity extrapolates to<br />
zero and <strong>the</strong> process cont<strong>in</strong>ues <strong>in</strong>to <strong>the</strong> a process <strong>of</strong> <strong>the</strong><br />
ma<strong>in</strong> transition as <strong>the</strong> -<strong>crossover</strong> region. The onset extrapolation<br />
for is ra<strong>the</strong>r long, about 50 K, but <strong>the</strong> l<strong>in</strong>ear trend<br />
is well documented <strong>in</strong> a large temperature <strong>in</strong>terval below 330<br />
K. The onset <strong>of</strong> <strong>the</strong> process is estimated at „T on391 K,<br />
log 10( onrad/s)10…, see Table II, and <strong>the</strong> frequency gap<br />
to <strong>the</strong> extrapolated process at T on is about log 10()1<br />
decade, with a large uncerta<strong>in</strong>ty. The extrapolation <strong>of</strong> <strong>the</strong> <br />
trace <strong>in</strong> <strong>the</strong> Arrhenius diagram Fig. 11 above <strong>the</strong> <strong>glass</strong> transition<br />
temperature is complicated by two th<strong>in</strong>gs: a significant<br />
curvature and a decl<strong>in</strong><strong>in</strong>g <strong>of</strong> <strong>the</strong> trace below <strong>the</strong> l<strong>in</strong>ear<br />
extrapolation from temperatures lower than T g . We recall<br />
that both effects <strong>of</strong> <strong>the</strong> trace are not an artifact from <strong>the</strong><br />
data evaluation s<strong>in</strong>ce is large and <strong>the</strong> trace <strong>of</strong> <strong>the</strong> ma<strong>in</strong><br />
transition <strong>in</strong> <strong>the</strong> Arrhenius diagram is two or more frequency<br />
decades below <strong>the</strong> measured trace.<br />
Concern<strong>in</strong>g c p(T) data from HCS, given <strong>in</strong> <strong>in</strong>set <strong>of</strong><br />
Figs. 6b and 7b for comparison with dielectric data, <strong>the</strong>y<br />
FIG. 11. Schematic sketch <strong>of</strong> <strong>the</strong> Arrhenius diagram near <strong>the</strong> -<strong>crossover</strong><br />
region.<br />
<strong>in</strong>dicate a behavior similar to (T). Actually, we have no<br />
physical arguments for a l<strong>in</strong>ear extrapolation <strong>of</strong> c p and, if<br />
any, such a large extrapolation does not give a reliable value<br />
for <strong>the</strong> temperature where c p→0. Here we limit ourselves<br />
to note that <strong>the</strong> temperature behavior <strong>of</strong> c p is consistent<br />
with go<strong>in</strong>g l<strong>in</strong>early to zero around <strong>the</strong> temperature T on determ<strong>in</strong>ed<br />
from dielectric data.<br />
Unexpectedly, dielectric relaxation times and viscosity<br />
do not show any evidence <strong>of</strong> a Stickel bend property iii <strong>of</strong><br />
<strong>the</strong> Introduction at <strong>the</strong> <strong>crossover</strong> Fig. 9, i.e., <strong>the</strong> temperature<br />
dependence <strong>of</strong> dielectric relaxation time and viscosity<br />
does not reflect <strong>the</strong> change from <strong>the</strong> a trace to <strong>the</strong> trace<br />
occurr<strong>in</strong>g with a one decade gap at T on . No evidence is also<br />
given for a separation <strong>of</strong> <strong>the</strong> <strong>in</strong>dividual temperature dependences<br />
<strong>of</strong> different transport properties, such as electric conductivity<br />
and viscosity, and for an Adam–Gibbs bend 60<br />
properties iv and v <strong>of</strong> <strong>the</strong> Introduction.<br />
B. -<strong>crossover</strong> region<br />
Referr<strong>in</strong>g aga<strong>in</strong> to <strong>the</strong> Arrhenius diagram and to <strong>the</strong> dielectric<br />
<strong>in</strong>tensities <strong>in</strong> Fig. 6, we f<strong>in</strong>d now <strong>in</strong> <strong>the</strong> region where<br />
<strong>the</strong> relaxation times <strong>of</strong> ma<strong>in</strong> transition and relaxation approach<br />
each o<strong>the</strong>r, two properties <strong>of</strong> scenario II: <strong>the</strong> cont<strong>in</strong>uous<br />
trace <strong>of</strong> <strong>the</strong> ma<strong>in</strong> transition and, second, <strong>the</strong> weak <br />
relaxation, which runs <strong>in</strong>to <strong>the</strong> ma<strong>in</strong> transition with a considerable<br />
‘‘angle’’ <strong>in</strong> <strong>the</strong> Arrhenius diagram. We call this region<br />
<strong>the</strong> -<strong>crossover</strong> region. The def<strong>in</strong>ition <strong>of</strong> a temperature<br />
where <strong>the</strong> separation <strong>of</strong> time scales between ma<strong>in</strong> and secondary<br />
relaxation occurs is not an unambiguous operation,<br />
s<strong>in</strong>ce reflects <strong>the</strong> mentioned difficulty, <strong>in</strong> <strong>the</strong>ory and practice,<br />
<strong>of</strong> analyz<strong>in</strong>g <strong>the</strong> spectra <strong>in</strong> <strong>regions</strong> <strong>of</strong> strong overlap <strong>of</strong> <strong>the</strong><br />
relaxation peaks. We refer to <strong>the</strong> splitt<strong>in</strong>g temperature T <br />
as <strong>the</strong> temperature where <strong>the</strong> l<strong>in</strong>early extrapolated Arrhenius<br />
behavior <strong>of</strong> <strong>in</strong>tersects <strong>the</strong> trace. In <strong>the</strong> extrapolation we<br />
obta<strong>in</strong> T 298 K and log (rad/s)6.2 Table II. Both <strong>the</strong><br />
dielectric and <strong>the</strong> shear measurements <strong>of</strong> <strong>the</strong> ma<strong>in</strong> transition<br />
show a significant Stickel bend at <strong>the</strong> <strong>crossover</strong> property<br />
iii, Fig. 9. The Vogel temperatures are T 0(TT )<br />
240 K and T 0(TT )214 K, higher for <strong>the</strong> highesttemperature<br />
regime, <strong>in</strong> co<strong>in</strong>cidence with <strong>the</strong> rule mentioned<br />
<strong>in</strong> <strong>the</strong> Introduction. There is an <strong>in</strong>dication for start <strong>of</strong> separation<br />
<strong>of</strong> <strong>the</strong> <strong>in</strong>dividual temperature dependences <strong>of</strong> viscosity<br />
Downloaded 14 Nov 2002 to 194.95.63.241. Redistribution subject to AIP license or copyright, see http://ojps.aip.org/jcpo/jcpcr.jsp
J. Chem. Phys., Vol. 117, No. 5, 1 August 2002 <strong>Two</strong> <strong>crossover</strong> <strong>regions</strong> <strong>in</strong> <strong>the</strong> <strong>dynamics</strong> <strong>of</strong> epoxy res<strong>in</strong>s<br />
TABLE IV. Comparison <strong>of</strong> -<strong>crossover</strong> and -<strong>crossover</strong> properties for<br />
PPGE.<br />
Property a <strong>crossover</strong> <strong>crossover</strong><br />
Onset (→0) <strong>of</strong> <strong>the</strong> lowtemperature<br />
process ii<br />
Yes No<br />
Frequency gap Yes No<br />
Scenario I II<br />
Stickel bend iii No Yes<br />
Decoupl<strong>in</strong>g <strong>of</strong> and iv ? Yes<br />
Adam–Gibbs bend v ? Yes Ref. 60<br />
a<br />
The roman numerals <strong>in</strong> paren<strong>the</strong>ses are related to <strong>the</strong> properties ii–v <strong>of</strong><br />
<strong>the</strong> Introduction.<br />
and electric conductivity <strong>in</strong> <strong>the</strong> -<strong>crossover</strong> region property<br />
iv, Fig. 8. Calorimetric data published elsewhere 60 <strong>in</strong>dicate<br />
a weak Adam–Gibbs bend <strong>in</strong> <strong>the</strong> same region property v;<br />
<strong>in</strong> Table II, T AG is <strong>the</strong> temperature above which <strong>the</strong> deviation<br />
from <strong>the</strong> Adam–Gibbs relation, log (S cT) 1 , becomes appreciable.<br />
The discussion <strong>of</strong> Secs. IV A and IV B is summarized<br />
<strong>in</strong> Table IV.<br />
C. process below <strong>the</strong> <strong>crossover</strong><br />
For <strong>the</strong> discussion <strong>of</strong> <strong>the</strong> process below <strong>the</strong> <strong>crossover</strong><br />
we use <strong>the</strong> experimental cooperativity N (T) obta<strong>in</strong>ed<br />
from <strong>the</strong> 3-method calorimetry Fig. 10. A fair representation<br />
<strong>of</strong> its temperature dependence is usually 28,34,61<br />
1/2<br />
N A1x/x, 4<br />
with x a reduced temperature between Vogel temperature<br />
(x0) and a formal cooperativity-onset temperature (x<br />
1/2<br />
→1,N →0),<br />
c<br />
xTT 0/T onT0,<br />
5<br />
where A is a constant typically between 2 and 15, 61 T0 <strong>the</strong><br />
c<br />
Vogel temperature, and Ton <strong>the</strong> cooperativity-onset temperature.<br />
For PPGE, Fig. 10 conta<strong>in</strong>s N data for temperatures<br />
between T264 K and 283 K, and <strong>the</strong> -<strong>crossover</strong> region is<br />
located around T298 K. In extrapolat<strong>in</strong>g Eq. 4 to f<strong>in</strong>d <strong>the</strong><br />
cooperativity-onset temperature we take <strong>the</strong> Vogel temperature<br />
T0 from <strong>the</strong> VFT parameters for <strong>the</strong> low- temperature<br />
part <strong>of</strong> <strong>the</strong> trace Table II, T0214 K. Us<strong>in</strong>g Eq. 4, we<br />
c<br />
obta<strong>in</strong> <strong>the</strong> best fit <strong>of</strong> <strong>the</strong> data <strong>of</strong> Fig. 10 for A5.3 and Ton 327 K. This gives a more realistic onset temperature cor-<br />
(1)<br />
respond<strong>in</strong>g to N1, T(N 1)T on 309 K Fig. 10.<br />
Consider<strong>in</strong>g <strong>the</strong> large uncerta<strong>in</strong>ty affect<strong>in</strong>g N(30%), a<br />
good fit <strong>of</strong> <strong>the</strong> data is still obta<strong>in</strong>ed with A7.5, which gives<br />
(1)<br />
Ton 299 K. This value is not far from that which can be<br />
obta<strong>in</strong>ed from a l<strong>in</strong>ear extrapolation <strong>of</strong> <strong>the</strong> same data, giv<strong>in</strong>g<br />
(1)<br />
Ton 296 K. These temperature values <strong>in</strong>dicate that <strong>the</strong><br />
(1)<br />
cooperativity-onset temperature Ton for PPGE as def<strong>in</strong>ed by<br />
N→1 is <strong>in</strong>side, or slightly above, <strong>the</strong> -<strong>crossover</strong> region. 62<br />
D. Of which type is <strong>the</strong> ma<strong>in</strong> process between and<br />
<strong>crossover</strong>s, a or ?<br />
We come now to <strong>the</strong> question B asked at <strong>the</strong> end <strong>of</strong> <strong>the</strong><br />
Introduction: What is <strong>the</strong> character <strong>of</strong> that part <strong>of</strong> <strong>the</strong> ma<strong>in</strong><br />
transition between <strong>the</strong> two <strong>crossover</strong> <strong>regions</strong>? In general, for<br />
2445<br />
liquids <strong>of</strong> moderate molecular and structural complexity<br />
characterized by a s<strong>in</strong>gle <strong>crossover</strong> region, 24,28 <strong>the</strong> ma<strong>in</strong> transition<br />
can be characterized as follows.<br />
Above <strong>the</strong> <strong>crossover</strong> region we have <strong>the</strong> a process with<br />
<strong>the</strong> higher Vogel temperature when fitted by a VFT equation.<br />
In <strong>the</strong> molecular picture discussed <strong>in</strong> Ref. 24, <strong>the</strong> correspond<strong>in</strong>g<br />
diffusion can be described as escap<strong>in</strong>g <strong>of</strong> <strong>the</strong> particle<br />
from a cage 40 formed by <strong>the</strong> nearest neighbors. The<br />
cooperativity is <strong>of</strong> order N 1 when determ<strong>in</strong>ed by Eq. 3<br />
and decreases with higher temperatures. Such small cooperativities<br />
are unexpected and may be expla<strong>in</strong>ed by an extraord<strong>in</strong>ary<br />
concentration <strong>of</strong> free volume as generated by <strong>the</strong><br />
Lévy distribution describ<strong>in</strong>g <strong>the</strong> escap<strong>in</strong>g process. We may<br />
th<strong>in</strong>k about a ‘‘cage door’’ <strong>of</strong> size <strong>of</strong> about one particle temporarily<br />
opened by this concentration <strong>of</strong> free volume. 24<br />
Below <strong>the</strong> <strong>crossover</strong> region we have <strong>the</strong> process with<br />
<strong>the</strong> lower Vogel temperature. The spatial aspect <strong>of</strong> its dynamic<br />
heterogeneity may be described 24 by an island <strong>of</strong> high<br />
mobility 63 assisted by a cooperativity shell <strong>of</strong> low mobility.<br />
The particle diffusion may be considered as generated by a<br />
diffusion <strong>of</strong> this island Glarum defect diffusion 64 . This island<br />
<strong>of</strong> mobility may also be expla<strong>in</strong>ed by an extraord<strong>in</strong>ary<br />
concentration <strong>of</strong> free volume from a Lévy distribution. The<br />
spatial scale, however, is larger than that for <strong>the</strong> hightemperature<br />
a process and may generate sufficient free space<br />
for a secondary process at <strong>the</strong> island. In this molecular picture,<br />
<strong>the</strong> CRR as a representative subsystem for <strong>the</strong> ma<strong>in</strong><br />
transition consists <strong>of</strong> two parts: <strong>the</strong> island <strong>of</strong> mobility and <strong>the</strong><br />
cooperativity shell; <strong>the</strong> mobility contrast between <strong>the</strong>se parts<br />
is responsible for <strong>the</strong> dynamic heterogeneity <strong>of</strong> <strong>the</strong> process.<br />
The cooperativity is <strong>the</strong>n <strong>the</strong> number <strong>of</strong> particles per<br />
CRR; it <strong>in</strong>creases sharply with low temperatures and reaches<br />
values <strong>of</strong> order N 100 some 50 K below <strong>the</strong> <strong>crossover</strong><br />
region.<br />
S<strong>in</strong>ce we have two <strong>crossover</strong> <strong>regions</strong> <strong>in</strong> PPGE, <strong>the</strong> question<br />
arises whe<strong>the</strong>r <strong>the</strong> ma<strong>in</strong> process between <strong>the</strong> two <strong>crossover</strong>s<br />
is more an a process <strong>in</strong> which case it will be called <strong>the</strong><br />
a process, because it is above <strong>the</strong> <strong>crossover</strong>, or it is more<br />
an process <strong>in</strong> which case it will be called <strong>the</strong> process,<br />
because it is below <strong>the</strong> <strong>crossover</strong>. Reflect<strong>in</strong>g <strong>the</strong> discussion<br />
<strong>in</strong> <strong>the</strong> previous subsections, Table IV, and <strong>the</strong> above criteria,<br />
we obta<strong>in</strong> <strong>the</strong> follow<strong>in</strong>g <strong>in</strong>dications.<br />
In favor <strong>of</strong> an a process, we have <strong>the</strong> small cooperativity<br />
N 1 obta<strong>in</strong>ed from <strong>the</strong> extrapolation at temperatures<br />
higher than <strong>the</strong> <strong>crossover</strong>. This result is deduced upon <strong>the</strong><br />
condition that <strong>the</strong>re is no N <strong>in</strong>crease with <strong>in</strong>creas<strong>in</strong>g temperature<br />
as observed for 19 systems studied so far by heat<br />
capacity spectroscopy 28 apart from <strong>the</strong> <strong>in</strong>dication <strong>of</strong> a weak<br />
N (T) irregularity <strong>in</strong> <strong>the</strong> -<strong>crossover</strong> region <strong>of</strong> ortho-cresyl<br />
glycidyl e<strong>the</strong>r 65 . O<strong>the</strong>r arguments for an a process are <strong>the</strong><br />
location above a Stickel bend, above <strong>the</strong> start <strong>of</strong> a - decoupl<strong>in</strong>g,<br />
and above a bend <strong>in</strong> <strong>the</strong> Adam–Gibbs plot.<br />
In favor <strong>of</strong> an process, we have <strong>the</strong> occurrence at<br />
higher temperature <strong>of</strong> a dielectric onset with frequency gap,<br />
i.e., <strong>the</strong> location below a <strong>crossover</strong> region <strong>of</strong> <strong>the</strong> type described<br />
as scenario I.<br />
Summariz<strong>in</strong>g this subsection, we f<strong>in</strong>d more arguments<br />
suggest<strong>in</strong>g that <strong>the</strong> ma<strong>in</strong> process between <strong>the</strong> and <strong>crossover</strong>s<br />
is an a process hence, a process. Accord<strong>in</strong>gly, we<br />
Downloaded 14 Nov 2002 to 194.95.63.241. Redistribution subject to AIP license or copyright, see http://ojps.aip.org/jcpo/jcpcr.jsp
2446 J. Chem. Phys., Vol. 117, No. 5, 1 August 2002 Corezzi et al.<br />
should properly call <strong>the</strong> dielectric onset observed <strong>in</strong> <strong>the</strong><br />
-<strong>crossover</strong> region <strong>the</strong> (a,) onset. However, <strong>the</strong> <strong>in</strong>tensity<br />
onset and frequency gap <strong>in</strong> <strong>the</strong> -<strong>crossover</strong> region <strong>in</strong>dicate<br />
that <strong>the</strong>re is, <strong>in</strong> PPGE, a qualitative difference between <strong>the</strong><br />
a process and <strong>the</strong> high-temperature a process, i.e., below<br />
and above <strong>the</strong> <strong>crossover</strong>. In particular, <strong>the</strong> presence <strong>of</strong> a<br />
frequency gap between <strong>the</strong> extrapolated a and a processes<br />
at <strong>the</strong> <strong>crossover</strong> could be <strong>in</strong>terpreted, follow<strong>in</strong>g general<br />
scal<strong>in</strong>g pr<strong>in</strong>ciples, as an <strong>in</strong>dication <strong>of</strong> a length scale for <strong>the</strong><br />
a mode that is larger than that <strong>of</strong> <strong>the</strong> a modes emerg<strong>in</strong>g<br />
from <strong>the</strong> process.<br />
E. Comparison between PPGE and DGEBA<br />
The overall behavior <strong>of</strong> both epoxy res<strong>in</strong>s is <strong>the</strong> same<br />
Figs. 6, 7, 9, and 10: We f<strong>in</strong>d two <strong>crossover</strong> <strong>regions</strong> separated<br />
by a frequency difference <strong>of</strong> about four decades. The <br />
<strong>crossover</strong> seems to conform to scenario I onset, <strong>the</strong> <br />
<strong>crossover</strong> belongs to scenario II. The characteristic temperatures<br />
<strong>of</strong> <strong>crossover</strong> effects <strong>in</strong> DGEBA are compiled <strong>in</strong> Table II<br />
toge<strong>the</strong>r with those for PPGE. Unlike PPGE, <strong>in</strong> DGEBA<br />
low-temperature conductivity data for assess<strong>in</strong>g <strong>the</strong> presence<br />
<strong>of</strong> a - bend <strong>in</strong>dicat<strong>in</strong>g <strong>the</strong> start <strong>of</strong> different temperature<br />
dependences for <strong>the</strong> different transport activities are not<br />
available, and <strong>the</strong> weak bend <strong>of</strong> <strong>the</strong> dielectric -process <strong>in</strong>tensity<br />
(T) at <strong>the</strong> -<strong>crossover</strong> temperature is hardly perceived.<br />
From Fig. 10, <strong>the</strong> cooperativity <strong>of</strong> <strong>the</strong> process,<br />
extrapolated to <strong>the</strong> -<strong>crossover</strong> temperature, is about N 5 for DGEBA, i.e., a bit larger than that for PPGE. The<br />
1/2 (1)<br />
extrapolation <strong>of</strong> N gives N1 at Ton 291 K for <strong>the</strong><br />
(1)<br />
l<strong>in</strong>ear fit, and Ton 306 K for <strong>the</strong> best adjustment <strong>of</strong> Eq. 4<br />
c<br />
with T0209 K A5.5 and Ton325 K. The cooperativity<br />
N at <strong>the</strong> <strong>glass</strong> transition temperature, <strong>in</strong>dependently determ<strong>in</strong>ed<br />
from DSC measurements is N(T g)7520 for<br />
PPGE and N(T g)11030 for DGEBA. 66 These values<br />
are consistent with<strong>in</strong> <strong>the</strong> experimental errors with those extrapolated<br />
accord<strong>in</strong>g to Eq. 4, and give comparable values<br />
for <strong>the</strong> cooperativity length at <strong>the</strong> <strong>glass</strong> transition temperature<br />
for both PPGE and DGEBA (T g)3.30.3 and<br />
3.80.4 nm, respectively.<br />
As recalled <strong>in</strong> Sec. III, <strong>the</strong> determ<strong>in</strong>ation <strong>of</strong> T0 as <strong>the</strong><br />
temperature where <strong>the</strong> trace tends to diverge is not unambiguous<br />
<strong>in</strong> fact, it ranges from <strong>the</strong> values reported <strong>in</strong> Table<br />
III to values more than 10 K lower. It is worth not<strong>in</strong>g that<br />
despite this large uncerta<strong>in</strong>ty <strong>the</strong> best adjustments <strong>of</strong> Eq. 4<br />
with different values <strong>of</strong> T0 do not entail changes <strong>in</strong> <strong>the</strong> ex-<br />
(1)<br />
trapolated values <strong>of</strong> Ton and N(T g) that are significant<br />
with<strong>in</strong> <strong>the</strong> experimental errors.<br />
Note that <strong>the</strong> frequency–temperature position <strong>of</strong> and <br />
relaxations <strong>in</strong> PPGE and DGEBA are nearly identical Table<br />
III. This <strong>in</strong>dicates that <strong>the</strong> molecular mechanism <strong>of</strong> <strong>the</strong> secondary<br />
relaxations <strong>in</strong> both substances is similar. This aspect<br />
and <strong>the</strong> fact that <strong>the</strong>re are two pronounced secondary processes<br />
<strong>in</strong> cross-l<strong>in</strong>ked DGEBA systems 67,68 may be <strong>the</strong> start<strong>in</strong>g<br />
po<strong>in</strong>t <strong>of</strong> fur<strong>the</strong>r studies on this topic.<br />
F. Comparison with o<strong>the</strong>r substances<br />
There are several substances with two secondary relaxations<br />
<strong>in</strong>vestigated <strong>in</strong> <strong>the</strong> literature. 69–75 However, only <strong>in</strong> a<br />
FIG. 12. Comparison <strong>of</strong> <strong>the</strong> Arrhenius diagrams for <strong>the</strong> epoxy res<strong>in</strong>s this<br />
paper and poly-caprolactone from literature Ref. 73 schematically.<br />
very few <strong>of</strong> <strong>the</strong>se samples do both secondary relaxations approach<br />
<strong>the</strong> ma<strong>in</strong> transition <strong>in</strong>side <strong>the</strong> experimentally accessible<br />
frequency w<strong>in</strong>dow below 10 GHz and is <strong>in</strong>formation<br />
about dielectric strengths available. We will discuss below a<br />
few previously <strong>in</strong>vestigated samples and compare <strong>the</strong>ir behavior<br />
with our epoxy res<strong>in</strong>s.<br />
Schematic Arrhenius diagrams for poly-caprolactone<br />
from Fig. 9 <strong>of</strong> Ref. 73 and for our epoxy res<strong>in</strong>s Figs. 6 and<br />
7 show significant differences Fig. 12. For polycaprolactone<br />
<strong>the</strong> dielectric onset co<strong>in</strong>cides with <strong>the</strong> <br />
merg<strong>in</strong>g, and <strong>the</strong> frequency gap to <strong>the</strong> cont<strong>in</strong>uous process<br />
is about two decades. We may imag<strong>in</strong>e, purely phenomenologically,<br />
that <strong>the</strong> poly-caprolactone scenario would<br />
emerge from our epoxy res<strong>in</strong> situation when <strong>the</strong> -process<br />
frequency near <strong>the</strong> onset is about two frequency decades<br />
lower. Then <strong>the</strong> two <strong>crossover</strong> <strong>regions</strong> <strong>of</strong> <strong>the</strong> epoxy res<strong>in</strong>s<br />
would co<strong>in</strong>cide and <strong>the</strong> a process between <strong>the</strong> two <strong>crossover</strong>s<br />
would disappear. For poly-caprolactone <strong>the</strong> process<br />
deviates less from <strong>the</strong> l<strong>in</strong>ear extrapolation, but a small<br />
sigmoidal shape <strong>of</strong> <strong>the</strong> trace <strong>in</strong> <strong>the</strong> Arrhenius diagram<br />
seems also to occur. As a whole, it seems that <strong>the</strong> difference<br />
between <strong>the</strong> two diagrams <strong>in</strong> Fig. 12 is caused by <strong>the</strong> difference<br />
<strong>in</strong> <strong>the</strong> <strong>crossover</strong> frequency.<br />
A comparison <strong>of</strong> our data for PPGE and DGEBA with<br />
those for ano<strong>the</strong>r epoxy res<strong>in</strong> with two secondary relaxations,<br />
ortho-cresyl glycidyl e<strong>the</strong>r 65 also <strong>in</strong>dicates differences.<br />
There is no dielectric onset <strong>in</strong> <strong>the</strong> -<strong>crossover</strong> region,<br />
but <strong>the</strong> as well as <strong>crossover</strong> is accompanied by a<br />
Stickel bend, i.e., a change <strong>in</strong> <strong>the</strong> temperature dependence <strong>of</strong><br />
<strong>the</strong> ma<strong>in</strong> relaxation time. In contrast, <strong>the</strong> data for triphenylolmethane<br />
triglycidyl e<strong>the</strong>r 74 <strong>in</strong>dicate, as far as data are<br />
available <strong>in</strong> <strong>the</strong> temperature range below 1.22T g , many similarities<br />
with <strong>the</strong> features <strong>of</strong> PPGE and DGEBA.<br />
Ano<strong>the</strong>r class <strong>of</strong> substances with two secondary relaxations<br />
are <strong>the</strong> polyn-alkyl methacrylates. Due to <strong>the</strong> high<br />
frequency <strong>of</strong> <strong>the</strong> relaxation <strong>in</strong> samples with high molecular<br />
weight, less is known about <strong>the</strong> details <strong>of</strong> a possible <strong>crossover</strong>.<br />
However, for short polyn-butyl methacrylate oligomers<br />
<strong>the</strong> -relaxation <strong>in</strong>tensity <strong>in</strong>creases with decreas<strong>in</strong>g<br />
cha<strong>in</strong> length. 75,76 This is also reflected by an <strong>in</strong>crease <strong>of</strong> <strong>the</strong><br />
calorimetric <strong>in</strong>tensity and <strong>the</strong> cooperativity near T g , <strong>in</strong>dicat<strong>in</strong>g<br />
relations between local <strong>dynamics</strong> and ma<strong>in</strong> transition<br />
besides those <strong>in</strong> <strong>the</strong> well-<strong>in</strong>vestigated -<strong>crossover</strong><br />
region. 7,22,43<br />
Downloaded 14 Nov 2002 to 194.95.63.241. Redistribution subject to AIP license or copyright, see http://ojps.aip.org/jcpo/jcpcr.jsp
J. Chem. Phys., Vol. 117, No. 5, 1 August 2002 <strong>Two</strong> <strong>crossover</strong> <strong>regions</strong> <strong>in</strong> <strong>the</strong> <strong>dynamics</strong> <strong>of</strong> epoxy res<strong>in</strong>s<br />
V. CONCLUSIONS<br />
The dynamic <strong>glass</strong> transition <strong>of</strong> PPGE and DGEBA has<br />
been studied by means <strong>of</strong> broadband dielectric spectroscopy,<br />
heat capacity spectroscopy 3 method, and viscosimetry.<br />
<strong>Two</strong> well-separated <strong>crossover</strong> <strong>regions</strong> <strong>crossover</strong> and <br />
<strong>crossover</strong> have been identified, around T c()(1.1<br />
1.2)T g , c()10 6 s, and T c()(1.41.5)T g ,<br />
c()10 10 s, respectively.<br />
The <strong>crossover</strong> is characterized by <strong>the</strong> onset <strong>of</strong> <strong>the</strong><br />
(a,) transition, with a relaxation time about one decade<br />
greater than that <strong>of</strong> <strong>the</strong> cont<strong>in</strong>uous trace <strong>of</strong> <strong>the</strong> (a,) processes,<br />
<strong>the</strong> a process be<strong>in</strong>g <strong>the</strong> high-temperature part <strong>of</strong> <strong>the</strong><br />
ma<strong>in</strong> dynamic transition. In <strong>the</strong> <strong>in</strong>termediate-temperature region,<br />
between <strong>the</strong> and <strong>crossover</strong>, <strong>the</strong> ma<strong>in</strong> transition<br />
seems to be characterized by a low cooperativity N 1, and<br />
it has been labeled a for analogies with <strong>the</strong> hightemperature<br />
a process. At lower temperatures, <strong>the</strong> <strong>crossover</strong><br />
is characterized by a cont<strong>in</strong>uous trace <strong>of</strong> <strong>the</strong> ma<strong>in</strong><br />
(a,) transition where <strong>the</strong> <strong>crossover</strong> region is identified by<br />
<strong>the</strong> extrapolation from lower temperatures <strong>of</strong> <strong>the</strong> relaxation<br />
time to <strong>the</strong> ma<strong>in</strong> relaxation time; a Stickel bend <strong>in</strong> <strong>the</strong> trace<br />
<strong>of</strong> <strong>the</strong> (a,) transition with a Vogel temperature T 0 for <strong>the</strong><br />
process which is smaller than that for <strong>the</strong> a process; and<br />
<strong>the</strong> separation <strong>of</strong> <strong>the</strong> <strong>in</strong>dividual temperature dependences <strong>of</strong><br />
different transport properties such as impurity-ion diffusion<br />
coefficient and viscosity breakdown <strong>of</strong> <strong>the</strong> Stokes–E<strong>in</strong>ste<strong>in</strong><br />
law. The comparison <strong>of</strong> dielectric relaxation times with configurational<br />
entropy data from calorimetry shows <strong>the</strong> validity<br />
<strong>of</strong> <strong>the</strong> Adam–Gibbs relation for <strong>the</strong> temperature dependence<br />
<strong>of</strong> <strong>the</strong> relaxation time at temperatures below <strong>the</strong><br />
-<strong>crossover</strong> region. 60 There, cooperativity starts to <strong>in</strong>crease<br />
significantly.<br />
Also <strong>the</strong> secondary relaxations show changes across <strong>the</strong><br />
<strong>glass</strong> transitions. A significant curvature and a lower<strong>in</strong>g <strong>of</strong><br />
<strong>the</strong> trace below <strong>the</strong> l<strong>in</strong>ear extrapolation from temperatures<br />
lower than T g can be clearly observed <strong>in</strong> <strong>the</strong> Arrhenius plot<br />
<strong>of</strong> both PPGE and DGEBA. These effects are not an artifact<br />
<strong>of</strong> <strong>the</strong> data evaluation s<strong>in</strong>ce is large enough and <strong>the</strong><br />
trace <strong>of</strong> <strong>the</strong> ma<strong>in</strong> transition <strong>in</strong> <strong>the</strong> Arrhenius plot is two or<br />
more frequency decades below <strong>the</strong> measured trace. Ano<strong>the</strong>r<br />
<strong>in</strong>terest<strong>in</strong>g feature shown by secondary processes is <strong>the</strong><br />
<strong>in</strong>fluence <strong>of</strong> freez<strong>in</strong>g-<strong>in</strong> on <strong>the</strong> amplitude <strong>of</strong> <strong>the</strong> relaxation<br />
(T), which shows a significant bend at T g . This suggests<br />
<strong>the</strong> existence <strong>of</strong> some <strong>in</strong>tr<strong>in</strong>sic relation between <strong>the</strong><br />
dynamic <strong>glass</strong> transition and secondary relaxations. Temperature<br />
effects on secondary relaxations promise to be important<br />
for a deeper understand<strong>in</strong>g <strong>of</strong> <strong>the</strong> <strong>glass</strong> transition<br />
phenomenon and are currently <strong>the</strong> subject <strong>of</strong> fur<strong>the</strong>r <strong>the</strong>oretical<br />
and experimental effort.<br />
ACKNOWLEDGEMENTS<br />
We thank P. A. Rolla and M. Lucchesi for helpful discussions,<br />
and acknowledge f<strong>in</strong>ancial support from MIUR-<br />
PRIN2000, <strong>the</strong> Deutsche Forschungsgeme<strong>in</strong>schaft DFG <strong>in</strong><br />
particular, S.C. acknowledges <strong>the</strong> SFB 418 support<strong>in</strong>g her<br />
stay <strong>in</strong> Halle and <strong>the</strong> Fonds Chemische Industrie FCI.<br />
2447<br />
1 M. Be<strong>in</strong>er, H. Huth, and K. Schröter, J. Non-Cryst. Solids 279, 126<br />
2001.<br />
2 K. L. Ngai, J. Non-Cryst. Solids 275, 72000.<br />
3 G. Williams, Trans. Faraday Soc. 62, 2091 1966.<br />
4 G. P. Johari and M. Goldste<strong>in</strong>, J. Chem. Phys. 53, 2372 1970.<br />
5 G. P. Johari and M. Goldste<strong>in</strong>, J. Chem. Phys. 55, 4245 1971.<br />
6 G. P. Johari and M. Goldste<strong>in</strong>, J. Chem. Phys. 74, 2034 1970.<br />
7 F. Garwe, A. Schönhals, H. Lockwenz, M. Be<strong>in</strong>er, K. Schröter, and E.<br />
Donth, Macromolecules 29, 247 1996.<br />
8 R. Casal<strong>in</strong>i, D. Fioretto, A. Livi, M. Lucchesi, and P. A. Rolla, Phys. Rev.<br />
B 56, 3016 1997.<br />
9 S. Kahle, J. Korus, E. Hempel, R. Unger, S. Hör<strong>in</strong>g, K. Schröter, and E.<br />
Donth, Macromolecules 30, 7214 1997.<br />
10 F. Stickel, PhD <strong>the</strong>sis, Universität Ma<strong>in</strong>z, Ma<strong>in</strong>z, Germany, 1995.<br />
11 F. Stickel, E. W. Fischer, and R. Richert, J. Chem. Phys. 102, 6251 1995.<br />
12 F. Stickel, E. W. Fischer, and R. Richert, J. Chem. Phys. 104, 2043 1996.<br />
13 C. Hansen, F. Stickel, R. Richert, and E. W. Fischer, J. Chem. Phys. 108,<br />
6408 1998.<br />
14 F. Fujara, B. Geil, H. Sillescu, and G. Fleischer, Z. Phys. B: Condens.<br />
Matter 88, 195 1992.<br />
15 J. H. Magill and D. J. Plazek, J. Chem. Phys. 46, 3757 1967.<br />
16 K. L. Ngai, J. H. Magill, and D. J. Plazek, J. Chem. Phys. 112, 1887<br />
2000.<br />
17 E. Rössler, Phys. Rev. Lett. 65, 1595 1990.<br />
18 G. Adam and J. H. Gibbs, J. Chem. Phys. 43, 1391965.<br />
19 R. Richert and C. A. Angell, J. Chem. Phys. 108, 9016 1998.<br />
20 K. Ngai, Phys. Rev. E 57, 7346 1998.<br />
21 K. L. Ngai, J. Chem. Phys. 111, 3639 1999.<br />
22 M. Be<strong>in</strong>er, S. Kahle, E. Hempel, K. Schröter, and E. Donth, Europhys.<br />
Lett. 44, 321 1998.<br />
23 S. Kahle, K. Schröter, E. Hempel, and E. Donth, J. Chem. Phys. 111, 6462<br />
1999.<br />
24 E. Donth, The Glass Transition. Relaxation Dynamics <strong>in</strong> Liquids and Disordered<br />
Materials Spr<strong>in</strong>ger, Berl<strong>in</strong> 2001.<br />
25 S. S. N. Murthy, J. Chem. Soc., Faraday Trans. 2 85, 5811989.<br />
26 S. S. N. Murthy, J. Mol. Liq. 44, 511989.<br />
27 A. Schönhals, <strong>in</strong> Non Equilibrium Phenomena <strong>in</strong> Supercooled Fluids,<br />
Glasses and Amorphous Materials, edited by M. Giordano, D. Lepor<strong>in</strong>i,<br />
and M. Tosi World Scientific, S<strong>in</strong>gapore 1996, p.210.<br />
28 E. Donth, H. Huth, and M. Be<strong>in</strong>er, J. Phys.: Condens. Matter 13, L451<br />
2001.<br />
29 S. Corezzi, S. Capaccioli, R. Casal<strong>in</strong>i, D. Fioretto, M. Paluch, and P. A.<br />
Rolla, Chem. Phys. Lett. 320, 1132000.<br />
30 W. H. Press, S. A. Teukolsky, W. T. Vetterl<strong>in</strong>g, and B. P. Flannery, Numerical<br />
Recipes Cambridge University Press, Cambridge, 1992.<br />
31 N. O. Birge and S. R. Nagel, Phys. Rev. Lett. 54, 2674 1985.<br />
32 J. Korus, M. Be<strong>in</strong>er, K. Busse, S. Kahle, R. Unger, and E. Donth, Thermochim.<br />
Acta 304Õ305, 991997.<br />
33 H. Huth, M. Be<strong>in</strong>er, S. Weyer, M. Merzlyakov, C. Schick, and E. Donth,<br />
Thermochim. Acta 377, 1132001.<br />
34 H. Huth, M. Be<strong>in</strong>er, and E. Donth, Phys. Rev. B 61, 15092 2000.<br />
35 K. Schröter and E. Donth, J. Chem. Phys. 113, 9101 2000.<br />
36 L. Comez, D. Fioretto, L. Palmieri et al., Phys. Rev. E 60, 3086 1999.<br />
37 M. Be<strong>in</strong>er, J. Korus, H. Lockwenz, K. Schröter, and E. Donth, Macromol-<br />
ecules 29, 5183 1996.<br />
38 P. K. Dixon and S. R. Nagel, Phys. Rev. Lett. 61, 3411988.<br />
39 P. K. Dixon, Phys. Rev. B 42, 8179 1990.<br />
40 W. Götze and L. Sjögren, Rep. Prog. Phys. 55, 2411992.<br />
41 F. Alvarez, A. H<strong>of</strong>fman, A. Alegría, and J. Colmenero, J. Chem. Phys.<br />
105, 432 1996.<br />
42 A. Arbe, D. Richter, J. Colmenero, and B. Farago, Phys. Rev. E 54, 3853<br />
1996.<br />
43 K. Schröter, R. Unger, S. Reissig, F. Garwe, S. Kahle, M. Be<strong>in</strong>er, and E.<br />
Donth, Macromolecules 31, 8966 1998.<br />
44 R. Bergman, F. Alvarez, A. Alegría, and J. Colmenero, J. Chem. Phys.<br />
109, 7546 1998.<br />
45 E. Donth, K. Schröter, and S. Kahle, Phys. Rev. E 60, 1099 1999.<br />
46 A. Arbe, J. Colmenero, D. Gómez, D. Richter, and B. Farago, Phys. Rev.<br />
E 60, 11031999.<br />
47 A. Kudlik, S. Benkh<strong>of</strong>, T. Blochowicz, C. Tschirwitz, and E. Rössler, J.<br />
Mol. Struct. 479, 201 1999.<br />
48 A. Justl, Degree <strong>the</strong>sis, Universität Bayreuth, Bayreuth, Germany, 2000.<br />
49 S. Capaccioli unpublished.<br />
50 S. Corezzi, E. Campani, P. A. Rolla, S. Capaccioli, and D. Fioretto, J.<br />
Downloaded 14 Nov 2002 to 194.95.63.241. Redistribution subject to AIP license or copyright, see http://ojps.aip.org/jcpo/jcpcr.jsp
2448 J. Chem. Phys., Vol. 117, No. 5, 1 August 2002 Corezzi et al.<br />
Chem. Phys. 111, 9343 1999. In that work we called relaxation what is<br />
labeled here relaxation.<br />
51 H. Z. Cumm<strong>in</strong>s, J. Hernandez, W. M. Du, and G. Li, Phys. Rev. Lett. 73,<br />
2935 1994.<br />
52 A. Schönhals, F. Kremer, A. H<strong>of</strong>mann, E. W. Fischer, and E. Schlosser,<br />
Phys. Rev. Lett. 70, 3459 1993.<br />
53 For a discussion <strong>of</strong> <strong>the</strong> problems <strong>in</strong>volved <strong>in</strong> assess<strong>in</strong>g data fitt<strong>in</strong>g, see C.<br />
A. Angell, K. L. Ngai, G. B. McKenna, P. F. McMillan, and S. W. Mart<strong>in</strong>,<br />
J. Appl. Phys. 88, 31132000.<br />
54 E. Donth, J. Non-Cryst. Solids 53, 3251982.<br />
55 E. Hempel, G. Hempel, A. Hensel, C. Schick, and E. Donth, J. Phys.<br />
Chem. B 104, 2460 2000 see Appendix.<br />
56 E. Donth, Relaxation and Thermo<strong>dynamics</strong> <strong>in</strong> Polymers. Glass Transition<br />
Akademie, Berl<strong>in</strong> 1992.<br />
57 M. von Laue, Phys. Z. 18, 5421917.<br />
58 H. Sillescu, J. Non-Cryst. Solids 243, 811999.<br />
59 O. Yamamuro, I. Tsukushi, A. L<strong>in</strong>dqvist, S. Takahara, M. Ishikawa, and T.<br />
Matsuo, J. Phys. Chem. B 102, 1605 1998.<br />
60 S. Corezzi, D. Fioretto, S. C. Santucci, S. Capaccioli, R. Casal<strong>in</strong>i, M.<br />
Lucchesi, E. Hempel, and M. Be<strong>in</strong>er, Philos. Mag. B 82, 339 2002.<br />
61 J. Korus, E. Hempel, M. Be<strong>in</strong>er, S. Kahle, and E. Donth, Acta Polym. 48,<br />
369 1997.<br />
62 This f<strong>in</strong>d<strong>in</strong>g is consistent with <strong>the</strong> change <strong>of</strong> Vogel temperatures <strong>in</strong> <strong>the</strong><br />
-<strong>crossover</strong> region, mentioned above. Interpret<strong>in</strong>g k BT 0 as a measure <strong>of</strong><br />
<strong>the</strong> roughness for <strong>the</strong> relevant energy landscape Refs. 21 and 51, we see<br />
that <strong>the</strong> landscape for <strong>the</strong> process has a lower roughness than those <strong>of</strong><br />
<strong>the</strong> a or process. see Sec. IV D above <strong>the</strong> -<strong>crossover</strong> region. Increas<strong>in</strong>g<br />
<strong>the</strong> cooperativity permits <strong>the</strong> phase-space po<strong>in</strong>t <strong>of</strong> representative<br />
subsystems to f<strong>in</strong>d its way through <strong>the</strong> landscape with low ‘‘saddles’’<br />
accessible also at low temperature. Above <strong>the</strong> <strong>crossover</strong>, at higher temperatures,<br />
<strong>the</strong> system can do with higher landscape saddles and does not<br />
need <strong>the</strong> cooperativity with rare low saddles.<br />
63<br />
G. P. Johari and E. Whalley, Faraday Symp. Chem. Soc. 6, 231972.<br />
64<br />
S. H. Glarum, J. Chem. Phys. 33, 6391960.<br />
65<br />
H. Huth, PhD <strong>the</strong>sis, Universität Halle, Halle, Germany, 2001.<br />
66<br />
E. Hempel unpublished.<br />
67<br />
I. Alig and G. P. Johari, J. Polym. Sci., Polym. Phys. Ed. 31, 2991993.<br />
68<br />
M. Be<strong>in</strong>er and G. P. Johari unpublished.<br />
69<br />
N. G. McCrum, B. E. Read, and G. Williams, Anelastic and Dielectric<br />
Effects <strong>in</strong> Polymeric Solids Wiley, London 1967.<br />
70<br />
R. Greus, G. Ribellez, and D. Calleja, Polymer 26, 1849 1985.<br />
71<br />
Gangasharan and S. S. N. Murthy, J. Chem. Phys. 99, 9865 1993.<br />
72<br />
T. Nicolai and G. Floudas, Macromolecules 31, 2578 1998.<br />
73<br />
M. Grimau, E. Laredo, Y. M. C. Perez, and A. Bello, J. Chem. Phys. 114,<br />
6417 2001.<br />
74<br />
D. Pisignano, S. Capaccioli, R. Casal<strong>in</strong>i, M. Lucchesi, P. A. Rolla, A.<br />
Justl, and E. Rössler, J. Phys.: Condens. Matter 13, 4405 2001.<br />
75<br />
M. Be<strong>in</strong>er, Macromol. Rapid Commun. 22, 869 2001.<br />
76<br />
S. Reissig, PhD <strong>the</strong>sis, Universität Halle, Halle, Germany, 2000.<br />
Downloaded 14 Nov 2002 to 194.95.63.241. Redistribution subject to AIP license or copyright, see http://ojps.aip.org/jcpo/jcpcr.jsp