Two crossover regions in the dynamics of glass forming ... - Fisica
Two crossover regions in the dynamics of glass forming ... - Fisica
Two crossover regions in the dynamics of glass forming ... - Fisica

You also want an ePaper? Increase the reach of your titles
YUMPU automatically turns print PDFs into web optimized ePapers that Google loves.
2440 J. Chem. Phys., Vol. 117, No. 5, 1 August 2002 Corezzi et al.<br />
TABLE I. Havriliak–Negami fit parameters for <strong>the</strong> relaxation <strong>of</strong> PPGE and DGEBA at several temperatures. When a shape parameter was undergo<strong>in</strong>g<br />
additional constra<strong>in</strong>ts as expla<strong>in</strong>ed <strong>in</strong> <strong>the</strong> text, <strong>the</strong> respective error is not reported.<br />
T K<br />
PPGE<br />
HN s m n T K HN s m n However, <strong>the</strong> significant uncerta<strong>in</strong>ty <strong>of</strong> HCS parameters restra<strong>in</strong>s<br />
us from go<strong>in</strong>g <strong>in</strong>to a deeper comparison.<br />
The dielectric relaxation times max obta<strong>in</strong>ed from <strong>the</strong><br />
fitt<strong>in</strong>g procedure, toge<strong>the</strong>r with <strong>the</strong> calorimetric characteristic<br />
times max obta<strong>in</strong>ed from <strong>the</strong> location <strong>of</strong> <strong>the</strong> peak <strong>in</strong> <strong>the</strong><br />
isochronal or iso<strong>the</strong>rmal c p spectra, are reported <strong>in</strong> <strong>the</strong><br />
Arrhenius plot <strong>of</strong> Figs. 6 and 7 and compared with <strong>the</strong> viscosity<br />
data. The trace <strong>of</strong> calorimetry and dielectrics co<strong>in</strong>cide<br />
with<strong>in</strong> <strong>the</strong> experimental uncerta<strong>in</strong>ty, and <strong>the</strong>ir temperature<br />
dependence closely parallels that <strong>of</strong> . Figure 8 shows a<br />
conv<strong>in</strong>c<strong>in</strong>g check <strong>of</strong> <strong>the</strong> relation max <strong>in</strong> our samples, up<br />
to 332 K <strong>in</strong> PPGE and 343 K <strong>in</strong> DGEBA. It displays that a<br />
l<strong>in</strong>ear fit <strong>of</strong> log max vs log has slope 0.990.02 and 0.98<br />
0.02 <strong>in</strong> PPGE and DGEBA, respectively. Accord<strong>in</strong>g to<br />
max, <strong>the</strong> viscosity data are rescaled up to <strong>the</strong> highest temperatures<br />
measured, and shown as solid l<strong>in</strong>es <strong>in</strong> <strong>the</strong> Arrhenius<br />
plot <strong>of</strong> Figs. 6a and 7a. We notice that <strong>the</strong> proportionality<br />
<strong>of</strong> max to <strong>in</strong> supercooled liquids has a physical basis<br />
<strong>in</strong> <strong>the</strong> -scale universality predicted by <strong>the</strong> mode coupl<strong>in</strong>g<br />
<strong>the</strong>ory and verified <strong>in</strong> different systems e.g., see Ref. 40,<br />
but it is possible that at sufficiently high temperatures a<br />
max/T regime ensues, as predicted by <strong>the</strong> hydrodynamic<br />
Debye model and recently observed <strong>in</strong> low-molecular-weight<br />
organic compounds. 13 However, <strong>the</strong> possible differences <strong>in</strong><br />
Figs. 6 and 7 due to a maxT rescal<strong>in</strong>g <strong>of</strong> <strong>the</strong> viscosity<br />
data for temperatures higher than those represented <strong>in</strong> Fig. 8<br />
have no significant effect on <strong>the</strong> analysis and discussion reported<br />
<strong>in</strong> <strong>the</strong> follow<strong>in</strong>g.<br />
Toge<strong>the</strong>r with <strong>the</strong> secondary relaxation times, Figs. 6a<br />
and 7a give <strong>the</strong> complete relaxation map <strong>of</strong> our samples <strong>in</strong><br />
<strong>the</strong> supercooled and <strong>glass</strong>y state, as revealed by dielectric<br />
spectroscopy, HCS, and viscosity measurements. As known,<br />
<strong>the</strong> <strong>glass</strong> transition phenomenon is commonly described as<br />
an ergodic- to nonergodic-state transition and T g is def<strong>in</strong>ed as<br />
<strong>the</strong> temperature at which <strong>the</strong> ergodicity is broken on <strong>the</strong> ex-<br />
DGEBA<br />
331.8 (7.63)109 0.63 0.41 2.70.6 343 (9.52.3)1010 10.03 0.42 0.60.3<br />
327.9 (1.040.06)108 0.63 0.40 3.10.6 333 (2.40.5)109 10.03 0.42 1.30.2<br />
323.1 (1.800.05)108 0.64 0.40 3.20.3 323 (5.00.5)109 10.04 0.42 2.00.3<br />
317.9 (3.60.2)108 0.63 0.40 3.40.4 313 (1.250.08)108 0.950.03 0.41 2.70.2<br />
313.0 (6.60.2)108 0.63 0.40 3.80.3 303 (4.480.13)108 0.880.02 0.41 3.50.4<br />
308.0 (1.450.06)107 0.63 0.39 4.10.4 298 (1.080.05)107 0.870.02 0.41 3.90.5<br />
303.1 (3.80.2)107 0.610.02 0.390.02 4.40.2 293 (3.210.08)107 0.880.02 0.39 4.20.3<br />
298.3 (1.070.03)106 0.620.02 0.390.02 4.70.3 288 (8.90.4)107 0.860.03 0.400.05 4.70.3<br />
293.1 (4.130.06)106 0.640.015 0.390.02 4.90.2 283 (3.750.12)106 0.860.03 0.400.04 5.10.3<br />
287.5 (2.1900.013)105 0.630.02 0.390.02 5.390.15 278 (2.210.06)105 0.830.02 0.390.02 5.710.03<br />
283.9 (7.80.3)105 0.640.02 0.400.02 5.60.2 273 (2.120.08)104 0.850.01 0.400.01 6.210.03<br />
278.9 (5.70.2)104 0.650.01 0.400.01 5.90.2 268 (3.390.09)103 0.850.01 0.400.01 6.830.05<br />
274.4 (4.820.13)103 0.650.01 0.400.01 6.380.05 263 (7.10.3)102 0.820.02 0.430.02 7.370.05<br />
270.1 (5.220.17)102 0.650.01 0.390.01 6.80.2 261 (3.20.2)101 0.820.02 0.430.02 7.730.08<br />
266.3 (5.70.1)101 0.650.02 0.400.01 7.20.2 259 (1.650.04)1 0 0.830.02 0.400.01 7.80.2<br />
262.1 (1.020.08)10 1 0.670.03 0.400.01 7.50.2 256 (2.250.06)10 1 0.820.04 0.400.01 8.00.2<br />
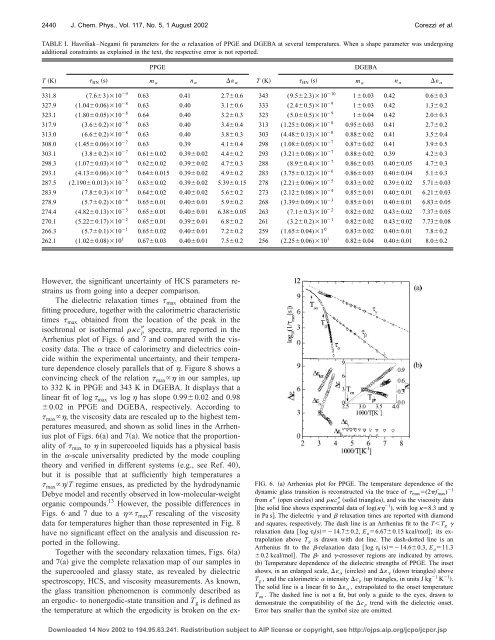
FIG. 6. a Arrhenius plot for PPGE. The temperature dependence <strong>of</strong> <strong>the</strong><br />
dynamic <strong>glass</strong> transition is reconstructed via <strong>the</strong> trace <strong>of</strong> max(2f max) 1<br />
from open circles and c p solid triangles, and via <strong>the</strong> viscosity data<br />
<strong>the</strong> solid l<strong>in</strong>e shows experimental data <strong>of</strong> log( 1 ), with log 8.3 and <br />
<strong>in</strong> Pa s. The dielectric and relaxation times are reported with diamond<br />
and squares, respectively. The dash l<strong>in</strong>e is an Arrhenius fit to <strong>the</strong> TT g <br />
relaxation data log 0s14.70.2, E a6.670.15 kcal/mol; its extrapolation<br />
above T g is drawn with dot l<strong>in</strong>e. The dash-dotted l<strong>in</strong>e is an<br />
Arrhenius fit to <strong>the</strong> -relaxation data log 0 s14.60.3, E a11.3<br />
0.2 kcal/mol. The- and -<strong>crossover</strong> <strong>regions</strong> are <strong>in</strong>dicated by arrows.<br />
b Temperature dependence <strong>of</strong> <strong>the</strong> dielectric strengths <strong>of</strong> PPGE. The <strong>in</strong>set<br />
shows, <strong>in</strong> an enlarged scale, circles and down triangles above<br />
T g , and <strong>the</strong> calorimetric <strong>in</strong>tensity c p up triangles, <strong>in</strong> units J kg 1 K 1 .<br />
The solid l<strong>in</strong>e is a l<strong>in</strong>ear fit to , extrapolated to <strong>the</strong> onset temperature<br />
T on . The dashed l<strong>in</strong>e is not a fit, but only a guide to <strong>the</strong> eyes, drawn to<br />
demonstrate <strong>the</strong> compatibility <strong>of</strong> <strong>the</strong> c p trend with <strong>the</strong> dielectric onset.<br />
Error bars smaller than <strong>the</strong> symbol size are omitted.<br />
Downloaded 14 Nov 2002 to 194.95.63.241. Redistribution subject to AIP license or copyright, see http://ojps.aip.org/jcpo/jcpcr.jsp