Maneuvering the Mosaic: Full Report - Forest Trends
Maneuvering the Mosaic: Full Report - Forest Trends
Maneuvering the Mosaic: Full Report - Forest Trends

You also want an ePaper? Increase the reach of your titles
YUMPU automatically turns print PDFs into web optimized ePapers that Google loves.
12 State of <strong>the</strong> Voluntary Carbon Markets 2013<br />
1. Market Overview: Volume and Value<br />
In 2012, voluntary actors paid a volume-weighted<br />
average price of $5.9/tCO 2 e – down 5% from 2011’s<br />
$6.2/tCO 2 e, but signifi cantly higher than <strong>the</strong> United<br />
Nations’ regulatory Clean Development Mechanism<br />
(CDM) carbon offset price of less than a $1/tCO 2 e<br />
as of mid-2013. As demonstrated throughout this<br />
report, last year’s lower average price for voluntary<br />
offset transactions is <strong>the</strong> aggregation of close to 1,000<br />
reported price points that vary greatly by project<br />
standard, location, and technology – ranging from less<br />
than $.1/tCO 2 e to over $100/tCO 2 e in 2011.<br />
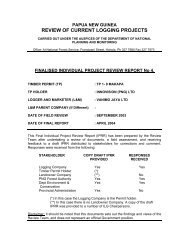
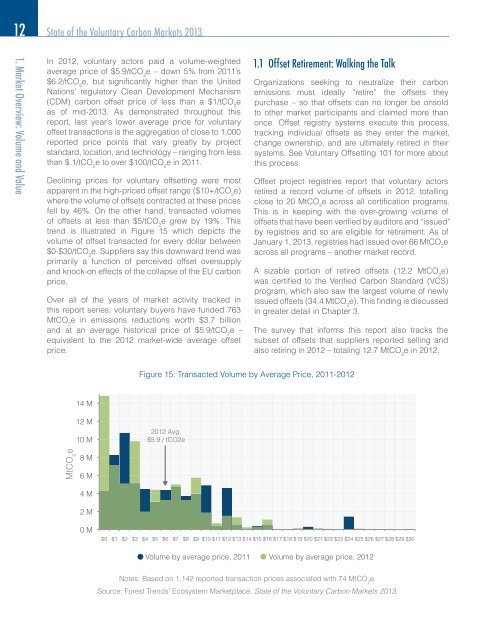
Declining prices for voluntary offsetting were most<br />
apparent in <strong>the</strong> high-priced offset range ($10+/tCO 2 e)<br />
where <strong>the</strong> volume of offsets contracted at <strong>the</strong>se prices<br />
fell by 46%. On <strong>the</strong> o<strong>the</strong>r hand, transacted volumes<br />
of offsets at less than $5/tCO 2 e grew by 19%. This<br />
trend is illustrated in Figure 15 which depicts <strong>the</strong><br />
volume of offset transacted for every dollar between<br />
$0-$30/tCO 2 e. Suppliers say this downward trend was<br />
primarily a function of perceived offset oversupply<br />
and knock-on effects of <strong>the</strong> collapse of <strong>the</strong> EU carbon<br />
price.<br />
Over all of <strong>the</strong> years of market activity tracked in<br />
this report series, voluntary buyers have funded 763<br />
MtCO 2 e in emissions reductions worth $3.7 billion<br />
and at an average historical price of $5.9/tCO 2 e –<br />
equivalent to <strong>the</strong> 2012 market-wide average offset<br />
price.<br />
MtCO e 2<br />
14 M<br />
12 M<br />
10 M<br />
8 M<br />
6 M<br />
4 M<br />
2 M<br />
0 M<br />
2012 Avg.<br />
$5.9 2012 / tCO2e Avg.<br />
$5.9/tCO2e<br />
1.1 Offset Retirement: Walking <strong>the</strong> Talk<br />
Organizations seeking to neutralize <strong>the</strong>ir carbon<br />
emissions must ideally “retire” <strong>the</strong> offsets <strong>the</strong>y<br />
purchase – so that offsets can no longer be onsold<br />
to o<strong>the</strong>r market participants and claimed more than<br />
once. Offset registry systems execute this process,<br />
track ing individual offsets as <strong>the</strong>y enter <strong>the</strong> market,<br />
change ownership, and are ultimately retired in <strong>the</strong>ir<br />
systems. See Voluntary Offsetting 101 for more about<br />
this process.<br />
Offset project registries report that voluntary actors<br />
retired a record volume of offsets in 2012, totalling<br />
close to 20 MtCO 2 e across all certifi cation programs.<br />
This is in keeping with <strong>the</strong> ever-growing volume of<br />
offsets that have been verifi ed by auditors and “issued”<br />
by registries and so are eligible for retirement. As of<br />
January 1, 2013, registries had issued over 66 MtCO 2 e<br />
across all programs – ano<strong>the</strong>r market record.<br />
A sizable portion of retired offsets (12.2 MtCO 2 e)<br />
was certifi ed to <strong>the</strong> Verifi ed Carbon Standard (VCS)<br />
program, which also saw <strong>the</strong> largest volume of newly<br />
issued offsets (34.4 MtCO 2 e). This fi nding is discussed<br />
in greater detail in Chapter 3.<br />
The survey that informs this report also tracks <strong>the</strong><br />
subset of offsets that suppliers reported selling and<br />
also retiring in 2012 – totaling 12.7 MtCO 2 e in 2012.<br />
Figure 15: Transacted Volume by Average Price, 2011-2012<br />
$0 $1 $2 $3 $4 $5 $6 $7 $8 $9 $10 $11 $12 $13 $14 $15 $16 $17 $18 $19 $20 $21 $22 $23 $24 $25 $26 $27 $28 $29 $30<br />
Volume by average price, 2011 Volume by average price, 2012<br />
Notes: Based on 1,142 reported transaction prices associated with 74 MtCO 2 e.<br />
Source: <strong>Forest</strong> <strong>Trends</strong>’ Ecosystem Marketplace. State of <strong>the</strong> Voluntary Carbon Markets 2013.