Maneuvering the Mosaic: Full Report - Forest Trends
Maneuvering the Mosaic: Full Report - Forest Trends
Maneuvering the Mosaic: Full Report - Forest Trends

Create successful ePaper yourself
Turn your PDF publications into a flip-book with our unique Google optimized e-Paper software.
MtCO 2 e<br />
25<br />
20<br />
15<br />
10<br />
5<br />
0<br />
jeopardize <strong>the</strong>ir ability to continue adding value to<br />
<strong>the</strong> marketplace, where between <strong>the</strong>ir purchases and<br />
sales <strong>the</strong>y contributed almost half of market-wide value<br />
($247 million). At <strong>the</strong> same time, project developers<br />
note (and our data shows) that retailers were less<br />
likely than offset end users to sign on to multi-year,<br />
large-volume contracts. Retailers say that last year’s<br />
lower volume of forward-sold offsets refl ects some<br />
avoidance of risk associated with exposing clients<br />
to prices that are trending downward. It also doesn’t<br />
refl ect <strong>the</strong> offset quantities that clients have committed<br />
to buy on annual basis via multi-year contracts with<br />
retailers.<br />
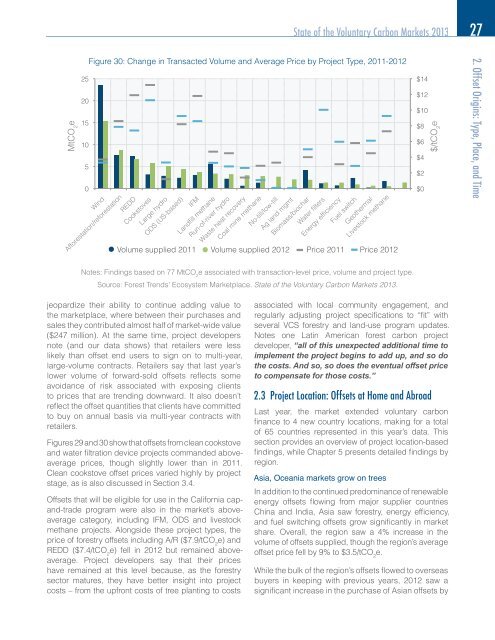
Figures 29 and 30 show that offsets from clean cookstove<br />
and water fi ltration device projects commanded aboveaverage<br />
prices, though slightly lower than in 2011.<br />
Clean cookstove offset prices varied highly by project<br />
stage, as is also discussed in Section 3.4.<br />
Offsets that will be eligible for use in <strong>the</strong> California capand-trade<br />
program were also in <strong>the</strong> market’s aboveaverage<br />
category, including IFM, ODS and livestock<br />
methane projects. Alongside <strong>the</strong>se project types, <strong>the</strong><br />
price of forestry offsets including A/R ($7.9/tCO 2 e) and<br />
REDD ($7.4/tCO 2 e) fell in 2012 but remained aboveaverage.<br />
Project developers say that <strong>the</strong>ir prices<br />
have remained at this level because, as <strong>the</strong> forestry<br />
sector matures, <strong>the</strong>y have better insight into project<br />
costs – from <strong>the</strong> upfront costs of tree planting to costs<br />
State of <strong>the</strong> Voluntary Carbon Markets 2013 27<br />
Figure 30: Change in Transacted Volume and Average Price by Project Type, 2011-2012<br />
Wind<br />
Afforestation/reforestation<br />
REDD<br />
Cookstoves<br />
Large hydro<br />
ODS (US-based)<br />
IFM<br />
Landfill methane<br />
Run-of-river hydro<br />
Waste heat recovery<br />
Coal mine methane<br />
No-till/low-till<br />
Ag land mgmt<br />
Biomass/biochar<br />
Water filters<br />
Energy efficiency<br />
Fuel switch<br />
Geo<strong>the</strong>rmal<br />
Livestock methane<br />
Volume supplied 2011 Volume supplied 2012 Price 2011 Price 2012<br />
Notes: Findings based on 77 MtCO e associated with transaction-level price, volume and project type.<br />
2<br />
Source: <strong>Forest</strong> <strong>Trends</strong>’ Ecosystem Marketplace. State of <strong>the</strong> Voluntary Carbon Markets 2013.<br />
$14<br />
$12<br />
$10<br />
associated with local community engagement, and<br />
regularly adjusting project specifi cations to “fi t” with<br />
several VCS forestry and land-use program updates.<br />
Notes one Latin American forest carbon project<br />
developer, “all of this unexpected additional time to<br />
implement <strong>the</strong> project begins to add up, and so do<br />
<strong>the</strong> costs. And so, so does <strong>the</strong> eventual offset price<br />
to compensate for those costs.”<br />
2.3 Project Location: Offsets at Home and Abroad<br />
Last year, <strong>the</strong> market extended voluntary carbon<br />
fi nance to 4 new country locations, making for a total<br />
of 65 countries represented in this year’s data. This<br />
section provides an overview of project location-based<br />
fi ndings, while Chapter 5 presents detailed fi ndings by<br />
region.<br />
Asia, Oceania markets grow on trees<br />
In addition to <strong>the</strong> continued predominance of renewable<br />
energy offsets fl owing from major supplier countries<br />
China and India, Asia saw forestry, energy effi ciency,<br />
and fuel switching offsets grow signifi cantly in market<br />
share. Overall, <strong>the</strong> region saw a 4% increase in <strong>the</strong><br />
volume of offsets supplied, though <strong>the</strong> region’s average<br />
offset price fell by 9% to $3.5/tCO e. 2<br />
While <strong>the</strong> bulk of <strong>the</strong> region’s offsets fl owed to overseas<br />
buyers in keeping with previous years, 2012 saw a<br />
signifi cant increase in <strong>the</strong> purchase of Asian offsets by<br />
$8<br />
$6<br />
$4<br />
$2<br />
$0<br />
$/tCO 2 e<br />
2. Offset Origins: Type, Place, and Time