Maneuvering the Mosaic: Full Report - Forest Trends
Maneuvering the Mosaic: Full Report - Forest Trends
Maneuvering the Mosaic: Full Report - Forest Trends

Create successful ePaper yourself
Turn your PDF publications into a flip-book with our unique Google optimized e-Paper software.
These and o<strong>the</strong>r fi ndings are described in this seventh<br />
edition of <strong>the</strong> State of <strong>the</strong> Voluntary Carbon Markets<br />
report series, which is informed by over 300 responses<br />
to our global annual survey of offset providers. Each of<br />
<strong>the</strong>se suppliers respond on behalf of a unique portfolio<br />
of carbon offset projects and voluntary demand drivers.<br />
This report describes <strong>the</strong>se responses both as unique<br />
actions and as <strong>the</strong> sum of <strong>the</strong>ir many parts, unveiling a<br />
picture of a market leveraging innovation to maneuver<br />
<strong>the</strong> mosaic of public and private solutions to climate<br />
change.<br />
Voluntary Offset Demand Tops 100 Million Tonnes,<br />
Market Value Down 11%<br />
In 2012, voluntary actors contracted 101 million tonnes<br />
of carbon offsets (MtCO 2 e) for immediate or future<br />
delivery – 4% more than in 2011. The vast majority<br />
of <strong>the</strong>se offset transactions (98.5 MtCO 2 e) occurred<br />
bilaterally, or “over <strong>the</strong> counter” (OTC) ra<strong>the</strong>r than on<br />
any formal exchange.<br />
This represents <strong>the</strong> second highest level of OTC market<br />
activity tracked in this report series, behind <strong>the</strong> 2010<br />
market which was boosted by a sizable transaction of<br />
offsets generated through <strong>the</strong> voluntary Chicago Climate<br />
Exchange (CCX) – which wound down operations in<br />
<strong>the</strong> same year. Despite <strong>the</strong> formal program’s closure,<br />
its infl uence is still felt in <strong>the</strong> North American carbon<br />
markets, where voluntary actors transacted 8.3 MtCO 2 e<br />
of CCX offsets in 2012 – pushing <strong>the</strong> voluntary market<br />
as whole over <strong>the</strong> one-hundred-million-tonne mark.<br />
While offset demand grew, market value decreased<br />
11% to $523 million as offset prices fell slightly for<br />
most project types. A sizeable portion of market<br />
value (64% of value associated with a contract type<br />
or $170 million) was paid to offset sellers at <strong>the</strong> point<br />
of transaction ra<strong>the</strong>r than offset delivery – primarily via<br />
spot contracts (35.6 MtCO 2 e, up 25% from 2011) and<br />
pre-payment for future delivery (8.7 MtCO 2 e, down 1%<br />
from 2011). Ano<strong>the</strong>r $97.5 million will be paid in future<br />
years, if and when <strong>the</strong> projects under contract deliver<br />
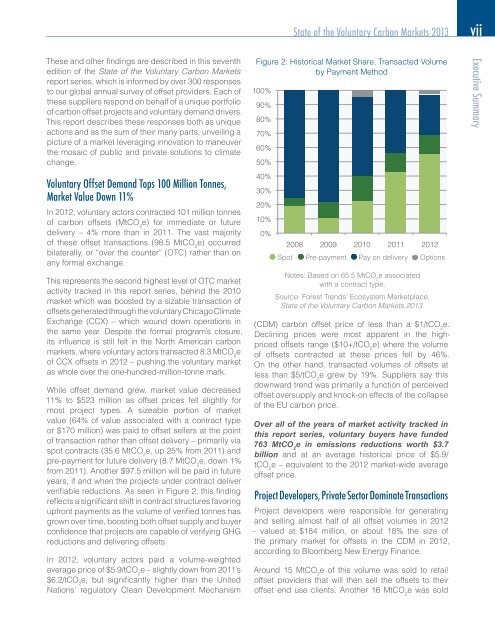
verifi able reductions. As seen in Figure 2, this fi nding<br />
refl ects a signifi cant shift in contract structures favoring<br />
upfront payments as <strong>the</strong> volume of verifi ed tonnes has<br />
grown over time, boosting both offset supply and buyer<br />
confi dence that projects are capable of verifying GHG<br />
reductions and delivering offsets.<br />
In 2012, voluntary actors paid a volume-weighted<br />
average price of $5.9/tCO 2 e – slightly down from 2011’s<br />
$6.2/tCO 2 e, but signifi cantly higher than <strong>the</strong> United<br />
Nations’ regulatory Clean Development Mechanism<br />
State of <strong>the</strong> Voluntary Carbon Markets 2013 vii<br />
Figure 2: Historical Market Share, Transacted Volume<br />
by Payment Method<br />
100%<br />
90%<br />
80%<br />
70%<br />
60%<br />
50%<br />
40%<br />
30%<br />
20%<br />
10%<br />
0%<br />
2008 2009 2010 2011 2012<br />
Spot Pre-payment Pay on delivery Options<br />
Notes: Based on 65.5 MtCO e associated<br />
2<br />
with a contract type.<br />
Source: <strong>Forest</strong> <strong>Trends</strong>’ Ecosystem Marketplace.<br />
State of <strong>the</strong> Voluntary Carbon Markets 2013.<br />
(CDM) carbon offset price of less than a $1/tCO 2 e.<br />
Declining prices were most apparent in <strong>the</strong> highpriced<br />
offsets range ($10+/tCO 2 e) where <strong>the</strong> volume<br />
of offsets contracted at <strong>the</strong>se prices fell by 46%.<br />
On <strong>the</strong> o<strong>the</strong>r hand, transacted volumes of offsets at<br />
less than $5/tCO 2 e grew by 19%. Suppliers say this<br />
downward trend was primarily a function of perceived<br />
offset oversupply and knock-on effects of <strong>the</strong> collapse<br />
of <strong>the</strong> EU carbon price.<br />
Over all of <strong>the</strong> years of market activity tracked in<br />
this report series, voluntary buyers have funded<br />
763 MtCO 2 e in emissions reductions worth $3.7<br />
billion and at an average historical price of $5.9/<br />
tCO 2 e – equivalent to <strong>the</strong> 2012 market-wide average<br />
offset price.<br />
Project Developers, Private Sector Dominate Transactions<br />
Project developers were responsible for generating<br />
and selling almost half of all offset volumes in 2012<br />
– valued at $184 million, or about 18% <strong>the</strong> size of<br />
<strong>the</strong> primary market for offsets in <strong>the</strong> CDM in 2012,<br />
according to Bloomberg New Energy Finance.<br />
Around 15 MtCO 2 e of this volume was sold to retail<br />
offset providers that will <strong>the</strong>n sell <strong>the</strong> offsets to <strong>the</strong>ir<br />
offset end use clients. Ano<strong>the</strong>r 16 MtCO 2 e was sold<br />
Executive Summary