SMEs and Research - European Commission - Europa
SMEs and Research - European Commission - Europa
SMEs and Research - European Commission - Europa
You also want an ePaper? Increase the reach of your titles
YUMPU automatically turns print PDFs into web optimized ePapers that Google loves.
8<br />
with budgetary<br />
discretion <strong>and</strong> a<br />
propensity for networking. This<br />
fact can be interpreted as a real added<br />
value of the <strong>European</strong> SME-specific schemes, i.e.<br />
those <strong>SMEs</strong> wishing to evolve <strong>and</strong> develop technologically,<br />
turn to the EU to do just that.<br />
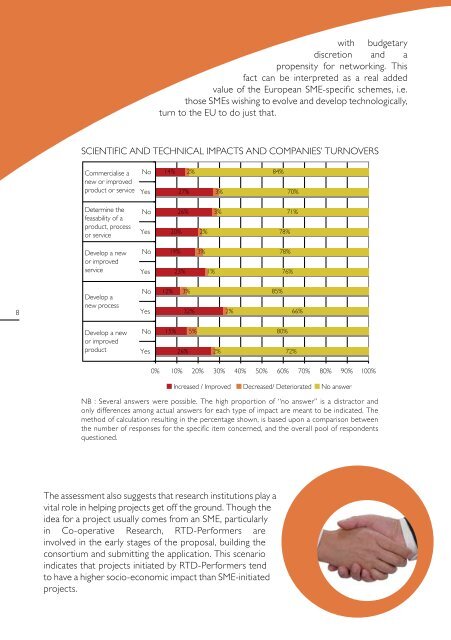
SCIENTIFIC AND<br />
Scientific<br />
TECHNICAL<br />
<strong>and</strong> technical<br />
IMPACTS<br />
impacts<br />
AND<br />
<strong>and</strong> companies’<br />
COMPANIES’<br />
Turnover<br />
TURNOVERS<br />
Commercialise a<br />
new or improved<br />
product or service<br />
Determine the<br />
feasability of a<br />
product, process<br />
or service<br />
Develop a new<br />
or improved<br />
service<br />
Develop a<br />
new process<br />
Develop a new<br />
or improved<br />
product<br />
No<br />
Yes<br />
No<br />
Yes<br />
No<br />
Yes<br />
No<br />
Yes<br />
No<br />
Yes<br />
The assessment also suggests that research institutions play a<br />
vital role in helping projects get off the ground. Though the<br />
idea for a project usually comes from an SME, particularly<br />
in Co-operative <strong>Research</strong>, RTD-Performers are<br />
involved in the early stages of the proposal, building the<br />
consortium <strong>and</strong> submitting the application. This scenario<br />
indicates that projects initiated by RTD-Performers tend<br />
to have a higher socio-economic impact than SME-initiated<br />
projects.<br />
14%<br />
12%<br />
20%<br />
19%<br />
15%<br />
27%<br />
26%<br />
23%<br />
3%<br />
26%<br />
2%<br />
32%<br />
5%<br />
2%<br />
3%<br />
1%<br />
3%<br />
3%<br />
2%<br />
2%<br />
0% 10% 20% 30% 40% 50% 60% 70% 80% 90% 100%<br />
84%<br />
85%<br />
78%<br />
78%<br />
76%<br />
80%<br />
70%<br />
71%<br />
72%<br />
66%<br />
Increased / Improved Decreased/ Deteriorated No answer<br />
NB : Several answers were possible. The high proportion of “no answer” is a distractor <strong>and</strong><br />
NB : Several answers were possible. The high proportion of ‘no answer” is an artefact <strong>and</strong> only differences among actual answers for each type of<br />
impact are meant to be indicated. The mode of calculation resulting in the percentage shown is based upon a comparison between the number of<br />
responses only differences for the specific among item concerned actual <strong>and</strong> the answers overall pool for of each respondents type the of question impact was asked are to. meant to be indicated. The<br />
method of calculation resulting in the percentage shown, is based upon a comparison between<br />
the number of responses for the specific item concerned, <strong>and</strong> the overall pool of respondents<br />
questioned.


