

TEchNOLOGy TRaNSFER MODEL - Javna agencija
TEchNOLOGy TRaNSFER MODEL - Javna agencija
TEchNOLOGy TRaNSFER MODEL - Javna agencija

Create successful ePaper yourself
Turn your PDF publications into a flip-book with our unique Google optimized e-Paper software.
KNOWLEDGE FOR BUSINESS IN BORDER REGIONS<br />
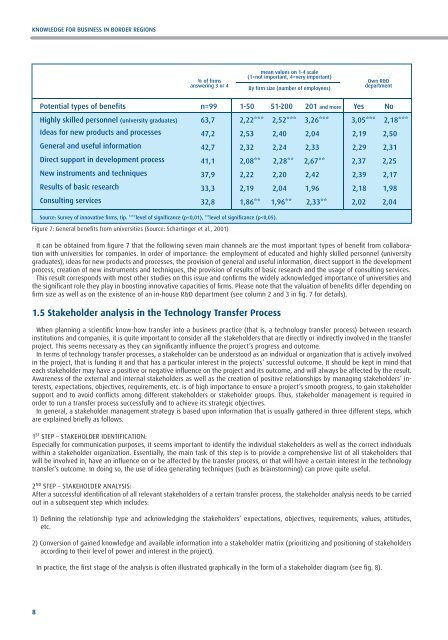
Figure 7: General benefits from universities (Source: Schartinger et al., 2001)<br />
It can be obtained from figure 7 that the following seven main channels are the most important types of benefit from collaboration<br />
with universities for companies. In order of importance: the employment of educated and highly skilled personnel (university<br />
graduates), ideas for new products and processes, the provision of general and useful information, direct support in the development<br />
process, creation of new instruments and techniques, the provision of results of basic research and the usage of consulting services.<br />
This result corresponds with most other studies on this issue and confirms the widely acknowledged importance of universities and<br />
the significant role they play in boosting innovative capacities of firms. Please note that the valuation of benefits differ depending on<br />
firm size as well as on the existence of an in-house R&D department (see column 2 and 3 in fig. 7 for details).<br />
1.5 Stakeholder analysis in the Technology Transfer Process<br />
When planning a scientific know-how transfer into a business practice (that is, a technology transfer process) between research<br />
institutions and companies, it is quite important to consider all the stakeholders that are directly or indirectly involved in the transfer<br />
project. This seems necessary as they can significantly influence the project’s progress and outcome.<br />
In terms of technology transfer processes, a stakeholder can be understood as an individual or organization that is actively involved<br />
in the project, that is funding it and that has a particular interest in the projects’ successful outcome. It should be kept in mind that<br />
each stakeholder may have a positive or negative influence on the project and its outcome, and will always be affected by the result.<br />
Awareness of the external and internal stakeholders as well as the creation of positive relationships by managing stakeholders’ interests,<br />
expectations, objectives, requirements, etc. is of high importance to ensure a project’s smooth progress, to gain stakeholder<br />
support and to avoid conflicts among different stakeholders or stakeholder groups. Thus, stakeholder management is required in<br />
order to run a transfer process successfully and to achieve its strategic objectives.<br />
In general, a stakeholder management strategy is based upon information that is usually gathered in three different steps, which<br />
are explained briefly as follows.<br />
1 ST STEP – STAKEHOLDER IDENTIFICATION:<br />
Especially for communication purposes, it seems important to identify the individual stakeholders as well as the correct individuals<br />
within a stakeholder organization. Essentially, the main task of this step is to provide a comprehensive list of all stakeholders that<br />
will be involved in, have an influence on or be affected by the transfer process, or that will have a certain interest in the technology<br />
transfer’s outcome. In doing so, the use of idea generating techniques (such as brainstorming) can prove quite useful.<br />
2 ND STEP – STAKEHOLDER ANALYSIS:<br />
After a successful identification of all relevant stakeholders of a certain transfer process, the stakeholder analysis needs to be carried<br />
out in a subsequent step which includes:<br />
1) Defining the relationship type and acknowledging the stakeholders’ expectations, objectives, requirements, values, attitudes,<br />
etc.<br />
2) Conversion of gained knowledge and available information into a stakeholder matrix (prioritizing and positioning of stakeholders<br />
according to their level of power and interest in the project).<br />
In practice, the first stage of the analysis is often illustrated graphically in the form of a stakeholder diagram (see fig. 8).<br />
8