Living for the - Raiffeisen
Living for the - Raiffeisen
Living for the - Raiffeisen

You also want an ePaper? Increase the reach of your titles
YUMPU automatically turns print PDFs into web optimized ePapers that Google loves.
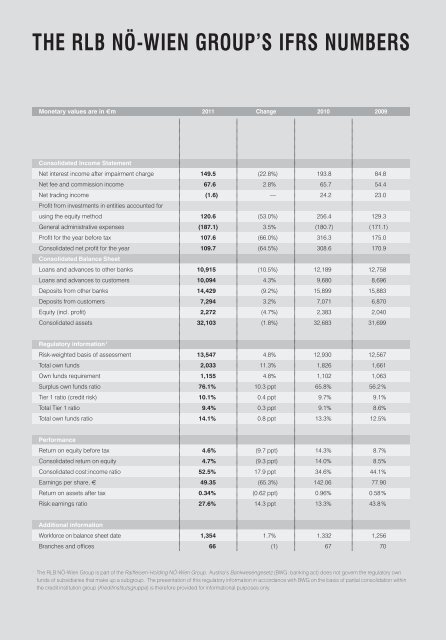
The RLB NÖ-Wien Group’s IFRS Numbers<br />
Monetary values are in €m 2011 Change 2010<br />
2009<br />
Consolidated Income Statement<br />
Net interest income after impairment charge 149.5 (22.8%) 193.8 84.8<br />
Net fee and commission income 67.6 2.8% 65.7 54.4<br />
Net trading income (1.6) — 24.2 23.0<br />
Profit from investments in entities accounted <strong>for</strong><br />
using <strong>the</strong> equity method 120.6 (53.0%) 256.4 129.3<br />
General administrative expenses (187.1) 3.5% (180.7) ( 171.1)<br />
Profit <strong>for</strong> <strong>the</strong> year be<strong>for</strong>e tax 107.6 (66.0%) 316.3 175.0<br />
Consolidated net profit <strong>for</strong> <strong>the</strong> year 109.7 (64.5%) 308.6 170.9<br />
Consolidated Balance Sheet<br />
Loans and advances to o<strong>the</strong>r banks 10,915 (10.5%) 12,189 12,758<br />
Loans and advances to customers 10,094 4.3% 9,680 8,696<br />
Deposits from o<strong>the</strong>r banks 14,429 (9.2%) 15,899 15,883<br />
Deposits from customers 7,294 3.2% 7,071 6,870<br />
Equity (incl. profit) 2,272 (4.7%) 2,383 2,040<br />
Consolidated assets 32,103 (1.8%) 32,683 31,699<br />
Regulatory in<strong>for</strong>mation 1<br />
Risk-weighted basis of assessment 13,547 4.8% 12,930 12,567<br />
Total own funds 2,033 11.3% 1,826 1,661<br />
Own funds requirement 1,155 4.8% 1,102 1,063<br />
Surplus own funds ratio 76.1% 10.3 ppt 65.8% 56.2 %<br />
Tier 1 ratio (credit risk) 10.1% 0.4 ppt 9.7% 9.1%<br />
Total Tier 1 ratio 9.4% 0.3 ppt 9.1% 8.6%<br />
Total own funds ratio 14.1% 0.8 ppt 13.3% 12.5%<br />
Per<strong>for</strong>mance<br />
Return on equity be<strong>for</strong>e tax 4.6% (9.7 ppt) 14.3% 8.7%<br />
Consolidated return on equity 4.7% (9.3 ppt) 14.0% 8.5%<br />
Consolidated cost:income ratio 52.5% 17.9 ppt 34.6% 44.1%<br />
Earnings per share, € 49.35 (65.3%) 142.06 77.90<br />
Return on assets after tax 0.34% (0.62 ppt) 0.96% 0.58 %<br />
Risk:earnings ratio 27.6% 14.3 ppt 13.3% 43.8 %<br />
Additional in<strong>for</strong>mation<br />
Work<strong>for</strong>ce on balance sheet date 1,354 1.7% 1,332 1,256<br />
Branches and offices 66 (1) 67 70<br />
1<br />
The RLB NÖ-Wien Group is part of <strong>the</strong> <strong>Raiffeisen</strong>-Holding NÖ-Wien Group. Austria’s Bankwesengesetz (BWG: banking act) does not govern <strong>the</strong> regulatory own<br />
funds of subsidiaries that make up a subgroup. The presentation of this regulatory in<strong>for</strong>mation in accordance with BWG on <strong>the</strong> basis of partial consolidation within<br />
<strong>the</strong> credit institution group (Kreditinstitutsgruppe) is <strong>the</strong>re<strong>for</strong>e provided <strong>for</strong> in<strong>for</strong>mational purposes only.