A novel 8.7 kDa protease inhibitor from chan seeds (Hyptis ... - UAM
A novel 8.7 kDa protease inhibitor from chan seeds (Hyptis ... - UAM
A novel 8.7 kDa protease inhibitor from chan seeds (Hyptis ... - UAM

Create successful ePaper yourself
Turn your PDF publications into a flip-book with our unique Google optimized e-Paper software.
C. Aguirre et al. / Comparative Biochemistry and Physiology Part B 138 (2004) 81–89<br />
87<br />
Table 2<br />
H. suaveolens trypsin <strong>inhibitor</strong> (HSTI) activity measured<br />
against <strong>protease</strong>s <strong>from</strong> different insects<br />
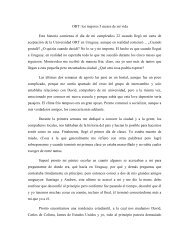
Fig. 10. Far-UV circular dichroism spectrum of HSTI (line)<br />
corrected for water baseline and normalized to mean residue<br />
ellipticity. Spectra reconstructed with different methods are also<br />
shown: k2d (triangles), Selcon (circles), Contin (diamonds)<br />
and CDSSTR (squares).<br />
quitin, a protein of similar molecular mass (8.6<br />
<strong>kDa</strong>, and 76 amino acid residues) and known<br />
structure (PDB file 1UBI). Deconvolution of this<br />
spectra using four different methods, yielded similar<br />
helical and strand contents, approximately 30%<br />
and 18%, respectively (Table 3). In all four cases,<br />
a good reconstruction of spectra is achieved,<br />
although better with Contin and CDSSTR methods<br />
as judged <strong>from</strong> Fig. 10 and <strong>from</strong> the RMS values<br />
in Table 3. However, caution should be taken with<br />
the numerical results since protein concentration<br />
was estimated by a colorimetric method, and the<br />
ellipticity value may <strong>chan</strong>ge once the extinction<br />
coefficient of HSTI is determined.<br />
3.2.3. Specificity<br />
The HSTI activity against insect <strong>protease</strong>s, was<br />
highly specific for trypsin-like serine <strong>protease</strong>s, it<br />
was not able to recognize chymotrypsin, papain or<br />
elastase (data not shown). Only two out of seven<br />
proteolytic activities <strong>from</strong> insects were recognized<br />
Protease source<br />
pH 8.1<br />
P. truncatus 30900<br />
M. sexta 7600<br />
S. cerealella N.D.<br />
pH 6.5<br />
T. castaneum N.D.<br />
C. maculatus N.D.<br />
A. obtectus N.D.<br />
S. zeamais N.D.<br />
pH 2.5<br />
T. castaneum N.D.<br />
C. maculatus N.D.<br />
A. obtectus N.D.<br />
S. zeamais N.D.<br />
IUymg protein<br />
N.D.: Not Detected. HSTI concentration was 37.5 mgyml.<br />
by this <strong>inhibitor</strong>, those <strong>from</strong> P. truncatus and M.<br />
sexta (Table 2). As shown in Fig. 9, all the trypsinlike<br />
<strong>protease</strong> activities <strong>from</strong> P. truncatus were<br />
highly susceptible to this <strong>inhibitor</strong>. HSTI had the<br />
largest <strong>inhibitor</strong>y activity so far reported of any<br />
proteinaceous <strong>protease</strong> <strong>inhibitor</strong> against the<br />
enzymes <strong>from</strong> this important maize consumer<br />
(Table 2, Fig. 8). HSTI was at least twice as<br />
potent as the one reported <strong>from</strong> quinoa, and is<br />
much higher than those of amaranth, tepary beans<br />
and maize. All assays were measured under the<br />
same conditions.<br />
4. Discussion<br />
In the constant search for new sources of proteins<br />
with potential activities in the defense me<strong>chan</strong>ism<br />
of plants, it has been important to investigate<br />
different plants, including those that grow in<br />
restricted areas. In this way, we have been able to<br />
identify several interesting <strong>protease</strong> and amylase<br />
Table 3<br />
Estimated secondary structure content of H. suaveolens trypsin <strong>inhibitor</strong> (HSTI) <strong>from</strong> deconvolution of its circular dichroism spectrum<br />
Helix Strand Other Sum RMS<br />
K2d 0.260 0.160 0.580 ("0.080) 1.000 600<br />
Helix Strand Turn Irregular<br />
Selcon 0.300 ("0.005) 0.182 ("0.003) 0.219 ("0.004) 0.287 ("0.007) 0.988 1450<br />
Contin 0.294 ("0.004) 0.193 ("0.021) 0.186 ("0.025) 0.331 ("0.045) 1.004 360<br />
CDSSTR 0.310 ("0.010) 0.175 ("0.015) 0.195 ("0.015) 0.315 ("0.025) 0.995 250<br />
RMS is a measure of the difference between experimental and reconstructed spectra. Uncertainity in k2d method is the sum of<br />
maximum expected errors in the estimated contents. Uncertainities in the other methods correspond to the intervals containing results<br />
<strong>from</strong> the four different reference sets of spectra used in the analysis.