Gel Filtration Calibration Kit LMW Gel Filtration Calibration Kit HMW
Gel Filtration Calibration Kit LMW Gel Filtration Calibration Kit HMW
Gel Filtration Calibration Kit LMW Gel Filtration Calibration Kit HMW

You also want an ePaper? Increase the reach of your titles
YUMPU automatically turns print PDFs into web optimized ePapers that Google loves.
Table 2. Characteristics of <strong>Gel</strong> <strong>Filtration</strong> <strong>Calibration</strong> <strong>Kit</strong> <strong>HMW</strong><br />
Protein<br />
Molecular<br />
(weight per vial) weight (M r<br />
) Source<br />
Ovalbumin (50 mg) 43 000 Hen egg<br />
Conalbumin (50 mg) 75 000 Chicken egg white<br />
Aldolase 1 (50 mg) 158 000 Rabbit muscle<br />
Ferritin 1 (15 mg) 440 000 Horse spleen<br />
Thyroglobulin (50 mg) 669 000 Bovine thyroid<br />
Blue dextran 2000 (50 mg) 2 000 000<br />
1<br />
These proteins are supplied mixed with sucrose or mannitol to maintain stability and aid their solubility.<br />
High-resolution determination of<br />
molecular weight<br />
The use of gel filtration chromatography for the determination<br />
of the molecular weight and size of proteins is well documented.<br />
The technique is based on the established ability of highresolution<br />
gel filtration media, such as Superdex, Superose and<br />
Sephacryl to separate molecules according to size. Prepacked<br />
columns are available and can be run on chromatography<br />
systems such as, ÄKTAdesign.<br />
Molecular weight determination by gel filtration is carried out<br />
by comparing an elution volume parameter, such as the gel<br />
phase distribution coefficient (K av ) of the protein of interest,<br />
with the values obtained for several known calibration<br />
standards. In practice, a homologous series of globular proteins<br />
have a sigmoid relationship between their elution volume<br />
parameters and the logarithm of their molecular weights (M r<br />
).<br />
The M r of an unknown protein can be determined from the<br />
calibration curve (plot of K av versus log M r ) once its K av value is<br />
calculated from the measured elution volume. For accurate<br />
determination of M r , the calibration standards must have the<br />
same relationship between molecular weight and molecular<br />
size as the substance of interest. GE Healthcare <strong>Calibration</strong> <strong>Kit</strong>s<br />
provide highly purified, well-characterized, globular protein<br />
standards for calibration of gel filtration columns.<br />
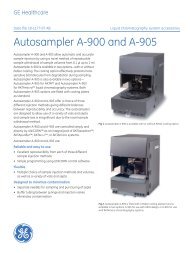
<strong>Calibration</strong> with UNICORN software<br />
<strong>Calibration</strong> of gel filtration columns on ÄKTAdesign systems<br />
can be supported by UNICORN software with the optional<br />
Analysis Module 1 . The Analysis Module automates molecular<br />
weight measurement of unknown proteins from calibration<br />
curves based on proteins of known M r . The curves are<br />
prepared by plotting retention volume data against the<br />
logarithm of the molecular weights of the calibration kit<br />
proteins. Thereafter, molecular weights of unknown proteins<br />
can extrapolated from the curve (Fig 2) together with<br />
calculated correlation and variance.<br />
1<br />
The Analysis Module must be ordered separately and installed after the regular UNICORN installation.<br />
Fig 2. Molecular size table dialog box in the UNICORN software<br />
Analysis Module.<br />
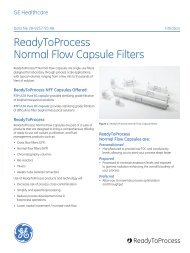
Typical results<br />
Typical calibration results from chromatographic runs and<br />
calculated calibration curves using prepacked Superdex,<br />
Superose and Sephacryl columns are shown in Figures 3 to 11.<br />
The method used for Figures 3 to 11:<br />
Sample:<br />
Proteins from <strong>Gel</strong> <strong>Filtration</strong> <strong>Calibration</strong> <strong>Kit</strong>s<br />
<strong>LMW</strong> and <strong>HMW</strong>:<br />
aprotinin (Apr), RNase A (R), carbonic<br />
anhydrase (CA), ovalbumin (O), conalbumin (C),<br />
aldolase (Ald), ferritin (F) and thyroglobulin (T)<br />
Sample vol.: Figures 3 to 6: 100 μl<br />
Figures 7 to 11:<br />
500 μl<br />
Buffer: 50 mM phosphate buffer, 150 mM NaCl, pH 7.2<br />
Flow rate: Figures 3, 5, 6, 9, 10 and 11: 0.5 ml/min<br />
Figure 4:<br />
0.6 ml/min<br />
Figures 7 and 8:<br />
1.0 ml/min<br />
System: ÄKTAexplorer 10<br />
Detection: 280 nm<br />
400<br />
300<br />
200<br />
100<br />
mAU<br />
F<br />
Ald C<br />
O CA<br />
R<br />
0<br />
0 5 10 15 20 25 ml<br />
Apr<br />
1.00<br />
0.90<br />
0.80<br />
0.70<br />
0.60<br />
0.50<br />
0.40<br />
0.30<br />
0.20<br />
0.10<br />
Kav<br />
Aprotinin<br />
RNase A<br />
Carb. anh<br />
Ovalbumin<br />
0.00<br />
1000 10000 100000<br />
Log M r<br />
Fig 3. Chromatographic separation and calibration curve for the<br />
standard proteins on Tricorn Superdex 200 10/300 GL column.<br />
Conalbumin<br />
Aldolase<br />
Ferritin<br />
1000000<br />
2 Data File 28-4073-84 AA
![[PDF] マニュアル GradiFrac](https://img.yumpu.com/22037825/1/190x253/pdf-gradifrac.jpg?quality=85)
![[PDF] Sample preparation for analysis of protein, peptides and ...](https://img.yumpu.com/21549715/1/190x257/pdf-sample-preparation-for-analysis-of-protein-peptides-and-.jpg?quality=85)
![[PDF] Data File: rProtein A Sepharose Fast Flow](https://img.yumpu.com/21549316/1/190x253/pdf-data-file-rprotein-a-sepharose-fast-flow.jpg?quality=85)
![[PDF] MBP-tagged protein purification](https://img.yumpu.com/21548507/1/184x260/pdf-mbp-tagged-protein-purification.jpg?quality=85)
![[PDF] AKTA ready system Data file](https://img.yumpu.com/21540925/1/190x253/pdf-akta-ready-system-data-file.jpg?quality=85)
![[PDF] Data File - rProtein A/Protein G GraviTrap](https://img.yumpu.com/21539052/1/190x253/pdf-data-file-rprotein-a-protein-g-gravitrap.jpg?quality=85)