Population - Department of Geography • Hunter College - CUNY
Population - Department of Geography • Hunter College - CUNY
Population - Department of Geography • Hunter College - CUNY

Create successful ePaper yourself
Turn your PDF publications into a flip-book with our unique Google optimized e-Paper software.
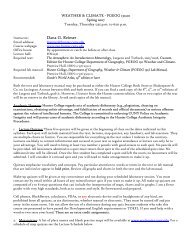
<strong>Hunter</strong> <strong>College</strong> <strong>of</strong> the City University <strong>of</strong> New York<br />
<strong>Department</strong> <strong>of</strong> <strong>Geography</strong><br />
<strong>Geography</strong> <strong>of</strong> New York State<br />
Exercise 14 (REQUIRED)<br />
<strong>Population</strong><br />
Due by November 27, 2012 (late submission may be penalized)<br />
The purpose <strong>of</strong> this exercise is to look at the current population distribution <strong>of</strong> NYS and at some<br />
issues pertaining to the state’s population growth patterns, health and aging. Data from 2010<br />
Census along with the American Community Survey (ACS) and American FactFinder System<br />
which provide updated information from on-going surveys outside <strong>of</strong> the census. Remember, you<br />
can get to the Social Explorer web site that was introduced during the class library session by<br />
going through the <strong>Hunter</strong> <strong>College</strong> Library home page:<br />
http://libguides.library.hunter.cuny.edu/content.php?pid=129327&sid=1109414.<br />
Empire State Development (http://www.empire.state.ny.us/NYSDataCenter.html) is a state corporation<br />
that keeps tabs on the state’s economic development. Its New York State Data Center is<br />
the state’s primary and most comprehensive source for economic and demographic data, tracking<br />
the trends <strong>of</strong> the State <strong>of</strong> New York, its businesses and people. <strong>Population</strong> data goes hand-in-hand<br />
with economic development.<br />
The Cornell Program on Applied Demographics (http://pad.human.cornell.edu/index.cfm) collects<br />
and analyzes NYS demographic data. Use the county data option at this site.<br />
NOTE:<br />
This exercise has FOUR parts relating to various aspects <strong>of</strong> NYS population. Data may<br />
be presented in CHART FORMAT providing the lines and columns for NYS and each<br />
<strong>of</strong> your counties are clearly identified. Use the PERCENT column to compare county data<br />
to each other and to New York State.<br />
CAUTION:<br />
Please clearly label your answers using Part and Question numbers along with any supporting<br />
documents AND remember to do all 4 parts. You must write out in paragraph<br />
format any analysis requested.<br />
Many <strong>of</strong> census reports are LARGE files. For example, the one for NYS is<br />
558 pages long!! If you must print, SELECT A SPECIFIC PAGE SPREAD before you<br />
hit the print button.<br />
HELPFUL LINKS:<br />
Complete NYS report (558 pages long) is found at:<br />
http://www.empire.state.ny.us/NYSDataCenter/Data/Census2010/Pr<strong>of</strong>iles/NY_050_2010_PROFILE.pdf<br />
Individual county files:<br />
http://www.empire.state.ny.us/NYSDataCenter/Data/Census2010/IndividualCountyFiles100Data2010.html<br />
County census data from 1790 to 1990:<br />
http://www.empire.state.ny.us/NYSDataCenter/Data/<strong>Population</strong>_Housing/CountyPopHistory.pdf<br />
1
ASSIGNMENT<br />
PART I – <strong>Population</strong> Change<br />
For Census 2010 data go to http://www.empire.state.ny.us/NYSDataCenter.html, the NYS Data<br />
Center website. Direct link: http://www.empire.state.ny.us/NYSDataCenter/Census2010.html<br />
Do QI-1, QI-2, QI-3 and Q1-4 on the map. Get the map for Q1-4 from the home<br />
page or photocopy the one in your syllabus:<br />
(http://www.geo.hunter.cuny.edu/courses/geog260/NYS%20County%20Outline%20Map%20with%20names.pdf)<br />
QI-1. Title the map: “Percentage Change in <strong>Population</strong> 2000-2010.”<br />
a. Outline your three counties on the map.<br />
b. Go to https://www.dot.ny.gov/divisions/policy-and-strategy/darb/daiunit/ttss/repository/CensusPop2010_PL94-171county.pdf.<br />
Scroll down to<br />
view all counties. For this question, you must include the 5 counties <strong>of</strong> NYC<br />
in your survey<br />
1. Shade in yellow the state’s 10 most populous counties in 2010.<br />
2. Shade in blue the state’s 10 least populous counties in 2010.<br />
3. Use a plus sign (+) to indicate the five (5) counties within NYS<br />
with the largest percentage increase in population between<br />
2000 and 2010.<br />
4. Use the letter X (x) to indicate the five (5) counties within NYS<br />
with the largest percentage decrease in population between<br />
2000 and 2010.<br />
QI-2. For each <strong>of</strong> your three counties, place the percentage difference in growth within<br />
county boundaries on the map.<br />
QI-3. Note the percentage increase for NYS as a whole on the side <strong>of</strong> the map.<br />
QI-4. Add a key to your map.<br />
PART II – <strong>Population</strong> Characteristics<br />
Census data:<br />
http://www.empire.state.ny.us/NYSDataCenter/Data/Census2010/Pr<strong>of</strong>iles/NY_050_2010_PROFILE.pdf<br />
Use the + sign on the PDF to increase the size <strong>of</strong> the print.<br />
NY Times Interactive Census Map: http://projects.nytimes.com/census/2010/map: To see NYS counties<br />
in “% change”, set the sliding scale to the 4 th line from the left. Slide the cursor over the state<br />
to call up data for your counties.<br />
Another helpful site is<br />
http://www.empire.state.ny.us/NYSDataCenter/Data/<strong>Population</strong>_Housing/2008County<strong>Population</strong>Esti<br />
matesbyAgeandSex.pdf.<br />
QII-1. List your three counties from largest to smallest with their 2010 headcounts.<br />
QII-2. a) Which one <strong>of</strong> your counties has the oldest population by percentage?<br />
b) Which has the youngest by percentage?<br />
QII-3. List your counties by largest to smallest percent <strong>of</strong> population in each <strong>of</strong> the following<br />
categories:<br />
a) under 5 to 14 years category<br />
b) 65 yrs and over category<br />
QII-4. Provide Race/Ethnicity data for each county showing % share <strong>of</strong> 2010 population<br />
and % change from 2000 census.<br />
2
QII-5.<br />
a) Provide a copy <strong>of</strong> the 2000, 2010 and 2020 pyramids for NYS and for<br />
each <strong>of</strong> your counties. Attach it or incorporate it into your analysis <strong>of</strong><br />
change below. (Do this by studying the population pyramids for your counties<br />
and NYS at http://pad.human.cornell.edu/counties/projections.cfm. Click<br />
on the YEAR buttons: 1990, 2000, 2010 2015, 2020, etc and observe the<br />
change in shape. Scroll down the page to view numbers. The first three are<br />
based on census figures; the rest are guestimates.)<br />
b) Write a statement comparing the changing population <strong>of</strong> your counties<br />
based census data and the changing shapes <strong>of</strong> the pyramids.<br />
QII-6.<br />
a) For each <strong>of</strong> your counties select four entries below the “<strong>Population</strong>” headings<br />
as follows: from the US Census Quick Facts page at<br />
http://quickfacts.census.gov/qfd/states/36000.html select two from People<br />
Category and two from Business Category.<br />
First look over the New York State Quick Facts data that is compared to the<br />
data for the United States. [The circled question marks to the left explain each<br />
line.] Then do the same for your three counties comparing the data to that <strong>of</strong><br />
NYS. [Use the drop down box to select your counties; you can also use the index<br />
map at http://quickfacts.census.gov/qfd/maps/new_york_map.html.]<br />
b) In chart format, compare the data from your 3 counties to the US and<br />
NYS averages. Make a statement noting any similarities and differences between<br />
the counties, the State and the US by comparing the data (percentage)<br />
the same data for the five units.<br />
PART III – Aging<br />
The NYS <strong>Department</strong> <strong>of</strong> Aging (NYSOFA) site is at http://www.aging.ny.gov/.<br />
Read the Executive Summary <strong>of</strong> the NYSOFA Four Year Plan (2007-2011) on Aging at the following<br />
sites:<br />
http://www.aging.ny.gov/NYSOFA/4YearPlan/FourYearPlan-ExecutiveSummary.doc<br />
http://www.aging.ny.gov/NYSOFA/4YearPlan/4YearPlan-FinalAppendix8-20-07_1.doc<br />
QIII-1. Go to http://www.aging.ny.gov/ReportsAndData/CountyDataBooks/index.cfm and review each<br />
<strong>of</strong> the 5 page reports for NYS and your three counties.<br />
a) Compare the trends in your three counties with that <strong>of</strong> NYS. Then make<br />
a statement comparing the 4 data books.<br />
b) Which one <strong>of</strong> your counties is likely to experience the largest growth <strong>of</strong><br />
people in the 60+ group category?<br />
QIII-2. Go to http://www.aging.ny.gov/NYSOFA/LocalOffices.cfm. Scroll down to get information<br />
from your county’s Office <strong>of</strong> Aging. (If you are directed to the county’s home page,<br />
type “aging” into the search box <strong>of</strong> the home page.)<br />
a) Give a summary <strong>of</strong> the older population situation found in each <strong>of</strong> your<br />
counties.<br />
b) Indicate what each county is doing for their older citizens.<br />
3
PART IV - Health<br />
Go to the NYS <strong>Department</strong> <strong>of</strong> Health site at http://www.health.state.ny.us. On the lower right side<br />
bar, click on Statistics and Data then scroll down to County Health Indicator Pr<strong>of</strong>iles (CHIP).<br />
Click on it to see the map <strong>of</strong> counties.<br />
Review the pr<strong>of</strong>ile for each <strong>of</strong> your counties. You can also use the Tables at the end <strong>of</strong> the Vital<br />
Statistics list. Review the NYS Health Indicator Pr<strong>of</strong>ile (last on the list).<br />
QIV-1. List the major illnesses that are prevalent in your three counties. (Be sure to<br />
look at the headcount in addition to percent to see the categories with the great number<br />
<strong>of</strong> affected people.)<br />
QIV-2. Compare your three county pr<strong>of</strong>iles to NYS’s pr<strong>of</strong>ile by making a statement<br />
as to how they are they similar or different from that <strong>of</strong> NYS.<br />
QIV-3. List the forms <strong>of</strong> cancer that have an above average occurrence and a below<br />
average occurrence in your three counties. Find the information by going to<br />
http://www.health.state.ny.us/statistics. Click on the Cancer Registry link on the left side<br />
bar and to go to that site. Then click on maps <strong>of</strong> Cancer Incidents by County link.<br />
QIV-4. Find and discuss similar information for two non-cancer illnesses or conditions,<br />
such as asthma or West Nile disease on the Statistics and Data page or through the<br />
“A-Z Index” tab at the top, or Diseases and Conditions button on the right side bar.<br />
QIV-5. Compare the health care coverage in your three counties. Select any two categories<br />
for the three county comparisons.<br />
See the Annual New York Physician Workforce Pr<strong>of</strong>ile, 2010 ed. at<br />
http://chws.albany.edu/archive/uploads/2012/07/nyphyspr<strong>of</strong>ile2010.pdf<br />
This VERY LONG report provides detailed pr<strong>of</strong>iles <strong>of</strong> New York's physician workforce by<br />
specialty, specialty group, county, and region, including urban and rural counties. It covers<br />
age distribution, active patient care FTEs per 100,000 people, percent underrepresented<br />
minority, health status indicators, and more by county.<br />
Also look over the short report from the Healthcare Association <strong>of</strong> New York State: The<br />
Doctor Can’t See You Now: Results <strong>of</strong> HANYS’ Physician Advocacy Survey (2011).<br />
Check the maps to see if any <strong>of</strong> your counties are mentioned.<br />
If so, note the categories in your response and the possible implication for the future.<br />
The report is located at http://www.hanys.org/communications/publications/2011/2012-01-<br />
18_physician_survey_results_2011_electronic.pdf<br />
©AFG/1112<br />
4