Comparison of spirometry criteria for the diagnosis of COPD ... - GOLD
Comparison of spirometry criteria for the diagnosis of COPD ... - GOLD
Comparison of spirometry criteria for the diagnosis of COPD ... - GOLD

Create successful ePaper yourself
Turn your PDF publications into a flip-book with our unique Google optimized e-Paper software.
Eur Respir J 2009; 34: 588–597<br />
DOI: 10.1183/09031936.00164608<br />
CopyrightßERS Journals Ltd 2009<br />
<strong>Comparison</strong> <strong>of</strong> <strong>spirometry</strong> <strong>criteria</strong> <strong>for</strong> <strong>the</strong><br />
<strong>diagnosis</strong> <strong>of</strong> <strong>COPD</strong>: results from <strong>the</strong> BOLD<br />
study<br />
W.M. Vollmer*, þ. Gíslason # , P. Burney " , P.L. Enright + , A. Gulsvik 1 ,<br />
A. Kocabas e and A.S. Buist** <strong>for</strong> <strong>the</strong> BOLD Collaborative Research Group<br />
ABSTRACT: Published guidelines recommend <strong>spirometry</strong> to accurately diagnose chronic<br />
obstructive pulmonary disease (<strong>COPD</strong>). However, even <strong>spirometry</strong>-based <strong>COPD</strong> prevalence<br />
estimates can vary widely. We compared properties <strong>of</strong> several <strong>spirometry</strong>-based <strong>COPD</strong><br />
definitions using data from <strong>the</strong> international Burden <strong>of</strong> Obstructive Lung Disease (BOLD)study.<br />
14 sites recruited population-based samples <strong>of</strong> adults aged o40 yrs. Procedures included<br />
standardised questionnaires and post-bronchodilator <strong>spirometry</strong>. 10,001 individuals provided<br />
usable data.<br />
Use <strong>of</strong> <strong>the</strong> lower limit <strong>of</strong> normal (LLN) <strong>for</strong>ced expiratory volume in 1 s (FEV1) to <strong>for</strong>ced vital<br />
capacity (FVC) ratio reduced <strong>the</strong> age-related increases in <strong>COPD</strong> prevalence that are seen among<br />
healthy never-smokers when using <strong>the</strong> fixed ratio criterion (FEV1/FVC ,0.7) recommended by <strong>the</strong><br />
Global Initiative <strong>for</strong> Chronic Obstructive Lung Disease. The added requirement <strong>of</strong> an FEV1 ei<strong>the</strong>r<br />
,80% predicted or below <strong>the</strong> LLN fur<strong>the</strong>r reduced age-related increases and also led to <strong>the</strong> least<br />
site-to-site variability in prevalence estimates after adjusting <strong>for</strong> potential confounders. Use <strong>of</strong> <strong>the</strong><br />
FEV1/FEV6 ratio in place <strong>of</strong> <strong>the</strong> FEV1/FVC yielded similar prevalence estimates.<br />
Use <strong>of</strong> <strong>the</strong> FEV1/FVC,LLN criterion instead <strong>of</strong> <strong>the</strong> FEV1/FVC ,0.7 should minimise known age<br />
biases and better reflect clinically significant irreversible airflow limitation. Our study also<br />
supports <strong>the</strong> use <strong>of</strong> <strong>the</strong> FEV1/FEV6 as a practical substitute <strong>for</strong> <strong>the</strong> FEV1/FVC.<br />
KEYWORDS: Adult, chronic obstructive pulmonary disease, epidemiology<br />
Although chronic obstructive pulmonary<br />
disease (<strong>COPD</strong>) is recognised as a major<br />
public health problem worldwide, estimates<br />
<strong>of</strong> its prevalence vary widely [1]. Much <strong>of</strong><br />
this variation probably reflects differences in <strong>the</strong><br />
populations studied, <strong>spirometry</strong> methods and<br />
data quality control, and <strong>the</strong> rules used to define<br />
<strong>COPD</strong>. For example, self-reported physician<br />
<strong>diagnosis</strong> <strong>of</strong> <strong>COPD</strong> typically results in estimated<br />
prevalences well below those obtained based on<br />
<strong>spirometry</strong> [1, 2].<br />
Although no gold standard definition <strong>of</strong> <strong>COPD</strong><br />
exists, published guidelines recommend use <strong>of</strong><br />
<strong>spirometry</strong> to define it [3, 4]. However, even<br />
<strong>spirometry</strong>-based <strong>COPD</strong> prevalence estimates can<br />
vary by two-fold or more, depending on <strong>the</strong><br />
definition used to classify mild disease [5, 6]. The<br />
most widely used definition comes from <strong>the</strong><br />
Global Initiative <strong>for</strong> Chronic Obstructive Lung<br />
For editorial comments see page 527.<br />
This article has online supplementary material available from www.erj.ersjournals.com<br />
Disease (<strong>GOLD</strong>), which recommends using a<br />
post-bronchodilator <strong>for</strong>ced expiratory volume in<br />
1s(FEV1) to <strong>for</strong>ced vital capacity (FVC) ratio ,0.7<br />
to define irreversible airflow limitation, and <strong>the</strong><br />
FEV1 to stage disease [3]. This ‘‘fixed ratio’’<br />
approach, while easy to apply, appears to overestimate<br />
<strong>COPD</strong> in older individuals [2, 7–10] and<br />
to underestimate it in young adults [9, 11].<br />
Alternative definitions that account <strong>for</strong> normal<br />
ageing can alleviate this bias [9, 12] but, in turn, this<br />
raises questions about which reference equations<br />
are appropriate <strong>for</strong> which populations. In addition,<br />
if pre- (ra<strong>the</strong>r than post-) bronchodilator <strong>spirometry</strong><br />
is used, <strong>COPD</strong> prevalence may be overestimated<br />
by as much as 30% [8, 10, 13, 14].<br />
The Burden <strong>of</strong> Obstructive Lung Disease (BOLD)<br />
study is an international ef<strong>for</strong>t to collect populationbased<br />
estimates <strong>of</strong> <strong>the</strong> prevalence and economic<br />
burden <strong>of</strong> <strong>COPD</strong> using standardised methods<br />
AFFILIATIONS<br />
*Kaiser Permanente, Center <strong>for</strong><br />
Health Research, Portland, OR<br />
+ The University <strong>of</strong> Arizona, Tucson,<br />
AZ, and<br />
**Oregon Health & Science<br />
University, Portland, OR, USA.<br />
# University <strong>of</strong> Iceland, Medical<br />
Faculty, Landspitali University<br />
Hospital, Reykjavik, Iceland.<br />
" National Heart and Lung Institute,<br />
Imperial College, London, UK.<br />
1 Institute <strong>of</strong> Medicine, University <strong>of</strong><br />
Bergen, Bergen, Norway.<br />
e Cukurova University School <strong>of</strong><br />
Medicine, Balcali, Adana, Turkey.<br />
CORRESPONDENCE<br />
W.M. Vollmer<br />
Center <strong>for</strong> Health Research<br />
3800 N Interstate Ave<br />
Portland<br />
OR<br />
97227-1110<br />
USA<br />
E-mail: william.vollmer@kpchr.org<br />
Received:<br />
Oct 30 2008<br />
Accepted after revision:<br />
April 27 2009<br />
First published online:<br />
May 21 2009<br />
European Respiratory Journal<br />
Print ISSN 0903-1936<br />
Online ISSN 1399-3003<br />
588 VOLUME 34 NUMBER 3 EUROPEAN RESPIRATORY JOURNAL
W.M. VOLLMER ET AL.<br />
<strong>COPD</strong> AND SMOKING-RELATED DISORDERS<br />
[15, 16]. Using BOLD study data, we examined <strong>the</strong> impact on<br />
prevalence estimates <strong>of</strong> using <strong>the</strong> fixed ratio criterion versus<br />
various o<strong>the</strong>r <strong>spirometry</strong>-based definitions <strong>of</strong> <strong>COPD</strong>. We also<br />
compare <strong>the</strong> effects <strong>of</strong> using central versus site-specific<br />
prediction equations and <strong>of</strong> using <strong>the</strong> FEV1/FEV6 ratio in<br />
place <strong>of</strong> FEV1/FVC.<br />
METHODS AND MATERIALS<br />
The design <strong>of</strong> <strong>the</strong> BOLD study is described in detail elsewhere<br />
[15, 16] and only summarised here. Participating entities in <strong>the</strong><br />
BOLD Collaborative Research Group are listed in <strong>the</strong> online<br />
supplement.<br />
Population<br />
Participating sites were expected to recruit population-based<br />
samples <strong>of</strong> o600 noninstitutionalised adults aged o40 yrs. We<br />
report data from <strong>the</strong> first 14 BOLD sites (table 1), consisting <strong>of</strong><br />
10,001 individuals (93% <strong>of</strong> all responders) with acceptable<br />
post-bronchodilator <strong>spirometry</strong>. Each site obtained approval<br />
from local ethical committees and written in<strong>for</strong>med consent<br />
from each participant.<br />
Questionnaires<br />
Questionnaires were administered by trained and certified<br />
staff and covered respiratory symptoms, smoking history,<br />
respiratory diagnoses and comorbidities. We defined packyears<br />
<strong>of</strong> cigarette smoking exposure as average number <strong>of</strong><br />
packs smoked per day (20 cigarettes per pack) multiplied by<br />
<strong>the</strong> number <strong>of</strong> years smoked. Never-smoking was defined as<br />
,20 packs <strong>of</strong> cigarettes in a lifetime.<br />
Site-specific prediction equations were developed using neversmokers<br />
who had never been told by a healthcare provider that<br />
<strong>the</strong>y had emphysema, <strong>COPD</strong> or tuberculosis, and did not<br />
report a current <strong>diagnosis</strong> <strong>of</strong> asthma or chronic bronchitis. We<br />
were unable to restrict to asymptomatic never-smokers due to<br />
<strong>the</strong> extremely small numbers <strong>of</strong> (particularly male) neversmokers<br />
at some sites.<br />
Height and weight<br />
We measured height (to <strong>the</strong> nearest centimetre) with <strong>the</strong><br />
participant standing on a firm, level surface that was<br />
perpendicular to <strong>the</strong> vertical board <strong>of</strong> <strong>the</strong> height measurement<br />
device (ideally a wall-mounted stadiometer). Participants were<br />
TABLE 1<br />
Summary <strong>of</strong> Burden <strong>of</strong> Obstructive Lung Disease (BOLD) study sites included in <strong>the</strong> analysis<br />
Site Target population Sampling design Respondents #<br />
n<br />
Response<br />
rate " %<br />
Cooperation<br />
rate + %<br />
Guangzhou, China Residents <strong>of</strong> <strong>the</strong> Number Two Community Center <strong>of</strong> Stratified random sample 602 87 87<br />
<strong>the</strong> Liwan district <strong>of</strong> <strong>the</strong> city <strong>of</strong> Guangzhou<br />
Adana, Turkey<br />
Residents <strong>of</strong> all districts (urban and rural) that Stratified cluster sample 875 82 85<br />
make up <strong>the</strong> Adana province<br />
Salzburg, Austria Residents <strong>of</strong> Salzburg County Stratified random sample 1349 65 67<br />
Cape Town, South Residents <strong>of</strong> <strong>the</strong> towns <strong>of</strong> Ravensmead and Uitsig, Cluster sample 896 63 68<br />
Africa<br />
both located in <strong>the</strong> general Tygerberg area<br />
Reykjavik, Iceland<br />
All age-eligible Icelandic citizens living in<br />
Simple random sample 758 81 84<br />
Reykjavik and surrounding suburbs<br />
Hanover, Germany Residents <strong>of</strong> Hanover city and four <strong>of</strong> <strong>the</strong> 20 Stratified random sample 713 59 61<br />
town councils that make up <strong>the</strong> rest <strong>of</strong><br />
Hanover region<br />
Krakow, Poland<br />
Residents <strong>of</strong> <strong>the</strong> Chrzanów and Proszowice Stratified random sample 603 78 79<br />
regions within <strong>the</strong> Malopolska district <strong>of</strong> Poland<br />
Bergen, Norway Residents <strong>of</strong> <strong>the</strong> city <strong>of</strong> Bergen Stratified random sample 707 68 71<br />
Vancouver, BC,<br />
Residents <strong>of</strong> <strong>the</strong> Vancouver Health<br />
Random digit dialling 856 26 51<br />
Canada<br />
Service Delivery Area <strong>of</strong> Vancouver<br />
Lexington, KY, USA<br />
Residents <strong>of</strong> <strong>the</strong> fifth congressional<br />
Random digit dialling 563 14 27<br />
district <strong>of</strong> Kentucky<br />
Manila, Philippines<br />
Residents <strong>of</strong> one <strong>of</strong> <strong>the</strong> six districts that<br />
Cluster sample 918 58 58<br />
make up <strong>the</strong> city <strong>of</strong> Manila<br />
Sydney, Australia Residents <strong>of</strong> <strong>the</strong> federal electorates, Kings<strong>for</strong>d Stratified random sample 585 25 33<br />
Smith and Barton, which make up <strong>the</strong> sou<strong>the</strong>rn<br />
beachside suburbs <strong>of</strong> Sydney<br />
London, UK<br />
The patients served by three general practitioners Stratified random sample 697 17 37<br />
from West London, which is broadly representative<br />
<strong>of</strong> <strong>the</strong> Hammersmith and Fulham neighbourhood<br />
<strong>of</strong> West London<br />
Uppsala, Sweden Residents <strong>of</strong> <strong>the</strong> city <strong>of</strong> Uppsala Stratified random sample 588 61 63<br />
# : participants with core questionnaire and any post-bronchodilator <strong>spirometry</strong>; " : denominator includes persons <strong>of</strong> unknown eligibility status who could not be contacted<br />
(only known ineligible participants were excluded); + : denominator includes only participants who were contacted and eligible.<br />
c<br />
EUROPEAN RESPIRATORY JOURNAL VOLUME 34 NUMBER 3 589
<strong>COPD</strong> AND SMOKING-RELATED DISORDERS<br />
W.M. VOLLMER ET AL.<br />
TABLE 2<br />
Definitions <strong>of</strong> chronic obstructive pulmonary disease (<strong>COPD</strong>) used in this analysis<br />
Threshold <strong>for</strong> <strong>COPD</strong><br />
Formula<br />
Fixed ratio<br />
LLN (FEV1/FVC)<br />
<strong>GOLD</strong> stages 2–4<br />
LLN (FEV1/FVC) and FEV1 ,80% pred<br />
LLN (FEV1/FVC) and LLN (FEV1)<br />
LLN (FEV1/FEV6) and FEV1 ,80% pred<br />
FEV1/FVC ,0.7 (<strong>GOLD</strong> stage 1 or higher)<br />
FEV1/FVC ,5th percentile (predicted FEV1/FVC minus 1.6456SD)<br />
FEV1/FVC ,0.7 and FEV1 ,80% pred<br />
FEV1/FVC ,5th percentile and FEV1 ,80% pred<br />
FEV1/FVC ,5th percentile and FEV1 ,5th percentile<br />
FEV1/FEV6 ,5th percentile and FEV1 ,80% pred<br />
For all but <strong>the</strong> fixed ratio, alternative versions may be computed based on choice <strong>of</strong> prediction equation. This table just describes general <strong>for</strong>mulas. FEV1: <strong>for</strong>ced<br />
expiratory volume in 1 s; FVC: <strong>for</strong>ced vital capacity; <strong>GOLD</strong>: Global Initiative <strong>for</strong> Chronic Obstructive Lung Disease; LLN: lower limit <strong>of</strong> normal; % pred: % predicted; FEV6:<br />
<strong>for</strong>ced expiratory volume in 6 s.<br />
instructed to remove <strong>the</strong>ir shoes and stand erect with feet flat<br />
on <strong>the</strong> floor, heels toge<strong>the</strong>r, and head in <strong>the</strong> horizontal<br />
(Frank<strong>for</strong>t) plane.<br />
Sites used calibrated scales (preferably balance beam or digital)<br />
to measure weight to <strong>the</strong> nearest 0.1 kg. Participants were<br />
instructed to remove shoes, hats, coats, and heavy items in<br />
<strong>the</strong>ir pockets in order to be weighed in light indoor clothing.<br />
Body mass index (BMI) was computed as weight over heightsquared<br />
and expressed in units <strong>of</strong> kg?m -2 .<br />
Spirometry<br />
Lung function data were collected using <strong>the</strong> ndd EasyOne<br />
Spirometer (ndd Medical Technologies, Zurich, Switzerland),<br />
which was chosen <strong>for</strong> its portability and level <strong>of</strong> accuracy [17].<br />
Lung function was measured be<strong>for</strong>e and 15 min after administration<br />
<strong>of</strong> 200 mg <strong>of</strong> albuterol/salbutamol. Spirometry measures<br />
reported here include <strong>the</strong> FEV1, FEV6 and FVC, as well as<br />
<strong>the</strong> FEV1/FVC and FEV1/FEV6 ratios. FEV1 % predicted,<br />
although not reported separately, was used to stage <strong>COPD</strong> [3].<br />
All spirograms were reviewed by <strong>the</strong> BOLD Pulmonary<br />
Function Reading Center and assigned an overall quality score<br />
based on standardised <strong>criteria</strong> [18]. Local <strong>spirometry</strong> technicians<br />
were trained and certified, and received regular quality<br />
control feedback during data collection. Usable <strong>spirometry</strong> was<br />
defined as two or more acceptable blows, with FEV1 and FVC<br />
repeatability within 200 mL. Acceptable manoeuvres were<br />
defined as those with a rapid start (back-extrapolated volume<br />
,150 mL or ,5% <strong>of</strong> <strong>the</strong> FVC), lack <strong>of</strong> a cough during <strong>the</strong> first<br />
second, and a small end-<strong>of</strong>-test volume (,40 mL during <strong>the</strong><br />
final second). The calibration <strong>of</strong> all spirometers was verified to<br />
be accurate within 3.0% using a 3.00 L syringe at <strong>the</strong> beginning<br />
<strong>of</strong> each day <strong>of</strong> testing. Biological controls were not used.<br />
Definition <strong>of</strong> <strong>COPD</strong><br />
The BOLD study uses <strong>the</strong> <strong>GOLD</strong> <strong>criteria</strong> <strong>for</strong> defining and<br />
staging <strong>COPD</strong> [3], which are consistent with <strong>the</strong> 2004 American<br />
Thoracic Society (ATS)/European Respiratory Society (ERS)<br />
<strong>criteria</strong> [4] and define <strong>COPD</strong> as a post-bronchodilator FEV1/<br />
FVC ,0.70. The FEV1 % pred is used to fur<strong>the</strong>r stage disease<br />
(FEV1 o80% pred: stage 1; o50 and ,80% pred: stage 2; o30<br />
and ,50% pred: stage 3; ,30% pred: stage 4). The BOLD study<br />
also uses <strong>the</strong> prediction equations <strong>for</strong> Caucasian adult males<br />
and females derived from <strong>the</strong> Third US National Health and<br />
Nutrition Examination Survey (NHANES-III) [19] as its primary<br />
reference equations <strong>for</strong> all participants, although this paper also<br />
examined <strong>the</strong> impact <strong>of</strong> using equations derived from Norway’s<br />
Hordaland County Respiratory Health Study [20], as well as<br />
site-specific prediction equations, in place <strong>of</strong> <strong>the</strong> NHANES-III<br />
equations.<br />
In addition, we assessed <strong>the</strong> impact <strong>of</strong> restricting <strong>COPD</strong> to<br />
<strong>GOLD</strong> stages 2 or above, and <strong>of</strong> using <strong>the</strong> lower limit <strong>of</strong> normal<br />
(LLN) <strong>of</strong> <strong>the</strong> FEV1/FVC, and <strong>the</strong> FEV1 in place <strong>of</strong> <strong>the</strong> fixed ratio<br />
and <strong>the</strong> FEV1 ,80% pred <strong>criteria</strong>, in <strong>the</strong> <strong>GOLD</strong> definitions.<br />
Finally, we examined <strong>the</strong> impact <strong>of</strong> using FEV1/FEV6 in place <strong>of</strong><br />
FEV1/FVC in our definitions. Table 2 summarises <strong>the</strong> various<br />
definitions <strong>of</strong> <strong>COPD</strong> assessed in this manuscript.<br />
Although <strong>the</strong> text focuses on post-bronchodilator <strong>spirometry</strong>,<br />
<strong>the</strong> results <strong>of</strong> comparable analyses based on pre-bronchodilator<br />
data are included in <strong>the</strong> online supplementary material.<br />
Analysis<br />
To provide comparability with earlier reports [16], <strong>the</strong> sitespecific<br />
prevalences presented in figure 1 are population-based<br />
estimates reflecting sampling designs used at each site. For all<br />
o<strong>the</strong>r analyses, data are pooled across sites and presented as<br />
unweighted prevalences with standard errors accounting only<br />
<strong>for</strong> correlations within <strong>the</strong> site and, where applicable, <strong>for</strong><br />
clustering in <strong>the</strong> sampling plan. <strong>Comparison</strong>s <strong>of</strong> <strong>the</strong> prevalence<br />
estimates in figures 1–3 and in table 3 were computed using<br />
McNemar’s test.<br />
A desired characteristic <strong>of</strong> any prevalence estimator is that it<br />
gives comparable estimates in different populations after<br />
adjusting <strong>for</strong> known confounders. In order to compare <strong>the</strong><br />
residual site-to-site variability associated with our various<br />
prevalence estimators, we report <strong>the</strong> Wald statistic <strong>for</strong> <strong>the</strong><br />
‘‘site’’ effect, as derived from logistic regression models that<br />
adjusted <strong>for</strong> age (40–49, 50–59, 60–69 and o70 yrs), sex,<br />
cigarette smoking history (never-smokers, 0–9, 10–19 and<br />
o20 pack-yrs), BMI (,20, 20–25, 25–30, 30–35 and<br />
.35 kg?m -2 ), years worked in a dusty job (0, 1–9 and<br />
o10 yrs) and interactions <strong>of</strong> sex with both age and smoking<br />
history. We also report Wald statistics <strong>for</strong> testing <strong>the</strong><br />
significance <strong>of</strong> age in selected regression models. Where<br />
appropriate, we tested heterogeneity <strong>of</strong> age effects across<br />
strata using appropriate interaction terms. Under <strong>the</strong> null<br />
hypo<strong>the</strong>sis <strong>of</strong> no effect, <strong>the</strong> Wald statistic will have an F-<br />
590 VOLUME 34 NUMBER 3 EUROPEAN RESPIRATORY JOURNAL
W.M. VOLLMER ET AL.<br />
<strong>COPD</strong> AND SMOKING-RELATED DISORDERS<br />
a)<br />
30<br />
25<br />
Prevalence %<br />
20<br />
15<br />
10<br />
5<br />
0<br />
Guangzhou Adana<br />
Salzburg Reykjavik<br />
Cape<br />
Town<br />
Krakow<br />
Hanover<br />
Bergen Vancouver<br />
Manila<br />
Lexington Sydney<br />
London<br />
Uppsala<br />
b)<br />
30<br />
25<br />
Prevalence %<br />
20<br />
15<br />
10<br />
5<br />
0<br />
Fixed ratio<br />
LLN (ratio)<br />
<strong>GOLD</strong> stages<br />
2–4<br />
LLN (ratio) and<br />
FEV1
<strong>COPD</strong> AND SMOKING-RELATED DISORDERS<br />
W.M. VOLLMER ET AL.<br />
30<br />
30<br />
25<br />
■<br />
25<br />
■<br />
Prevalence %<br />
20<br />
15<br />
10<br />
5<br />
0<br />
▲<br />
■<br />
■<br />
▲<br />
■<br />
■<br />
■<br />
●<br />
▲<br />
●<br />
●<br />
●▲<br />
40–49 50–59 60–69 ≥70<br />
Age group yrs<br />
▲ ▲<br />
■<br />
▲<br />
▲<br />
Prevalence %<br />
20<br />
15<br />
10<br />
5<br />
0<br />
■<br />
▲<br />
◆■<br />
▲<br />
■<br />
◆<br />
40–49 50–59 60–69 ≥70<br />
Age group yrs<br />
▲<br />
◆<br />
▲<br />
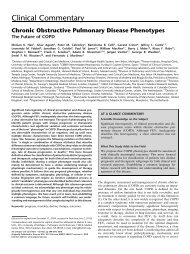
FIGURE 2. Prevalence <strong>of</strong> ‘‘chronic obstructive pulmonary disease’’ among<br />
healthy never-smokers in <strong>the</strong> Burden <strong>of</strong> Obstructive Lung Disease (BOLD) study<br />
(data from all sites combined). Wald statistics <strong>for</strong> comparing <strong>the</strong> four age groups<br />
(and adjusted <strong>for</strong> site, sex, body mass index and years worked in a dusty job)<br />
ranged from 62.6 <strong>for</strong> <strong>the</strong> fixed ratio criterion, to 24.5 <strong>for</strong> Global Initiative <strong>for</strong> Chronic<br />
Obstructive Lung Disease (<strong>GOLD</strong>) stages 2–4, to ,6.6 <strong>for</strong> <strong>the</strong> two analogues <strong>of</strong><br />
<strong>the</strong>se <strong>criteria</strong> in which <strong>the</strong> <strong>for</strong>ced expiratory volume in 1 s (FEV1) to <strong>for</strong>ced vital<br />
capacity (FVC) ratio ,0.7 is replaced by FEV1/FVC,LLN (lower limit <strong>of</strong> normal), to<br />
3.4 <strong>for</strong> <strong>the</strong> ‘‘LLN (FEV1/FVC) and LLN (FEV1)’’ <strong>criteria</strong>. All were statistically<br />
significant. Significant sex–age interactions were observed only <strong>for</strong> <strong>the</strong> fixed ratio<br />
criterion. Except <strong>for</strong> <strong>the</strong> LLN (ratio) criterion <strong>for</strong> <strong>the</strong> lowest age group (p50.14), <strong>the</strong><br />
fixed ratio prevalence estimates were all significantly greater than those <strong>for</strong> each <strong>of</strong><br />
<strong>the</strong> o<strong>the</strong>r estimators (p,0.0001). &: fixed ratio; h: LLN (ratio); n: <strong>GOLD</strong> stages 2–<br />
4; .: LLN (ratio) and FEV1 ,80% predicted; $: LLN (ratio) and LLN (FEV1).<br />
All prevalences reported in figure 1 were lower than <strong>the</strong>y<br />
would have been had we based <strong>the</strong>m on pre-bronchodilator<br />
measurements (see online supplementary material). For <strong>the</strong><br />
fixed ratio criterion, absolute declines between pre- and postbronchodilator<br />
values ranged from 1 to 11 percentage points<br />
across centres, while using <strong>GOLD</strong> stages 2–4 instead <strong>of</strong> <strong>the</strong><br />
fixed ratio criterion led to a decline in prevalence ranging from<br />
1 to 6 percentage points across centres. On a relative basis,<br />
prevalence estimates declined between 25% to 29% (depending<br />
on <strong>the</strong> definition used) across <strong>the</strong> five measures in going from<br />
pre- to post-bronchodilator measurements.<br />
The prevalence <strong>of</strong> ‘‘<strong>COPD</strong>’’ per <strong>the</strong> fixed ratio criterion<br />
increased sharply with age even among healthy never-smokers<br />
(fig. 2), a population in which <strong>COPD</strong> is expected to be rare. By<br />
contrast, <strong>for</strong> <strong>the</strong> o<strong>the</strong>r measures we observed much more<br />
muted increases with age and, except <strong>for</strong> <strong>the</strong> LLN (ratio)<br />
criterion <strong>for</strong> <strong>the</strong> lowest age group (p50.14), <strong>the</strong> fixed ratio<br />
prevalence estimates were all significantly greater than those<br />
<strong>for</strong> each <strong>of</strong> <strong>the</strong> o<strong>the</strong>r estimators (p,0.0001). These age-related<br />
increases in prevalence were lowest <strong>for</strong> <strong>the</strong> ‘‘LLN (FEV1/FVC)<br />
and LLN (FEV1)’’ and ‘‘LLN (FEV1/FVC) and FEV1 ,80%<br />
pred’’ <strong>criteria</strong>, <strong>for</strong> which <strong>the</strong> age-specific prevalence estimates<br />
varied from 2% among 40 yr olds, to 4–5% among those aged<br />
o70 yrs. We observed <strong>the</strong> same general patterns within each<br />
site (data not shown).<br />
The Wald statistic <strong>for</strong> testing <strong>for</strong> age effects in figure 2 dropped<br />
from a high <strong>of</strong> 62.6 <strong>for</strong> <strong>the</strong> fixed ratio criterion to 24.5 <strong>for</strong> <strong>GOLD</strong><br />
stages 2–4, to ,6.6 <strong>for</strong> <strong>the</strong> two analogues <strong>of</strong> <strong>the</strong>se <strong>criteria</strong> in<br />
FIGURE 3. Prevalence <strong>of</strong> Global Initiative <strong>for</strong> Chronic Obstructive Lung<br />
Disease (<strong>GOLD</strong>) stages 2–4 chronic obstructive pulmonary disease in <strong>the</strong> Burden<br />
<strong>of</strong> Obstructive Lung Disease (BOLD) study using <strong>the</strong> Third US National Health and<br />
Nutrition Examination Survey (NHANES-III) and site-specific prediction equations<br />
(data from all sites combined). Site differences were greater when using <strong>the</strong><br />
NHANES-III equations (Wald statistic 9.5, p,0.0001) or Hordaland county<br />
equations (Wald statistic 8.4, p,0.0001) than when using <strong>the</strong> site-specific<br />
equations (Wald statistic 4.7, p,0.0001). The estimated prevalences were<br />
significantly higher (p,0.0001 <strong>for</strong> all age groups) when using common reference<br />
equations <strong>for</strong> all sites (NHANES-III and Hordaland County) than when using local<br />
prediction equations. The NHANES-III and Hordaland County prevalence estimates<br />
differed significantly overall and <strong>for</strong> <strong>the</strong> oldest age group. ¤: NHANES-III; h:<br />
Hordaland County; n: local equations.<br />
which FEV1/FVC ,0.7 is replaced by FEV1/FVC,LLN, and to<br />
3.4 <strong>for</strong> <strong>the</strong> ‘‘LLN (FEV1/FVC) and LLN (FEV1)’’ <strong>criteria</strong>. All<br />
were statistically significant. We found modest evidence <strong>of</strong> a<br />
statistically significant sex-age interaction using <strong>the</strong> fixed ratio<br />
criterion (Wald statistic 3.1, p50.027) and no evidence <strong>of</strong><br />
statistically significant sex-age interactions in <strong>the</strong>se healthy<br />
never-smokers using any <strong>of</strong> <strong>the</strong> o<strong>the</strong>r prevalence estimators.<br />
When we assessed site differences in <strong>the</strong> group <strong>of</strong> healthy,<br />
never-smoking individuals, we observed smaller site differences<br />
<strong>for</strong> <strong>the</strong> <strong>GOLD</strong> stages 2–4 criterion (Wald statistic 1.6) than<br />
<strong>for</strong> <strong>the</strong> LLN (FEV1/FVC) criterion (Wald statistic 2.9), although<br />
once again <strong>the</strong> smallest site differences were seen <strong>for</strong> <strong>the</strong> ‘‘LLN<br />
(FEV1/FVC) and LLN (FEV1)’’ and ‘‘LLN (FEV1/FVC) and<br />
FEV1 ,80% pred’’ <strong>criteria</strong> (Wald statistic 0.9–1.1). Indeed, <strong>for</strong><br />
both <strong>of</strong> <strong>the</strong>se latter <strong>criteria</strong>, <strong>the</strong> site differences did not come<br />
close to reaching statistical significance (p.0.35), whereas <strong>for</strong><br />
<strong>the</strong> o<strong>the</strong>r three <strong>criteria</strong> <strong>the</strong> p-values were all less than 0.07.<br />
Figure 3 illustrates <strong>the</strong> impact on prevalence <strong>of</strong> using a single<br />
common prediction equation (<strong>the</strong> US NHANES-III Caucasian<br />
equations or <strong>the</strong> Hordaland County Respiratory Health Study<br />
equations) versus site-specific prediction equations. For both<br />
males and females, <strong>the</strong> estimated <strong>GOLD</strong> stage 2–4 prevalences<br />
were higher (by 2–3 percentage points overall; p,0.0001) when<br />
using common reference equations <strong>for</strong> all sites (NHANES-III<br />
and Hordaland County) than when using local prediction<br />
equations. The NHANES-III and Hordaland County prevalence<br />
estimates were generally similar, although <strong>the</strong>y differed<br />
significantly overall and <strong>for</strong> <strong>the</strong> oldest age group. The Wald<br />
statistic <strong>for</strong> site differences computed from <strong>the</strong> site-specific<br />
592 VOLUME 34 NUMBER 3 EUROPEAN RESPIRATORY JOURNAL
W.M. VOLLMER ET AL.<br />
<strong>COPD</strong> AND SMOKING-RELATED DISORDERS<br />
TABLE 3<br />
Prevalence <strong>of</strong> chronic obstructive pulmonary disease (<strong>COPD</strong>) computed using FEV1/FEV6 in place <strong>of</strong> FEV1/FVC<br />
Subjects n <strong>COPD</strong> criterion p-value #<br />
LLN (FEV1/FEV6) and<br />
FEV1 ,80% pred<br />
LLN (FEV1/FVC) and<br />
FEV1 ,80% pred<br />
Overall 10001 8.1 8.3 0.10<br />
Age yrs<br />
40–49 3381 4.1 4.1 0.84<br />
50–59 2968 6.5 7.2 ,0.01<br />
60–69 2172 11.2 11.5 0.57<br />
o70 1480 15.9 15.7 0.73<br />
Smoking history<br />
Never-smoker 4291 4.0 4.0 1.0<br />
0–10 pack-yrs 1777 5.0 4.8 0.66<br />
10–20 pack-yrs 1270 9.6 9.6 1.0<br />
o20 pack-yrs 2654 16.3 17.1 0.01<br />
Sex<br />
Male 4766 9.1 9.1 0.90<br />
Female 5235 7.2 7.6 0.01<br />
Site<br />
Guangzhou, China 473 6.8 5.5 0.03<br />
Adana, Turkey 806 8.3 9.3 0.04<br />
Salzburg, Austria 1258 7.2 7.5 0.34<br />
Cape Town, South Africa 847 17.1 16.3 0.25<br />
Reykjavik, Iceland 757 5.9 6.5 0.29<br />
Hanover, Germany 683 5.1 5.0 1.0<br />
Krakow, Poland 526 7.6 7.4 1.0<br />
Bergen, Norway 658 5.9 6.8 0.11<br />
Vancouver, BC, Canada 827 5.7 6.4 0.07<br />
Lexington, KY, USA 508 11.2 12.4 0.15<br />
Manila, Philippines 893 9.2 8.4 0.09<br />
Sydney, Australia 541 8.1 7.6 0.38<br />
London, UK 677 9.2 10.2 0.02<br />
Uppsala, Sweden 547 4.9 5.7 0.12<br />
Data are presented as %, unless o<strong>the</strong>rwise stated. Prevalence data are univariate classifications and not adjusted <strong>for</strong> o<strong>the</strong>r terms in <strong>the</strong> table. FEV1: <strong>for</strong>ced expiratory<br />
volume in 1 s; FEV6: <strong>for</strong>ced expiratory volume in 6 s; FVC: <strong>for</strong>ced vital capacity; LLN: lower limit <strong>of</strong> normal; % pred: % predicted. # : two-tailed exact p-values based on<br />
McNemar’s test <strong>for</strong> comparing prevalences within each subgroup.<br />
equations (4.7) was less than <strong>the</strong> Wald statistic <strong>for</strong> <strong>the</strong><br />
NHANES (9.5) and Hordaland County (8.4) equations,<br />
although all were highly statistically significant (p,0.0001).<br />
We observed similar patterns when we replaced <strong>the</strong> <strong>GOLD</strong><br />
stage 2–4 criterion with <strong>the</strong> LLN (ratio) and FEV1 ,80% pred<br />
criterion (data not shown), although <strong>the</strong> Wald statistics were<br />
closer (6.5 versus 7.3 and 8.9).<br />
Finally, <strong>the</strong> use <strong>of</strong> <strong>the</strong> FEV1/FEV6 in place <strong>of</strong> <strong>the</strong> FEV1/FVC<br />
when using <strong>the</strong> ‘‘LLN (FEV1/FVC) and FEV1 ,80% pred’’<br />
criterion had little clinically relevant impact on prevalence<br />
estimates, whe<strong>the</strong>r computed overall, by age or smoking<br />
history categories, or by site (table 3). When we did observe<br />
statistically significant differences, <strong>the</strong> prevalences were generally<br />
smaller <strong>for</strong> <strong>the</strong> FEV1/FEV6-based criterion.<br />
DISCUSSION<br />
This analysis <strong>of</strong> data from <strong>the</strong> BOLD study confirmed<br />
previously reported limitations associated with <strong>the</strong> use <strong>of</strong> <strong>the</strong><br />
fixed ratio criterion to define <strong>COPD</strong>. Adjusting <strong>the</strong> FEV1/FVC<br />
<strong>for</strong> normative ageing effects appears to reduce <strong>the</strong> rate <strong>of</strong> falsepositive<br />
diagnoses that has been reported <strong>for</strong> older individuals<br />
[2, 7–10], and <strong>the</strong> added requirement <strong>of</strong> a low FEV1 fur<strong>the</strong>r<br />
reduced <strong>the</strong> age-related increases in <strong>COPD</strong> prevalence seen<br />
among healthy never-smokers.<br />
A strength <strong>of</strong> this analysis is that data were ga<strong>the</strong>red using a<br />
standardised approach from a wide range <strong>of</strong> populations,<br />
with close attention paid to <strong>spirometry</strong> quality control. The<br />
qualitative similarity <strong>of</strong> results across sites (fig. 1a) provides<br />
strong evidence <strong>for</strong> <strong>the</strong> robustness <strong>of</strong> our findings. The wide<br />
variation in characteristics <strong>of</strong> BOLD sites enabled us to use<br />
site-to-site variation in prevalence (assessed using <strong>the</strong> Wald<br />
statistic) as a convenient metric <strong>for</strong> comparing alternative<br />
measures <strong>of</strong> <strong>COPD</strong> prevalence, since a desired characteristic<br />
<strong>of</strong> any prevalence estimate is that it yields comparable<br />
estimates in different populations after adjusting <strong>for</strong> known<br />
risk factors.<br />
c<br />
EUROPEAN RESPIRATORY JOURNAL VOLUME 34 NUMBER 3 593
<strong>COPD</strong> AND SMOKING-RELATED DISORDERS<br />
W.M. VOLLMER ET AL.<br />
TABLE 4 Characteristics <strong>of</strong> Burden <strong>of</strong> Obstructive Lung Disease study participants included in analysis<br />
Guangzhou,<br />
China<br />
Adana,<br />
Turkey<br />
Salzburg,<br />
Austria<br />
Reykjavik,<br />
Iceland<br />
Cape Town,<br />
South Africa<br />
Krakow,<br />
Poland<br />
Hanover,<br />
Germany<br />
Bergen,<br />
Norway<br />
Vancouver,<br />
BC, Canada<br />
Manila,<br />
Philippines<br />
Lexington,<br />
KY, USA<br />
Sydney,<br />
Australia<br />
London,<br />
UK<br />
Uppsala,<br />
Sweden<br />
Subjects n 473 806 1258 757 847 526 683 658 827 893 508 541 677 547<br />
Age yrs<br />
40–49 43.1 42.1 29.2 35.9 39.6 37.5 26.9 25.1 35.2 47.3 26.6 29.0 28.2 22.3<br />
50–59 26.4 30.6 28.5 29.0 31.1 27.4 26.8 28.1 31.9 31.0 37.4 27.2 26.1 34.2<br />
60–69 20.5 17.5 26.0 18.0 19.7 20.3 29.7 22.0 17.3 14.3 25.6 21.4 27.8 26.3<br />
o70 9.9 9.8 16.3 17.1 9.7 14.8 16.5 24.8 15.6 7.4 10.4 22.4 17.9 17.2<br />
Males n 236 389 685 403 313 266 349 324 344 378 206 265 323 283<br />
Smoking history<br />
Never-smoker 18.6 19.5 40.2 38.5 15.6 21.1 30.7 32.1 42.2 16.6 30.1 44.5 32.5 37.5<br />
0–10 pack-yrs 11.9 13.6 12.3 16.1 30.5 11.3 16.6 16.4 18.3 24.3 7.8 18.9 18.6 23.0<br />
10–20 pack-yrs 21.2 11.1 13.1 16.1 24.4 15.8 13.2 19.1 11.0 23.5 6.3 10.2 11.1 14.5<br />
o20 pack-yrs 48.3 55.8 34.5 29.0 28.9 51.5 39.5 32.4 28.2 35.4 55.8 26.4 37.8 25.1<br />
Height cm 166¡6.2 168¡6.6 176¡6.6 180¡6.5 169¡7.3 173¡6.3 175¡7.6 178¡7.1 175¡7.3 163¡6.7 176¡7.3 172¡7.5 175¡7.1 178¡7.0<br />
BMI kg?m -2 23.3¡3.1 27.7¡4.6 26.7¡3.5 28.3¡4.4 24.7¡5.7 27.4¡3.9 27.7¡4.0 26.9¡¡3.8 27.1¡4.0 24.4¡4.8 30.3¡4.9 28.0¡4.4 27.5¡4.5 27.2¡3.8<br />
Females n 237 417 573 354 532 260 334 334 483 515 302 276 354 264<br />
Smoking history<br />
Never-smoker 93.7 69.5 55.8 39.7 42.1 56.5 50.0 42.2 51.8 69.5 46.4 53.6 43.2 48.1<br />
0–10 pack-yrs 2.1 15.8 16.8 25.8 27.8 15.0 13.8 19.8 18.2 19.0 11.3 18.1 21.8 20.1<br />
10–20 pack-yrs 1.7 5.8 10.1 13.3 15.8 13.1 12.9 18.9 10.6 5.2 8.3 8.7 9.6 12.5<br />
o20 pack-yrs 2.5 8.9 17.3 21.2 14.3 14.6 23.4 19.2 19.3 5.2 34.1 19.6 25.4 18.9<br />
Height cm 155¡6.5 154¡6.0 163¡6.1 166¡6.3 157¡6.7 161¡5.8 163¡7.0 164¡6.4 161¡7.4 151¡5.9 161¡5.8 159¡6.6 162¡7.3 164¡6.2<br />
BMI kg?m -2 23.4¡3.4 31.5¡5.3 26.1¡4.9 27.5¡5.5 29.8¡7.7 28.0¡5.3 26.8¡5.1 26.2¡4.8 26.4¡5.9 25.3¡4.6 31.1¡7.8 27.9¡5.7 26.7¡5.3 26.8¡4.9<br />
Data are presented as % or mean¡SD, unless o<strong>the</strong>rwise stated. BMI: body mass index.<br />
594 VOLUME 34 NUMBER 3 EUROPEAN RESPIRATORY JOURNAL
W.M. VOLLMER ET AL.<br />
<strong>COPD</strong> AND SMOKING-RELATED DISORDERS<br />
An obvious limitation <strong>of</strong> this analysis is <strong>the</strong> lack <strong>of</strong> a gold<br />
standard against which to assess our putative definitions <strong>of</strong><br />
<strong>COPD</strong> (indeed, a more accurate descriptor <strong>of</strong> what we are<br />
measuring may simply be chronic airflow limitation).<br />
None<strong>the</strong>less, it is possible to evaluate how alternative definitions<br />
per<strong>for</strong>m in individuals who have a low a priori<br />
probability <strong>of</strong> disease. Our results confirm previous reports<br />
that <strong>the</strong> fixed ratio criterion lacks specificity and that, as age<br />
increases, increasingly misclassifies apparently healthy neversmokers<br />
as having <strong>COPD</strong> [2, 7–10, 12]. This pattern <strong>of</strong><br />
(apparent) misclassification with increasing age was greatly<br />
muted by adding <strong>the</strong> requirement that <strong>the</strong> FEV1 % pred be<br />
below a defined threshold, or by replacing <strong>the</strong> fixed ratio<br />
criterion with a criterion that <strong>the</strong> FEV1/FVC be below <strong>the</strong> LLN<br />
(fig. 2). However, only <strong>the</strong> method requiring both an FEV1/<br />
FVC below <strong>the</strong> LLN and a low FEV1 (measured as ei<strong>the</strong>r<br />
FEV1,LLN or FEV1 ,80% pred) largely eliminated this agerelated<br />
increase.<br />
The upward trend that still persists in figure 2 even with our<br />
‘‘best’’ definitions <strong>of</strong> <strong>COPD</strong> may reflect <strong>the</strong> fact that our<br />
‘‘healthy’’ never-smokers did include some individuals with<br />
symptoms. As noted below, this was a pragmatic decision due<br />
to <strong>the</strong> limited number <strong>of</strong> never-smokers at some sites. The fact<br />
that <strong>the</strong> NHANES-III prediction equations were fit to a cohort<br />
whose upper age limit was 80 yrs also may create an upward<br />
bias <strong>for</strong> very old individuals that helps explain <strong>the</strong> upward<br />
drift in figure 2. However, ,4% <strong>of</strong> <strong>the</strong> BOLD cohort were aged<br />
o80 yrs; in addition, <strong>the</strong> NHANES-III prediction equations <strong>for</strong><br />
FEV1 include an age-squared term and so allow <strong>for</strong> accelerated<br />
ageing effects.<br />
Notably, <strong>the</strong> recent ATS/ERS statement recommends using <strong>the</strong><br />
LLN <strong>of</strong> <strong>the</strong> FEV1/FVC in place <strong>of</strong> <strong>the</strong> fixed ratio criterion to<br />
diagnose airflow obstruction [21]; a recent paper by SWANNEY<br />
et al. [12], albeit using pre-bronchodilator <strong>spirometry</strong>, also<br />
supports this recommendation. Use <strong>of</strong> both an FEV1/FVC<br />
below <strong>the</strong> LLN and a low FEV1 was consistently associated<br />
with low site-to-site and age-related variation relative to o<strong>the</strong>r<br />
measures, after adjusting <strong>for</strong> known risk factors. Assuming<br />
that variability about <strong>the</strong> prediction equations is stable, using<br />
<strong>the</strong> LLN as a threshold <strong>for</strong> defining low FEV1 should produce<br />
less misclassification [22], although in practice <strong>the</strong>se two<br />
measures per<strong>for</strong>med similarly.<br />
The results <strong>of</strong> our study also add to <strong>the</strong> evidence suggesting<br />
that, without both a low FEV1/FVC and a low FEV1,<br />
confidence is low that a true lung function abnormality (or<br />
airway disease) exists. The current <strong>GOLD</strong> stage 1 classification<br />
was based solely on expert opinion, not on evidence <strong>of</strong> airway<br />
disease or subsequent rapid loss <strong>of</strong> lung function. Patients with<br />
<strong>GOLD</strong> stage 1 do not have reduced exercise capacity [23].<br />
Among Lung Health Study participants, a rapid fall in FEV1<br />
was not seen when baseline FEV1 was .70% pred [24].<br />
Apart from <strong>the</strong> fixed ratio criterion, <strong>the</strong> competing measures<br />
we evaluated all require use <strong>of</strong> prediction equations. One <strong>of</strong><br />
<strong>the</strong> purported benefits <strong>of</strong> <strong>the</strong> fixed ratio criterion is that it does<br />
not rely on such equations. However, as SWANNEY et al. [12]<br />
note, this easy-to-apply definition is only valid at age ,50 yrs.<br />
In addition, <strong>the</strong> fixed ratio criterion is not necessarily easier to<br />
use in practice, since even inexpensive pocket spirometers<br />
include a microprocessor that calculates <strong>the</strong> appropriate LLN<br />
<strong>for</strong> FEV1/FVC, FEV1/FEV6 and FEV1. Lastly, even <strong>GOLD</strong><br />
relies on prediction equations to stage disease, so any<br />
advantage <strong>of</strong> <strong>the</strong> fixed ratio in terms <strong>of</strong> its simplicity<br />
disappears as soon as one looks at clinically relevant<br />
impairment (nominally <strong>GOLD</strong> stage 2 or higher). The only<br />
way to overcome <strong>the</strong> limitations <strong>of</strong> <strong>the</strong> current fixed ratio<br />
criterion while still avoiding <strong>the</strong> need <strong>for</strong> prediction equations<br />
would be to establish a series <strong>of</strong> separate fixed ratio cut points<br />
<strong>for</strong> different ages.<br />
The question <strong>the</strong>n arises, what is a suitable prediction equation<br />
<strong>for</strong> any given population, and what if normative prediction<br />
equations do not exist <strong>for</strong> that population? While <strong>the</strong><br />
documented variability in lung function that exists among<br />
‘‘healthy’’ never-smokers in different racial groups may reflect,<br />
at least in part, true genetic differences in <strong>the</strong>se populations, it<br />
also may represent <strong>the</strong> cumulative effect <strong>of</strong> environmental<br />
exposures, including childhood factors. For this reason, BOLD<br />
chose to use a single set <strong>of</strong> sex-specific prediction equations <strong>for</strong><br />
all subjects in all sites. We chose <strong>the</strong> US NHANES-III equations<br />
<strong>for</strong> Caucasian adults because <strong>the</strong>y were derived from a large<br />
study conducted in a diverse population with rigorous<br />
attention to quality control. We observed similar prevalence<br />
estimates using equations derived from Norway’s Hordaland<br />
County Respiratory Health Study [20] in place <strong>of</strong> <strong>the</strong><br />
NHANES-III equations.<br />
The PLATINO study (Latin American Project <strong>for</strong> <strong>the</strong><br />
Investigation <strong>of</strong> Obstructive Lung Disease), conducted in five<br />
Latin American countries using methods similar to those <strong>of</strong> <strong>the</strong><br />
BOLD study, used site-specific prediction equations [25]. In<br />
BOLD, <strong>the</strong> use <strong>of</strong> local prediction equations led to prevalence<br />
estimates 2–3 percentage points lower, on average, than those<br />
based on a single, common equation. Whe<strong>the</strong>r this means that<br />
<strong>the</strong> BOLD prevalence estimates overestimate <strong>the</strong> ‘‘true’’<br />
estimate, or <strong>the</strong> local equations underestimate it, we cannot<br />
say, but on balance we prefer to maintain <strong>the</strong> site-to-site<br />
variation and see if it can be explained by o<strong>the</strong>r risk factors.<br />
Because our local equations were fitted to individuals aged<br />
o40 yrs, while <strong>the</strong> NHANES-III equations were fitted to<br />
adults aged o18 yrs, <strong>the</strong> <strong>for</strong>mer may better describe <strong>the</strong><br />
accelerated ageing that is known to occur in healthy adults.<br />
Also, we included symptomatic individuals in our prediction<br />
equations as long as <strong>the</strong>y did not report diagnosed disease,<br />
whereas <strong>the</strong> NHANES-III equations required individuals to be<br />
asymptomatic. Since <strong>the</strong>re can be large discrepancies between<br />
prediction equations based on individuals with and without<br />
major respiratory symptoms [26], this may also help to explain<br />
<strong>the</strong> somewhat lower prevalence estimates between <strong>the</strong> two<br />
approaches. One final consideration relating to <strong>the</strong> use <strong>of</strong> sitespecific<br />
prediction equations, particularly if reliable normative<br />
equations <strong>for</strong> that population do not exist, is that <strong>the</strong> resulting<br />
estimates may be highly variable owing to limited sample<br />
sizes. For instance, despite relatively large sample sizes from<br />
each site, <strong>the</strong> number <strong>of</strong> healthy never-smokers available to<br />
build our prediction equations was very limited in some sites<br />
due to extremely high rates <strong>of</strong> ever having smoked.<br />
Considerable attention is now being paid to <strong>the</strong> use <strong>of</strong> <strong>the</strong><br />
FEV1/FEV6 as an alternative to <strong>the</strong> FEV1/FVC, particularly in<br />
older, less healthy populations <strong>for</strong> whom achievement <strong>of</strong> a<br />
c<br />
EUROPEAN RESPIRATORY JOURNAL VOLUME 34 NUMBER 3 595
<strong>COPD</strong> AND SMOKING-RELATED DISORDERS<br />
W.M. VOLLMER ET AL.<br />
high quality, reproducible FVC may be problematic [27].<br />
Several studies have shown that <strong>the</strong> FEV1/FEV6, <strong>for</strong> which<br />
reliable reference equations exist [19], is a more reproducible<br />
measure than is <strong>the</strong> FEV1/FVC [28, 29], and predicts<br />
subsequent lung function decline about as well as <strong>the</strong> FEV1/<br />
FVC [30]. Our results (table 3) show that using <strong>the</strong> FEV1/FEV6<br />
in place <strong>of</strong> <strong>the</strong> FEV1/FVC in our definition <strong>of</strong> ‘‘LLN (FEV1/<br />
FVC) and FEV1 ,80% pred’’ yields very similar prevalence<br />
estimates, thus fur<strong>the</strong>r supporting <strong>the</strong> use <strong>of</strong> this alternative<br />
measure in future studies <strong>of</strong> <strong>COPD</strong> prevalence. Once an<br />
obstructive lung disease has been diagnosed, however,<br />
changes in FEV1 should be used to follow disease progression<br />
or treatment responses.<br />
Finally, our observation that use <strong>of</strong> pre-bronchodilator <strong>spirometry</strong><br />
results in consistently inflated estimates <strong>of</strong> chronic<br />
airflow obstruction, regardless <strong>of</strong> <strong>the</strong> definition used, fur<strong>the</strong>r<br />
emphasises <strong>the</strong> need <strong>for</strong> using post-bronchodilator <strong>spirometry</strong><br />
to classify <strong>COPD</strong> [14]. Our finding that prevalence estimates<br />
dropped, on average, ,25% when using post-bronchodilator<br />
<strong>spirometry</strong> is generally consistent with o<strong>the</strong>r reports [8, 10, 13].<br />
Although we recognise that well-assessed, normal pre-bronchodilator<br />
<strong>spirometry</strong> has high negative predictive value even in<br />
<strong>the</strong> absence <strong>of</strong> post-bronchodilator testing, its use is associated<br />
with <strong>the</strong> more serious risk <strong>of</strong> increased false-positive diagnoses.<br />
In summary, data from <strong>the</strong> BOLD study confirm previous<br />
reports <strong>of</strong> misclassification using <strong>the</strong> fixed ratio criterion to<br />
measure <strong>COPD</strong>. As an alternative, we recommend a definition<br />
based on an FEV1/FVC ratio less than <strong>the</strong> LLN, and an FEV1<br />
ei<strong>the</strong>r ,80% pred, or below <strong>the</strong> LLN. This modification <strong>of</strong> <strong>the</strong><br />
current <strong>GOLD</strong> stage 2 severity threshold appears to better<br />
account <strong>for</strong> known ageing effects in healthy never-smokers.<br />
While this new definition will likely miss many individuals<br />
with mild <strong>COPD</strong>, it should capture most individuals with<br />
clinically significant disease, while minimising <strong>the</strong> risk <strong>of</strong> falsepositive<br />
diagnoses. Finally, substitution <strong>of</strong> <strong>the</strong> FEV1/FEV6 in<br />
place <strong>of</strong> <strong>the</strong> FEV1/FVC in this definition appears to yield<br />
similar prevalence estimates and, based on previous reports,<br />
may be a more reproducible and practical measure.<br />
STATEMENT OF INTEREST<br />
Statements <strong>of</strong> interest <strong>for</strong> W.M. Vollmer and P.L. Enright can be found<br />
at www.erj.ersjournals.com/misc/statements.dtl The BOLD initiative<br />
has been funded in part by unrestricted educational grants to <strong>the</strong><br />
Operations Center. For full details see <strong>the</strong> online supplementary<br />
material available from www.erj.ersjournals.com<br />
ACKNOWLEDGEMENTS<br />
The BOLD study group wishes to acknowledge <strong>the</strong> contributions <strong>of</strong><br />
G. Harnoncourt (ndd Medizintechnik AG, Zurich, Switzerland) and<br />
P.L. Enright (The University <strong>of</strong> Arizona, Tucson, AZ, USA) <strong>for</strong> <strong>the</strong>ir<br />
assistance with <strong>spirometry</strong> training and quality control during <strong>the</strong><br />
study.<br />
REFERENCES<br />
1 Halbert RJ, Natoli JL, Gano A, et al. Global burden <strong>of</strong> <strong>COPD</strong>:<br />
systematic review and meta-analysis. Eur Respir J 2006; 28: 523–532.<br />
2 Celli BR, Halbert RJ, Isonaka S, et al. Population impact <strong>of</strong> different<br />
definitions <strong>of</strong> airway obstruction. Eur Respir J 2003; 22: 268–273.<br />
3 Rabe KF, Hurd S, Anzueto A, et al. Global strategy <strong>for</strong> <strong>the</strong><br />
<strong>diagnosis</strong>, management, and prevention <strong>of</strong> chronic obstructive<br />
pulmonary disease: <strong>GOLD</strong> executive summary. Am J Respir Crit<br />
Care Med 2007; 176: 532–555.<br />
4 Celli BR, MacNee W. Standards <strong>for</strong> <strong>the</strong> <strong>diagnosis</strong> and treatment <strong>of</strong><br />
patients with <strong>COPD</strong>: a summary <strong>of</strong> <strong>the</strong> ATS/ERS position paper.<br />
Eur Respir J 2004; 23: 932–946.<br />
5 Viegi G, Pedreschi M, Pistelli F, et al. Prevalence <strong>of</strong> airways obstruction<br />
in a general population: European Respiratory Society versus<br />
American Thoracic Society definition. Chest 2000; 117: 339S–345S.<br />
6 Lindberg A, Eriksson B, Larsson LG, et al. Seven-year cumulative<br />
incidence <strong>of</strong> <strong>COPD</strong> in an age-stratified general population sample.<br />
Chest 2006; 129: 879–885.<br />
7 Hardie JA, Buist AS, Vollmer WM, et al. Risk <strong>of</strong> over-<strong>diagnosis</strong> <strong>of</strong><br />
<strong>COPD</strong> in asymptomatic elderly never-smokers. Eur Respir J 2002;<br />
20: 1117–1122.<br />
8 Shirtcliffe P, Wea<strong>the</strong>rall M, Marsh S, et al. <strong>COPD</strong> prevalence in a<br />
random population survey: a matter <strong>of</strong> definition. Eur Respir J<br />
2007; 30: 232–239.<br />
9 Hnizdo E, Glindmeyer HW, Petsonk EL, et al. Case definitions <strong>for</strong><br />
chronic obstructive pulmonary disease. <strong>COPD</strong> 2006; 3: 95–100.<br />
10 Perez-Padilla R, Hallal PC, Vazquez-Garcia JC, et al. Impact <strong>of</strong><br />
bronchodilator use on <strong>the</strong> prevalence <strong>of</strong> <strong>COPD</strong> in populationbased<br />
samples. <strong>COPD</strong> 2007; 4: 113–120.<br />
11 Cerveri I, Corsico AG, Accordini S, et al. Underestimation <strong>of</strong><br />
airflow obstruction among young adults using FEV1/FVC ,70%<br />
as a fixed cut-<strong>of</strong>f: a longitudinal evaluation <strong>of</strong> clinical and<br />
functional outcomes. Thorax 2008; 63: 1040–1045.<br />
12 Swanney MP, Ruppel G, Enright PL, et al. Using <strong>the</strong> lower limit <strong>of</strong><br />
normal <strong>for</strong> <strong>the</strong> FEV1/FVC ratio reduces <strong>the</strong> misclassification <strong>of</strong><br />
airway obstruction. Thorax 2008; 63: 1046–1051.<br />
13 Johannessen A, Omenaas ER, Bakke PS, et al. Implications <strong>of</strong><br />
reversibility testing on prevalence and risk factors <strong>for</strong> chronic<br />
obstructive pulmonary disease: a community study. Thorax 2005;<br />
60: 842–847.<br />
14 Sterk PJ. Let’s not <strong>for</strong>get: <strong>the</strong> <strong>GOLD</strong> <strong>criteria</strong> <strong>for</strong> <strong>COPD</strong> are based on<br />
post-bronchodilator FEV1. Eur Respir J 2004; 23: 497–498.<br />
15 Buist AS, Vollmer WM, Sullivan S, et al. The Burden <strong>of</strong> Obstructive<br />
Lung Disease Initiative (BOLD): rationale and design. <strong>COPD</strong> 2005;<br />
2: 277–283.<br />
16 Buist AS, McBurnie MA, Vollmer WM, et al. International<br />
variation in <strong>the</strong> prevalence <strong>of</strong> <strong>COPD</strong> (<strong>the</strong> BOLD Study): a<br />
population-based prevalence study. Lancet 2007; 370: 741–750.<br />
17 Perez-Padilla R, Vazquez-Garcia JC, Marquez MN, et al. The longterm<br />
stability <strong>of</strong> portable spirometers used in a multinational<br />
study <strong>of</strong> <strong>the</strong> prevalence <strong>of</strong> chronic obstructive pulmonary disease.<br />
Respir Care 2006; 51: 1167–1171.<br />
18 Miller MR, Hankinson J, Brusasco V, et al. Standardisation <strong>of</strong><br />
<strong>spirometry</strong>. Eur Respir J 2005; 26: 319–338.<br />
19 Hankinson JL, Odencrantz JR, Fedan KB. Spirometric reference<br />
values from a sample <strong>of</strong> <strong>the</strong> general U.S. population. Am J Respir<br />
Crit Care Med 1999; 159: 179–187.<br />
20 Johannessen A, Lehmann S, Omenaas ER, et al. Post-bronchodilator<br />
<strong>spirometry</strong> reference values in adults and implications <strong>for</strong> disease<br />
management. Am J Respir Crit Care Med 2006; 173: 1316–1325.<br />
21 Pellegrino R, Brusasco V, Viegi G, et al. Definition <strong>of</strong> <strong>COPD</strong>: based<br />
on evidence or opinion? Eur Respir J 2008; 31: 681–682.<br />
22 Stanojevic S, Wade A, Stocks J, et al. Reference ranges <strong>for</strong><br />
<strong>spirometry</strong> across all ages: a new approach. Am J Respir Crit Care<br />
Med 2008; 177: 253–260.<br />
23 Pinto-Plata VM, Celli-Cruz RA, Vassaux C, et al. Differences in<br />
cardiopulmonary exercise test results by American Thoracic<br />
Society/European Respiratory Society – Global Initiative <strong>for</strong><br />
Chronic Obstructive Lung Disease stage categories and gender.<br />
Chest 2007; 132: 1204–1211.<br />
24 Scanlon PD, Connett JE, Waller LA, et al. Smoking cessation and<br />
lung function in mild-to-moderate chronic obstructive pulmonary<br />
disease. The Lung Health Study. Am J Respir Crit Care Med 2000;<br />
161: 381–390.<br />
596 VOLUME 34 NUMBER 3 EUROPEAN RESPIRATORY JOURNAL
W.M. VOLLMER ET AL.<br />
<strong>COPD</strong> AND SMOKING-RELATED DISORDERS<br />
25 Menezes AM, Perez-Padilla R, Jardim JR, et al. Chronic<br />
obstructive pulmonary disease in five Latin American cities<br />
(<strong>the</strong> PLATINO study): a prevalence study. Lancet 2005; 366:<br />
1875–1881.<br />
26 Johannessen A, Omenaas ER, Eide GE, et al. Feasible and simple<br />
exclusion <strong>criteria</strong> <strong>for</strong> pulmonary reference populations. Thorax<br />
2007; 62: 792–798.<br />
27 Pezzoli L, Giardini G, Consonni S, et al. Quality <strong>of</strong> spirometric<br />
per<strong>for</strong>mance in older people. Age Ageing 2003; 32: 43–46.<br />
28 Swanney MP, Jensen RL, Crichton DA, et al. FEV6 is an acceptable<br />
surrogate <strong>for</strong> FVC in <strong>the</strong> spirometric <strong>diagnosis</strong> <strong>of</strong> airway obstruction<br />
and restriction. Am J Respir Crit Care Med 2000; 162: 917–919.<br />
29 Rosa FW, Perez-Padilla R, Camelier A, et al. Efficacy <strong>of</strong> <strong>the</strong> FEV1/<br />
FEV6 ratio compared to <strong>the</strong> FEV1/FVC ratio <strong>for</strong> <strong>the</strong> <strong>diagnosis</strong> <strong>of</strong><br />
airway obstruction in subjects aged 40 years or over. Braz J Med<br />
Biol Res 2007; 40: 1615–1621.<br />
30 Enright PL, Connett JE, Bailey WC. The FEV1/FEV6 predicts lung function<br />
decline in adult smokers. Respiratory Medicine 2002; 96: 444–449.<br />
EUROPEAN RESPIRATORY JOURNAL VOLUME 34 NUMBER 3 597


![Di Bari [NO].pdf - GOLD](https://img.yumpu.com/21544924/1/190x143/di-bari-nopdf-gold.jpg?quality=85)