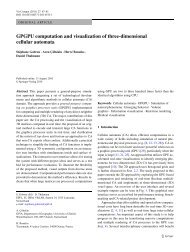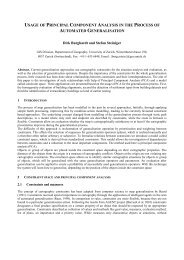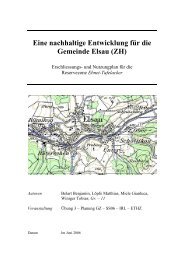
Application of Ground Penetrating Radar in Glaciology and ...
Application of Ground Penetrating Radar in Glaciology and ...
Application of Ground Penetrating Radar in Glaciology and ...

Create successful ePaper yourself
Turn your PDF publications into a flip-book with our unique Google optimized e-Paper software.
<strong>Application</strong> <strong>of</strong> <strong>Ground</strong> <strong>Penetrat<strong>in</strong>g</strong> <strong>Radar</strong><br />
<strong>in</strong> <strong>Glaciology</strong> <strong>and</strong> Permafrost Prospect<strong>in</strong>g<br />
By Stephan Gruber <strong>and</strong> Florian Ludwig, 12/1996<br />
This document has been written as a Study Paper for the Arctic Studies Programme<br />
at the Arctic Centre, Rovaniemi, F<strong>in</strong>l<strong>and</strong>, under the Supervision <strong>of</strong> Dr. John Moore.
2 <strong>Application</strong> <strong>of</strong> GPR <strong>in</strong> glaciology <strong>and</strong> permafrost prospect<strong>in</strong>g<br />
Table <strong>of</strong> Contents<br />
Abstract ................................................................................................................................ 3<br />
Introduction ......................................................................................................................... 3<br />
1. Underst<strong>and</strong><strong>in</strong>g radar....................................................................................................... 4<br />
1.1. Electromagnetic radiation........................................................................................... 4<br />
1.2. Basic physics <strong>of</strong> radar ................................................................................................. 6<br />
1.3. Pr<strong>in</strong>ciples <strong>of</strong> GPR applications................................................................................... 7<br />
2. GPR data <strong>in</strong>terpretation ................................................................................................. 9<br />
2.1. Visualisation <strong>of</strong> radar data.......................................................................................... 9<br />
2.2. Incorporat<strong>in</strong>g additional sources <strong>of</strong> <strong>in</strong>formation ...................................................... 11<br />
2.3. Hyperbolas................................................................................................................ 11<br />
2.4. Wide angle reflection <strong>and</strong> refraction (WARR) <strong>and</strong> Common midpo<strong>in</strong>t (CMP)<br />
methods.................................................................................................................... 12<br />
3. Use <strong>of</strong> GPR on Glaciers................................................................................................. 14<br />
4. GPR <strong>and</strong> permafrost ..................................................................................................... 17<br />
5. Conclusion ...................................................................................................................... 20<br />
6. Acknowledgements ........................................................................................................ 20<br />
7. Literature ....................................................................................................................... 21
<strong>Application</strong> <strong>of</strong> GPR <strong>in</strong> glaciology <strong>and</strong> permafrost prospect<strong>in</strong>g 3<br />
Abstract<br />
<strong>Ground</strong> penetrat<strong>in</strong>g radar (GPR) provides a powerful tool for subsurface remote sens<strong>in</strong>g<br />
<strong>and</strong> as several companies <strong>of</strong>fer commercial units, it also becomes <strong>in</strong>creas<strong>in</strong>gly convenient<br />
<strong>and</strong> <strong>in</strong>expensive to use. S<strong>in</strong>ce the <strong>in</strong>troduction <strong>of</strong> GPR about twenty years ago much<br />
success <strong>in</strong> employ<strong>in</strong>g it on glaciers <strong>and</strong> on permafrost has been reported, <strong>and</strong> methods as<br />
well as equipment have been greatly improved.<br />
After a very short <strong>in</strong>troduction to some glaciological terms which are important for GPR<br />
sound<strong>in</strong>g the dielectric behaviour <strong>of</strong> ice is described <strong>and</strong> expla<strong>in</strong>ed <strong>in</strong> section 3. Different<br />
examples <strong>of</strong> glaciological work with radar from the literature are given.<br />
In section 4, terms <strong>and</strong> properties <strong>of</strong> permafrost that are relevant to GPR remote sens<strong>in</strong>g as<br />
well as dielectric behaviour <strong>of</strong> frozen ground are expla<strong>in</strong>ed. Also, some examples <strong>of</strong> radar<br />
sound<strong>in</strong>gs <strong>in</strong> permafrost <strong>and</strong> their limitations, as available from literature, are presented.<br />
The sections about GPR usage on glaciers <strong>and</strong> permafrost are preceded by a general<br />
<strong>in</strong>troduction which covers relevant aspects <strong>of</strong> electromagnetic radiation <strong>and</strong> its <strong>in</strong>teraction<br />
with matter as well as basic pr<strong>in</strong>ciples <strong>and</strong> physics <strong>in</strong>volved <strong>in</strong> GPR remote sens<strong>in</strong>g. A<br />
chapter on visualisation <strong>and</strong> <strong>in</strong>terpretation <strong>of</strong> radar data completes this general<br />
<strong>in</strong>troduction.<br />
Introduction<br />
When we were first <strong>in</strong>troduced to ground penetrat<strong>in</strong>g radar we found ourselves confronted<br />
with a multitude <strong>of</strong> terms <strong>and</strong> methods that we did not underst<strong>and</strong> <strong>and</strong> no good <strong>in</strong>troduction<br />
to this technique was available. Be<strong>in</strong>g fasc<strong>in</strong>ated by the capabilities <strong>of</strong> this method we<br />
wanted to ga<strong>in</strong> some underst<strong>and</strong><strong>in</strong>g <strong>in</strong> order to employ it.<br />
The idea <strong>of</strong> this study paper is to expla<strong>in</strong> processes, methods <strong>and</strong> terms needed for the<br />
application <strong>of</strong> GPR <strong>in</strong> our present ma<strong>in</strong> field <strong>of</strong> study: glacial <strong>and</strong> periglacial environments.<br />
We aim at a level <strong>of</strong> explanation sufficient to mean<strong>in</strong>gfully use GPR but yet not to go <strong>in</strong>to<br />
too much detail. After all we want to study earth <strong>and</strong> not physics.<br />
The Equations used here<strong>in</strong> refer to SI units unless otherwise stated.<br />
This document is available on the <strong>in</strong>ternet, see last page <strong>of</strong> this paper.
4 <strong>Application</strong> <strong>of</strong> GPR <strong>in</strong> glaciology <strong>and</strong> permafrost prospect<strong>in</strong>g<br />
1. Underst<strong>and</strong><strong>in</strong>g radar<br />
1.1. Electromagnetic radiation<br />
In order to give a better underst<strong>and</strong><strong>in</strong>g <strong>of</strong> radar remote sens<strong>in</strong>g it is essential to have a short<br />
<strong>in</strong>troduction <strong>in</strong>to the nature <strong>of</strong> electromagnetic radiation (EMR). The content <strong>of</strong> this<br />
chapter will follow Kip (1969) <strong>and</strong> Drury (1993).<br />
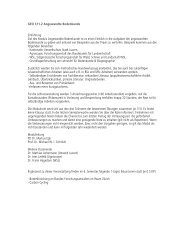
EMR consists <strong>of</strong> quanta which are the smallest def<strong>in</strong>ed units <strong>of</strong> energy <strong>and</strong> can be<br />
described as particles (photons) or as waves <strong>of</strong> oscillat<strong>in</strong>g electric <strong>and</strong> magnetic fields. The<br />
explanation <strong>of</strong> radar remote sens<strong>in</strong>g <strong>in</strong> this paper will deal with EMR as waves, only.<br />
Figure 1 Propagation <strong>of</strong> electromagnetic radiation (Drury 1993)<br />
These oscillat<strong>in</strong>g fields st<strong>and</strong> <strong>in</strong> right angels to each other <strong>and</strong> to the direction <strong>of</strong><br />
propagation. The oscillations can be described as s<strong>in</strong>e waves. If the electric fields <strong>of</strong> all<br />
quanta are l<strong>in</strong>ed <strong>in</strong> one direction the radiation is called polarised.<br />
The velocity <strong>of</strong> propagation for EMR <strong>in</strong> a vacuum is c = 2.99 × 10 8 ms -1 . In matter this<br />
velocity chances as is shown later.<br />
c =<br />
1<br />
εµ<br />
0 0<br />
Equation 1<br />
ε 0 <strong>and</strong> µ 0 are the free space (<strong>in</strong> vacuum) constants for permittivity <strong>and</strong> permeability.<br />
Permittivity is the property <strong>of</strong> a dielectric substance that determ<strong>in</strong>es the degree <strong>in</strong> which it<br />
modifies an electric field. Permeability is the property <strong>of</strong> a magnetisable substance that<br />
determ<strong>in</strong>es the degree <strong>in</strong> which it modifies the magnetic flux <strong>in</strong> the region occupied by it <strong>in</strong><br />
a magnetic field.<br />
The frequency <strong>of</strong> the wave oscillation f <strong>and</strong> the wave length λ are antiproportional.<br />
c = λf<br />
Equation 2<br />
Frequency <strong>and</strong> wavelength vary as a function <strong>of</strong> the energy <strong>of</strong> the quanta accord<strong>in</strong>g to<br />
Plancks law:<br />
E = fh<br />
Equation 3<br />
where Planck's constant h=6.62 × 10 -34 Js<br />
EMR <strong>of</strong> different wave lengths is emitted from different sources <strong>and</strong> through different<br />
processes. Also, the behaviour <strong>of</strong> EMR changes with its wavelength.
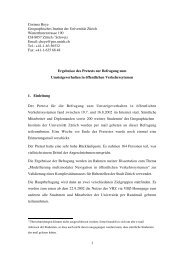
<strong>Application</strong> <strong>of</strong> GPR <strong>in</strong> glaciology <strong>and</strong> permafrost prospect<strong>in</strong>g 5<br />
Figure 2 Common part <strong>of</strong> the electromagnetic spectrum (Drury 1993)<br />
EMR is produced where size or direction <strong>of</strong> electric or magnetic fields fluctuate <strong>in</strong> time.<br />
The shortest wavelength requires the highest energy for emitt<strong>in</strong>g a quantum. Gamma rays,<br />
the shortest waves are a result <strong>of</strong> nuclear fission or fusion. X-rays, ultra violet <strong>and</strong> visible<br />
light are generated by electrons jump<strong>in</strong>g from one stable orbit<strong>in</strong>g shell to another. The<br />
energy lost by the electron jump<strong>in</strong>g from a higher orbit to a lower one is thereby emitted as<br />
a quantum. Infrared <strong>and</strong> microwaves are emitted by vibration or rotation <strong>of</strong> molecules.<br />
Longer waves such as microwaves which are used <strong>in</strong> radar, <strong>and</strong> radio waves are produced<br />
by field fluctuations such as chang<strong>in</strong>g electrical charges <strong>in</strong> an antenna.<br />
These different mechanisms <strong>of</strong> wave generation are also the mechanisms <strong>of</strong> <strong>in</strong>teraction<br />
with matter. Therefore different materials behave differently with vary<strong>in</strong>g wavelengths.<br />
These changes <strong>in</strong> behaviour <strong>and</strong> velocity <strong>of</strong> EMR <strong>in</strong> a medium are the basis for radar<br />
remote sens<strong>in</strong>g.<br />
As most transparent materials are nonmagnetic they have magnetic permeabilities very<br />
close to the free space value µ 0 . Therefore the velocity <strong>in</strong> a transparent medium is <strong>in</strong><br />
general given by its dielectric permittivity ε.<br />
Permittivity is usually expressed as the dimensionless relative permittivity ε which is<br />
determ<strong>in</strong>ed by Equation 4 where ε 1 is the absolute permittivity <strong>of</strong> a medium <strong>and</strong> ε 0 the free<br />
space constant. In this paper the term permittivity is used for relative permittivity.<br />
ε<br />
ε<br />
ε<br />
= 1 0<br />
Equation 4<br />
Permittivity is a complex number given by:<br />
ε = ε'<br />
+ iε''<br />
Equation 5<br />
Where the complex permittivity is ε <strong>and</strong> ε' is the so called real part <strong>of</strong> the complex<br />
permittivity which directly <strong>in</strong>fluences the propagation velocity <strong>of</strong> EMR <strong>in</strong> materials with<br />
no loss. ε´´ is the imag<strong>in</strong>ary part <strong>of</strong> the complex permittivity which is related to the<br />
dielectric loss <strong>of</strong> the material caused by its conductivity. Conduct<strong>in</strong>g materials are<br />
generally opaque for EMR. Impurities <strong>of</strong> conduct<strong>in</strong>g materials can change the dielectric<br />
behaviour <strong>of</strong> matter as described <strong>in</strong> chapter 3.<br />
The velocity <strong>of</strong> EMR <strong>in</strong> a medium v is:
6 <strong>Application</strong> <strong>of</strong> GPR <strong>in</strong> glaciology <strong>and</strong> permafrost prospect<strong>in</strong>g<br />
v<br />
c<br />
= ε<br />
Equation 6<br />
At a boundary between to media <strong>of</strong> a different permittivity, a so called dielectric boundary<br />
some <strong>of</strong> the EMRs energy is reflected <strong>and</strong> some is refracted <strong>in</strong>to the other medium.<br />
The higher the difference between the refraction <strong>in</strong>dices <strong>of</strong> the two media is the more<br />
energy is reflected. With a decreas<strong>in</strong>g <strong>in</strong>cidence angle a bigger portion <strong>of</strong> energy is<br />
reflected, eventually lead<strong>in</strong>g to total reflection.<br />
For plane waves normal to the surface the amount <strong>of</strong> energy reflected <strong>and</strong> refracted is<br />
determ<strong>in</strong>ed by:<br />
n<br />
E '= ⎛ 2<br />
1<br />
⎞<br />
⎜ ⎟<br />
⎝ 2n + n ⎠<br />
E<br />
2 1<br />
<strong>and</strong><br />
E<br />
1<br />
⎛ n2 − n1⎞<br />
= ⎜ ⎟<br />
⎝ n + n ⎠<br />
E<br />
Equation 7<br />
2 1<br />
where E is the amount <strong>of</strong> <strong>in</strong>com<strong>in</strong>g EMR, E' is the amount <strong>of</strong> refracted EMR <strong>and</strong> E 1 is the<br />
amount <strong>of</strong> reflected EMR <strong>and</strong> n is the refractive <strong>in</strong>dex n= ε <strong>of</strong> the medium.<br />
Consider<strong>in</strong>g E, E' <strong>and</strong> E 1 to be the amplitude <strong>of</strong> electric field vectors no sign <strong>and</strong> therefore<br />
phase change occurs for the reflected wave E 1 with n 1 n 2 however the sign <strong>of</strong> E 1<br />
is changed <strong>in</strong> respect to E i.e. the reflected wavelet is phase changed. Also, equation 7<br />
demonstrates that the part <strong>of</strong> the wave that is refracted <strong>and</strong> passes through medium 2<br />
always rema<strong>in</strong>s <strong>in</strong> phase.<br />
At a dielectric boundary EMR gets either reflected, refracted <strong>in</strong> the material.<br />
Figure 3 Specular, diffuse <strong>and</strong> Lambertian reflections (Drury 1993)<br />
Reflection can be specular from a smooth surface, diffuse from a rough surface or as <strong>in</strong><br />
most cases <strong>in</strong> nature a Lambertian reflection which is the comb<strong>in</strong>ation <strong>of</strong> both. A surface<br />
appears smooth if its texture is smaller <strong>in</strong> scale than the wavelength <strong>of</strong> the EMR reflected.<br />
If the texture is about the same scale or larger than the wavelength the surface appears<br />
rough.<br />
1.2. Basic physics <strong>of</strong> radar<br />
Only low-loss <strong>and</strong> low-conductivity materials dom<strong>in</strong>ated by polarisation are dealt with<br />
here, as only those are amenable for GPR sound<strong>in</strong>g. (Davis & Annan 1989)<br />
<strong>Ground</strong> penetrat<strong>in</strong>g radar uses EMR <strong>in</strong> the microwave range with frequencies between 10<br />
<strong>and</strong> 1000 MHz. The <strong>in</strong>teraction <strong>of</strong> those waves with matter depends on the dielectric<br />
properties <strong>of</strong> the material for the named frequencies. Generally the velocity <strong>of</strong> the radar
<strong>Application</strong> <strong>of</strong> GPR <strong>in</strong> glaciology <strong>and</strong> permafrost prospect<strong>in</strong>g 7<br />
wave <strong>in</strong> the material varies with its dielectric permittivity. Variations <strong>in</strong> permittivity are the<br />
basis for GPR remote sens<strong>in</strong>g.<br />
The velocity <strong>in</strong> a medium v is:<br />
v<br />
c<br />
= ε<br />
Equation 8<br />
Attenuation <strong>in</strong>creases with ris<strong>in</strong>g frequency, very rapidly at frequencies above 100 MHz<br />
(Davis & Annan 1989).<br />
If radar waves meet a boundary <strong>of</strong> 2 materials with a different permittivity a part <strong>of</strong> there<br />
energy is reflected. See equation 7 <strong>in</strong> chapter 1.1.<br />
The resolution <strong>of</strong> a radar sound<strong>in</strong>g depends on its b<strong>and</strong>width which is the same as its<br />
frequency for a monopulse system like GPR, see chapter 1.3. Therefore wavelength limits<br />
the resolution.<br />
Material ε' σ [mS/m] v [m/ns] α [dB/m]<br />
Air 1 0 0.30 0<br />
Dest. Water 80 0.01 0.033 2 × 10 -3<br />
Fresh water 80 0.5 0.033 0.1<br />
Sea water 80 3 × 10 4 0.01 1000<br />
Dry s<strong>and</strong> 3-5 0.01 0.15 0.01<br />
Saturated s<strong>and</strong> 20-30 0.1-1.0 0.06 0.03-0.3<br />
Limestone 4-8 0.5-2 0.12 0.4-1<br />
Shales 5-15 1-100 0.09 1-100<br />
Silts 5-30 1-100 0.07 1-100<br />
Clays 5-40 2-1000 0.06 1-300<br />
Granite 4-6 0.01-1 0.13 0.01-1<br />
Ice 3-4 0.01 0.16 0.01<br />
Table 1 Parameters relevant to GPR <strong>of</strong> selected materials (Davis & Annan 1989)<br />
Table 1 shows the permittivity ε <strong>and</strong> the velocity v <strong>of</strong> the radar wave <strong>in</strong> the most important<br />
geologic materials. Furthermore the conductivity σ <strong>and</strong> attenuation α are listed. It is<br />
important to note the difference <strong>in</strong> relative permittivity for water, ice <strong>and</strong> dry or wet rock or<br />
sediments where the higher value st<strong>and</strong>s for dry rock or sediments. The great difference <strong>in</strong><br />
permittivity <strong>of</strong> liquid water to the other materials makes radar an effective tool on glaciers<br />
<strong>and</strong> permafrost where it is necessary to dist<strong>in</strong>guish between water <strong>and</strong> ice or to measure<br />
water content.<br />
GPR pulses are polarised which means that all electric field vectors are oriented <strong>in</strong> one<br />
plane <strong>and</strong> all magnetic field vectors perpendicular to it. (Davis & Annan 1989)<br />
1.3. Pr<strong>in</strong>ciples <strong>of</strong> GPR applications<br />
<strong>Ground</strong> penetrat<strong>in</strong>g radar is one form <strong>of</strong> radio echo sound<strong>in</strong>g (RES), operat<strong>in</strong>g at a<br />
frequency between 10 <strong>and</strong> 1000 MHz (Davis & Annan 1989) <strong>and</strong> us<strong>in</strong>g a monopulse as<br />
transmitted wave. GPR is a tool for relatively shallow penetration. Usually depths <strong>of</strong> only<br />
about 50 meters are exam<strong>in</strong>ed but also depth penetrations <strong>of</strong> 1000 meters have been<br />
achieved (Arcone et al. 1995). GPR has a very good resolution compared with other RES
8 <strong>Application</strong> <strong>of</strong> GPR <strong>in</strong> glaciology <strong>and</strong> permafrost prospect<strong>in</strong>g<br />
techniques which are used for a greater depth penetration for example to view bedrock<br />
under a thick ice sheet.<br />
GPR units consists pr<strong>in</strong>cipally <strong>of</strong> a control unit, a transmitter <strong>and</strong> a receiver. In modern<br />
systems these are connected by opto cables. A computer is commonly used for data<br />
collection. The transmitters <strong>and</strong> the antennas <strong>of</strong> transmitter <strong>and</strong> receiver can usually be<br />
changed to operate the GPR at different frequencies.<br />
The transmitter generates a very short high voltage pulse <strong>and</strong> transmits it <strong>in</strong>to the antenna,<br />
which emits EMR <strong>of</strong> a specific frequency <strong>in</strong>to the surround<strong>in</strong>g area. It transmits a mono<br />
pulse i.e. only one wavelength long which has got the shape <strong>of</strong> a small negative, a large<br />
positive <strong>and</strong> aga<strong>in</strong> a small negative amplitude as shown <strong>in</strong> figure 4. It transmits only one<br />
pulse every time it receives a signal from the control unit.<br />
Figure 4<br />
Representation <strong>of</strong> a pulse transmitted by a GPR system<br />
The receiver collects <strong>in</strong>com<strong>in</strong>g signals <strong>in</strong> samples which are a digital representation <strong>of</strong> the<br />
amplitude <strong>and</strong> phase <strong>of</strong> the signal <strong>in</strong> a certa<strong>in</strong> unit <strong>of</strong> time. In modern GPR units a sample<br />
is recorded as a 16 bit number. This is important for the systems resolution, especially if a<br />
week echo from a greater depth is displayed with <strong>in</strong>creased amplitude by a ga<strong>in</strong> amplifier,<br />
see chapter 2.1.<br />
To improve a systems ratio between signal <strong>and</strong> noise, several samples that have been<br />
recorded simultaneously can be put together to a so called stack by calculat<strong>in</strong>g their mean<br />
value.<br />
GPR systems transmit a b<strong>and</strong>width <strong>of</strong> frequencies that is equal to their centre frequency,<br />
the frequency where most energy is emitted. The pulse length is <strong>in</strong>versely proportional to<br />
the centre frequency. (Davis & Annan 1989) As GPR represents a mono-pulse system<br />
(pulse <strong>of</strong> one wavelength at the centre frequency) the pulse length is 1/f. Resolution <strong>and</strong><br />
attenuation <strong>in</strong>crease with <strong>in</strong>creas<strong>in</strong>g frequencies <strong>and</strong> therefore with <strong>in</strong>creas<strong>in</strong>g b<strong>and</strong>widths<br />
as well. This is one reason to make GPR units operable at different frequencies.<br />
Other RES systems which are used for a greater depth penetration use longer transmitted<br />
pulses <strong>and</strong> are able to penetrate up to 5 km <strong>of</strong> ice for, example.<br />
The transmitted radar beam can be roughly described as conical. (Arcone et al. 1995).<br />
Therefore the received signal is not only received from directly beneath the antenna but<br />
also from a larger area around.
<strong>Application</strong> <strong>of</strong> GPR <strong>in</strong> glaciology <strong>and</strong> permafrost prospect<strong>in</strong>g 9<br />
In radar sound<strong>in</strong>g there is a direct coupl<strong>in</strong>g between the antennas <strong>of</strong> transmitter <strong>and</strong><br />
receiver. The signal from the transmitter which propagates directly through the air to the<br />
receiver is called the air wave. The other part <strong>of</strong> the direct coupl<strong>in</strong>g, the ground wave,<br />
travels on the shortest way trough the ground. When separat<strong>in</strong>g the receiver from the<br />
transmitter, the two components <strong>of</strong> the direct coupl<strong>in</strong>g, air <strong>and</strong> ground wave can be<br />
dist<strong>in</strong>guished as they vary <strong>in</strong> travel time due to different dielectric constants <strong>of</strong> air <strong>and</strong> the<br />
ground. See chapter 2.<br />
Usually transmitter <strong>and</strong> receiver are placed <strong>in</strong> a fixed configuration with a def<strong>in</strong>ed distance<br />
to each other <strong>and</strong> moved over the ground simultaneously. A hip cha<strong>in</strong> or a wheel measur<strong>in</strong>g<br />
the mov<strong>in</strong>g velocity <strong>of</strong> the equipment can be connected to the control unit to guarantee the<br />
collect<strong>in</strong>g <strong>of</strong> data at equidistant positions.<br />
2. GPR data <strong>in</strong>terpretation<br />
2.1. Visualisation <strong>of</strong> radar data<br />
When collect<strong>in</strong>g data with a GPR unit which is moved over the ground traces are collected<br />
at equidistant positions along the pr<strong>of</strong>ile. A trace shows the received signal at a position as<br />
follows: On one axis the amplitude <strong>of</strong> the signal <strong>and</strong> at the other the time the signal needed<br />
after the first sample was collected (signal position). This means for reflected signals the<br />
time from the transmitter to reflector <strong>and</strong> from there to the receiver the so called two way<br />
travel time is recorded.<br />
Figure 5<br />
A received radar signal trace accompanied by its graphic recorder<br />
display <strong>in</strong> l<strong>in</strong>e <strong>in</strong>tensity format (Annan & Davis 1976)<br />
As the amplitudes <strong>of</strong> the reflected signal decrease heavily with longer travel times, i.e.<br />
greater depth <strong>of</strong> the reflector, a time variable ga<strong>in</strong> amplifier whose ga<strong>in</strong> <strong>in</strong>creases with<br />
return time is applied to the system (Annan & Davis 1976). The ga<strong>in</strong> can be varied so that
10 <strong>Application</strong> <strong>of</strong> GPR <strong>in</strong> glaciology <strong>and</strong> permafrost prospect<strong>in</strong>g<br />
it <strong>in</strong>creases l<strong>in</strong>ear or exponential as it is required for the specific use for example at<br />
different materials or frequencies.<br />
The s<strong>in</strong>gle traces usually recorded will be transferred <strong>in</strong>to a graphical image. The<br />
horizontal axis hereby displays the antenna position <strong>in</strong> relation to the start<strong>in</strong>g po<strong>in</strong>t <strong>of</strong> the<br />
pr<strong>of</strong>ile. The vertical axis represent a time scale for the radar signal delay time after signal<br />
position. If the GPR unit is not connected to an equipment measur<strong>in</strong>g the right distance for<br />
collect<strong>in</strong>g a trace to the previous one the horizontal axis commonly represents a time scale<br />
after the start <strong>of</strong> the pr<strong>of</strong>ile collection (Annan & Davis 1976).<br />
One possibility <strong>of</strong> visualisation is the so called l<strong>in</strong>e <strong>in</strong>tensity format where s<strong>in</strong>gle traces are<br />
not displayed <strong>and</strong> the grey level <strong>of</strong> the plot gives the amplitude <strong>of</strong> the signal for <strong>in</strong>dividual<br />
samples (Arcone et al. 1995), see figure 6.<br />
Figure 6<br />
<strong>Radar</strong> data displayed <strong>in</strong> l<strong>in</strong>e <strong>in</strong>tensity format<br />
Another way <strong>of</strong> visualisation <strong>of</strong> a recorded pr<strong>of</strong>ile is the so-called wiggle trace image<br />
(Arcone et al. 1995) where the traces are displayed as graph <strong>of</strong> amplitude <strong>and</strong> delay time<br />
<strong>and</strong> comb<strong>in</strong>ed to an image show<strong>in</strong>g them at the position they where collected, see figure 7.<br />
Hereby the amplitudes <strong>of</strong> a strong signal recorded by neighbour<strong>in</strong>g traces are overlapp<strong>in</strong>g<br />
each other which produces a picture similar to that given by the l<strong>in</strong>e <strong>in</strong>tensity format.
<strong>Application</strong> <strong>of</strong> GPR <strong>in</strong> glaciology <strong>and</strong> permafrost prospect<strong>in</strong>g 11<br />
Figure 7<br />
<strong>Radar</strong> data displayed <strong>in</strong> wiggle trace format<br />
2.2. Incorporat<strong>in</strong>g additional sources <strong>of</strong> <strong>in</strong>formation<br />
The result <strong>of</strong> a GPR sound<strong>in</strong>g is a qualitative statement <strong>in</strong> the form <strong>of</strong> delay time <strong>of</strong> the<br />
received signal versus signal level yield<strong>in</strong>g a reconnaissance map for subsurface structures<br />
(Annan & Davis 1979). Mostly, however it is important to <strong>in</strong>vestigate the depth <strong>of</strong><br />
reflectors or the properties <strong>of</strong> materials. Given the two way travel time <strong>and</strong> know<strong>in</strong>g either<br />
the dielectric behaviour <strong>of</strong> the probed terra<strong>in</strong> or the depth <strong>of</strong> reflectors the miss<strong>in</strong>g value<br />
can be calculated. The permittivity allows conclusions on the nature <strong>of</strong> the material it<br />
occurs <strong>in</strong> to be drawn.<br />
The Equation below can be used for calculations <strong>in</strong> s<strong>in</strong>gle layered systems (modified after<br />
Davis & Annan 1989).<br />
d<br />
tc<br />
= ⇔ ε = ⎛ 2 ε ⎝ ⎜ tc ⎞<br />
⎟<br />
2d ⎠<br />
2<br />
⇔<br />
t<br />
d<br />
= 2 ε Equation 9<br />
c<br />
where d is the depth to a reflector, t is the two way travel time <strong>of</strong> the radar pulse, c is the<br />
speed <strong>of</strong> light <strong>in</strong> vacuum <strong>and</strong> ε is the permittivity <strong>of</strong> the material overly<strong>in</strong>g the reflector.<br />
The depth <strong>of</strong> horizons or po<strong>in</strong>t reflectors can be obta<strong>in</strong>ed through prob<strong>in</strong>g, drill<strong>in</strong>g <strong>and</strong> core<br />
sampl<strong>in</strong>g, digg<strong>in</strong>g or various other geophysical methods. Values <strong>of</strong> the permittivity can<br />
either be approximated from a look up table or measured on samples. In addition, two ways<br />
to determ<strong>in</strong>e the depth <strong>of</strong> a reflector or permittivity by means <strong>of</strong> radar sound<strong>in</strong>g are<br />
presented below.<br />
Sampl<strong>in</strong>g <strong>of</strong> subsurface materials as a reference however, yields much more <strong>in</strong>formation<br />
<strong>and</strong> a better pro<strong>of</strong> <strong>of</strong> results than pure remote sens<strong>in</strong>g techniques.<br />
2.3. Hyperbolas<br />
GPR units assume that a reflected signal comes from directly beneath the antenna.<br />
However, radar antennas always operate with more or less conical beams; <strong>in</strong> the case <strong>of</strong><br />
most commercial units this is about 35° to 45°. This means that a return signal can be
12 <strong>Application</strong> <strong>of</strong> GPR <strong>in</strong> glaciology <strong>and</strong> permafrost prospect<strong>in</strong>g<br />
recorded even though the antennas are not directly over a reflect<strong>in</strong>g object. The radar sees<br />
this target from a number <strong>of</strong> different angles but always records it as if it was directly<br />
underneath the location <strong>of</strong> this trace which produces the characteristic hyperbolic shape<br />
(ERA 1996) as illustrated <strong>in</strong> figure 8.<br />
Field measurement<br />
Air<br />
<strong>Radar</strong> image<br />
1 2 3<br />
S<br />
1<br />
2<br />
3<br />
ε 1<br />
Figure 8 Generation <strong>of</strong> hyperbolas <strong>in</strong> radar images (after ERA 1996).<br />
The numbers 1,2 <strong>and</strong> 3 show the positions <strong>of</strong> the GPR unit <strong>in</strong> the field survey <strong>and</strong> their<br />
traces <strong>in</strong> the image that was produced. The dotted l<strong>in</strong>es <strong>in</strong>dicate the distance between the<br />
radar unit <strong>and</strong> the reflector. These distances are used as if they were vertical travel times <strong>in</strong><br />
the radargram.<br />
In the produced image the highest po<strong>in</strong>t <strong>of</strong> the hyperbola <strong>in</strong>dicates the actual position <strong>of</strong> the<br />
reflector assum<strong>in</strong>g that it is not out <strong>of</strong> the pr<strong>of</strong>ile sideways.<br />
Some s<strong>of</strong>tware packages for GPR data process<strong>in</strong>g <strong>in</strong>clude features for the calculation <strong>of</strong> the<br />
permittivity <strong>of</strong> the material overly<strong>in</strong>g the reflector from hyperbolas. Also, hyperbolic<br />
shapes can be removed from radar images, i.e. the reflected signal assigned spatially to its<br />
real source, by a process called migration (Arcone et al. 1995).<br />
2.4. Wide angle reflection <strong>and</strong> refraction (WARR) <strong>and</strong><br />
Common midpo<strong>in</strong>t (CMP) methods.<br />
Wide angle reflection <strong>and</strong> refraction (WARR) <strong>and</strong> Common midpo<strong>in</strong>t (CMP) surveys are<br />
used to obta<strong>in</strong> an estimate <strong>of</strong> the radar signal velocity versus depth <strong>in</strong> the ground by vary<strong>in</strong>g<br />
the antenna spac<strong>in</strong>g at a fixed location <strong>and</strong> measur<strong>in</strong>g two-way-travel times <strong>of</strong> the returned<br />
signals (Davis & Annan 1989).<br />
Figure 9 shows a simplistic diagram <strong>of</strong> signal arrival <strong>in</strong> a WARR sound<strong>in</strong>g over a non<strong>in</strong>cl<strong>in</strong>ed<br />
s<strong>in</strong>gle subsurface <strong>in</strong>terface:<br />
t
<strong>Application</strong> <strong>of</strong> GPR <strong>in</strong> glaciology <strong>and</strong> permafrost prospect<strong>in</strong>g 13<br />
WARR field setup<br />
S<br />
Air<br />
WARR radar image<br />
S 1 S 2<br />
S<br />
Tx<br />
A<br />
G<br />
Rx<br />
t A<br />
d<br />
R<br />
ε 1<br />
t 1<br />
t 2<br />
t G<br />
ε 2<br />
t<br />
t R<br />
Figure 9<br />
Schematic representation <strong>of</strong> a WARR survey <strong>and</strong> the terms used<br />
there<strong>in</strong> (after Annan & Davis, 1976)<br />
Air wave A, ground wave G <strong>and</strong> the reflected signal R always produce the characteristic<br />
image <strong>of</strong> two straight <strong>and</strong> one concave l<strong>in</strong>e. S represents antenna spac<strong>in</strong>g, d the depth <strong>of</strong> the<br />
reflect<strong>in</strong>g horizon <strong>and</strong> ε 1 <strong>and</strong> ε 2 refer to different permittivities <strong>of</strong> subsurface materials. Tx<br />
is the transmitter <strong>and</strong> Rx the receiver <strong>of</strong> the system. If S is not recorded it can be calculated<br />
from the arrival time <strong>of</strong> the air wave t A <strong>and</strong> the speed <strong>of</strong> light <strong>in</strong> air c us<strong>in</strong>g S = ct A<br />
.<br />
The arrival time <strong>of</strong> the ground wave t G <strong>and</strong> antenna separation S yield the signal velocity <strong>in</strong><br />
the near surface ground v G <strong>and</strong> t G <strong>and</strong> t A yield an approximation <strong>of</strong> the permittivity <strong>of</strong> the<br />
near subsurface:<br />
v<br />
G<br />
S<br />
= ε = ⎛ t ⎝ ⎜ t ⎞<br />
A<br />
⎟<br />
t ⎠<br />
G<br />
G<br />
2<br />
The depth d to the reflect<strong>in</strong>g horizon is given by:<br />
Equation 10<br />
d<br />
=<br />
2<br />
t S<br />
2<br />
2<br />
1<br />
2<br />
− t S<br />
1<br />
2<br />
2<br />
2 2<br />
4( t − t )<br />
1<br />
2<br />
Equation 11<br />
The permittivity above this horizon ε 1 can be derived by:<br />
2<br />
0<br />
ε 1<br />
= ⎛ ⎝ ⎜ ct ⎞<br />
⎟<br />
Equation 12<br />
2d<br />
⎠<br />
where t 0 is the two-way-travel time with m<strong>in</strong>imum antenna spac<strong>in</strong>g i.e. a vertically<br />
travell<strong>in</strong>g signal. Some s<strong>of</strong>tware packages for radar data process<strong>in</strong>g feature WARR<strong>in</strong>terpretation<br />
capabilities.<br />
The common midpo<strong>in</strong>t method (CMP) is a variant <strong>of</strong> WARR that is less sensitive to<br />
<strong>in</strong>cl<strong>in</strong>ations between surface <strong>and</strong> <strong>in</strong>ternal reflectors because reflection always occurs at<br />
approximately the same po<strong>in</strong>t as figure 10 illustrates:
14 <strong>Application</strong> <strong>of</strong> GPR <strong>in</strong> glaciology <strong>and</strong> permafrost prospect<strong>in</strong>g<br />
CMP<br />
WARR<br />
S 1<br />
S 2<br />
Air<br />
S 1<br />
S 2<br />
Air<br />
Tx Tx Rx Rx<br />
Tx Rx<br />
Rx<br />
ε 1<br />
d 1 =d 2 d 1 d 2<br />
ε 1<br />
ε 2<br />
ε 2<br />
Figure 10<br />
On sloped reflect<strong>in</strong>g horizons WARR produces a bigger error than<br />
CMP due to chang<strong>in</strong>g depth <strong>of</strong> the po<strong>in</strong>t <strong>of</strong> reflection dur<strong>in</strong>g the survey.<br />
In this case both, transmitter <strong>and</strong> receiver are moved apart <strong>in</strong> opposite directions at equal<br />
speed which makes CMP slower <strong>and</strong> more awkward <strong>in</strong> the field than WARR. The<br />
produced radargram as well as the data calculation are the same as for the WARR method.<br />
Care should be taken when apply<strong>in</strong>g results from WARR or CMP sound<strong>in</strong>gs to pr<strong>of</strong>iles as<br />
sometimes (e.g. Judge et al. 1991) surface <strong>and</strong> subsurface conditions vary considerably<br />
over short distances.<br />
3. Use <strong>of</strong> GPR on Glaciers<br />
GPR is an efficient tool for mapp<strong>in</strong>g various structures on glaciers as different types <strong>of</strong> ice<br />
vary strongly <strong>in</strong> their response to radar sound<strong>in</strong>g.<br />
Glacier ice can be roughly divided <strong>in</strong>to two sections: Ice which is at or close to its pressure<br />
melt<strong>in</strong>g po<strong>in</strong>t, so called temperate ice, <strong>and</strong> ice which is below this temperature, so called<br />
cold ice. Temperate ice conta<strong>in</strong>s various amounts <strong>of</strong> water <strong>in</strong> liquid form <strong>in</strong> cavities,<br />
channels <strong>and</strong> between gra<strong>in</strong> (crystal) boundaries. Cold ice does usually not conta<strong>in</strong> liquid<br />
water <strong>in</strong> channels or cavities <strong>and</strong> the amount <strong>of</strong> quasi liquid water at the gra<strong>in</strong> boundaries<br />
rema<strong>in</strong>s less than <strong>in</strong> temperate ice <strong>and</strong> decreases with decreas<strong>in</strong>g temperature.<br />
Temperate ice is found <strong>in</strong> so called temperate glaciers <strong>and</strong> polythermal glaciers which also<br />
conta<strong>in</strong> cold ice. Those glaciers are situated <strong>in</strong> mounta<strong>in</strong> areas as for examples <strong>in</strong> the Alps<br />
or <strong>in</strong> subpolar regions like Svalbard. High polar glaciers <strong>and</strong> ice sheets conta<strong>in</strong> usually cold<br />
ice only.<br />
One fact that makes glaciers suitable for radar sound<strong>in</strong>g is the great difference <strong>in</strong><br />
permittivity <strong>of</strong> water <strong>in</strong> liquid <strong>and</strong> crystall<strong>in</strong>e form as shown <strong>in</strong> table 1.<br />
The difference <strong>in</strong> permittivity for water <strong>and</strong> ice at radar frequencies is due to the fact that<br />
water molecules are able to move free <strong>in</strong> the liquid while <strong>in</strong> ice they are fixed <strong>in</strong> a crystal<br />
lattice. At frequencies around 100 Hz, much lower than those used for radar the<br />
polarisation <strong>of</strong> the water molecule <strong>in</strong> the ice crystals is similar to those <strong>in</strong> liquid water <strong>and</strong><br />
therefore permittivity <strong>of</strong> ice at those frequencies is about 90.<br />
The frequency <strong>of</strong> radar waves still allows the water dipoles to rotate <strong>in</strong>to the field direction<br />
, which is called polarisation, while the molecules <strong>in</strong> the ice crystals are now unable to<br />
rotate. This is caus<strong>in</strong>g the high dielectric constant <strong>of</strong> water compared to ice at radar<br />
frequencies. Therefore cold <strong>and</strong> temperate ice are usually easy to dist<strong>in</strong>guish by GPR.
<strong>Application</strong> <strong>of</strong> GPR <strong>in</strong> glaciology <strong>and</strong> permafrost prospect<strong>in</strong>g 15<br />
At higher frequencies (GHz) the field oscillations are too fast to allow the dipoles to rotate<br />
<strong>and</strong> the dielectric constant <strong>of</strong> liquid water becomes similar to what the one <strong>of</strong> ice is at radar<br />
frequencies. (Moore1988)<br />
Furthermore the density <strong>of</strong> the ice or firn mean<strong>in</strong>g the ratio between ice <strong>and</strong> air causes<br />
changes <strong>in</strong> permittivity <strong>and</strong> therefore velocity <strong>of</strong> the radar waves as expressed by Rob<strong>in</strong> <strong>in</strong><br />
his equation which is only valid for dry ice or firn: (Kohler et al., <strong>in</strong> press)<br />
ct<br />
D =<br />
21 ( + 085 . ρ)<br />
ε<br />
d<br />
Equation 13a<br />
= 1+<br />
0. 00085ρ<br />
Equation 13b<br />
d<br />
where D is the depth to the reflect<strong>in</strong>g horizon, t is the two way travel time to the reflect<strong>in</strong>g<br />
horizon <strong>and</strong> ρ is the average density <strong>of</strong> the firn or ice above the reflect<strong>in</strong>g horizon <strong>in</strong> kg m 3 .<br />
ε d <strong>and</strong> ρ d are the permittivity <strong>and</strong> the density <strong>of</strong> dry ice or firn.<br />
The permittivity can be calculated after equation 13b for its relation to the density <strong>of</strong> dry<br />
ice for firn denser than 300 kg/m².<br />
Equation 14 <strong>and</strong> 15 show a quantitative relation between permittivity <strong>and</strong> water content <strong>in</strong><br />
temperate ice.<br />
To calculate the difference <strong>in</strong> permittivity <strong>of</strong> dry <strong>and</strong> wet ice or firn due to large<br />
concentrations <strong>of</strong> spherical air or water <strong>in</strong>clusions with known water content by volume the<br />
equations by Looyenga (1965, quoted <strong>in</strong> Macheret et al. 1993) can be used:<br />
( i )<br />
ε = 1+ θ ε −1<br />
Equation 14<br />
3 3<br />
d<br />
( 1 )( )<br />
ε = ε −θ ε − ε<br />
Equation 15<br />
3 3 3 3<br />
s d w d<br />
where ε d is the permittivity <strong>of</strong> dry ice or firn, ε s is wet ice or firn ε i is dry solid ice with a<br />
known permittivity <strong>of</strong> 3.2, ε w is the permittivity <strong>of</strong> water, <strong>and</strong> θ is water content expressed<br />
as a percentage. A good approximation <strong>of</strong> the permittivity for dry ice or firn above 300 Kg<br />
per cubic meter is already given by equation 13b.<br />
If water <strong>in</strong>clusions are distributed r<strong>and</strong>omly throughout the ice, Parens equation (Macheret<br />
et al. 1993) can be used as shown <strong>in</strong> equation 16:<br />
1<br />
ε ε ( θ)<br />
s<br />
=<br />
d<br />
+ 1−<br />
εw<br />
Equation 16<br />
3<br />
Where ε d could be taken from equation 13b.<br />
If velocity, or the permittivity, is known for example from a WARR survey those equations<br />
can be used to estimate the water content.<br />
Internal reflectios correspond<strong>in</strong>g to layers <strong>of</strong> different permittivity due to water content are<br />
<strong>of</strong>ten found <strong>in</strong> polythermal glaciers. These glaciers conta<strong>in</strong> a cold upper layer <strong>and</strong> a<br />
temperate, water saturated lower layer with a high permittivity <strong>in</strong> their middle section.<br />
Those boundaries usually form a reflection horizon for radar waves.
16 <strong>Application</strong> <strong>of</strong> GPR <strong>in</strong> glaciology <strong>and</strong> permafrost prospect<strong>in</strong>g<br />
T<br />
C<br />
Figure 11<br />
Schematic pr<strong>of</strong>ile <strong>of</strong> a polythermal glacier. C is cold ice, T is<br />
temperate ice <strong>and</strong> shaded area is bedrock. The transition, which is a<br />
l<strong>in</strong>e here, would appear as a reflect<strong>in</strong>g horizon on a radar pr<strong>of</strong>ile.<br />
Temperate ice sometimes shows different reflection areas due to layers <strong>of</strong> chang<strong>in</strong>g water<br />
content <strong>in</strong> cavities or channels such as the two temperate layers <strong>in</strong> Hansbreen mapped by<br />
Macheret (Macheret et al. 1993)<br />
The best time to use GPR on glaciers <strong>in</strong> temperate regions is w<strong>in</strong>ter or spr<strong>in</strong>g to avoid a<br />
wet ice surface layer with high thaw water content which would decrease the penetration<br />
depth. (Macharet et al. 1993)<br />
GPR has been used on polythermal glaciers for mapp<strong>in</strong>g <strong>in</strong>ternal structures, i.e. cold <strong>and</strong><br />
temperate ice layers, but also for detect<strong>in</strong>g smaller structures like crevasses <strong>and</strong> large water<br />
<strong>and</strong> air filled cavities. For detection <strong>of</strong> the structures permittivity relative to the overly<strong>in</strong>g,<br />
the phase change <strong>of</strong> the reflected radar wave can be viewed (Arcone et al. 1995).<br />
In general radar waves <strong>of</strong> higher frequencies are commonly used to detect <strong>in</strong>ternal<br />
structures <strong>of</strong> glaciers due to their higher resolution while lower frequencies are more<br />
suitable to penetrate the ice to view the bottom topography. (Bjoernson et al.1996) Those<br />
lower frequencies are more commonly used by other RES techniques.<br />
Impurities such as silt <strong>and</strong> debris cause a higher permittivity due to slightly higher<br />
permittivities <strong>of</strong> rock material to dry ice <strong>and</strong> to the scatter<strong>in</strong>g effects due to the reflections<br />
on the particle surface (depend<strong>in</strong>g on size <strong>and</strong> wavelength). Such impurities help detect<strong>in</strong>g<br />
layers <strong>of</strong> basal ice (Arcone et al. 1995).<br />
GPR has been used at high frequencies (500 MHz) for mass balance measurements on<br />
temperate glaciers to detect the last summers surface under the w<strong>in</strong>ter snow at the end <strong>of</strong><br />
the w<strong>in</strong>ter season (Kohler et al. <strong>in</strong> press). In ablation areas <strong>and</strong> superimposed ice the<br />
reflection <strong>of</strong> the ice layer was used while <strong>in</strong> the accumulation area the ice layer is th<strong>in</strong> <strong>and</strong><br />
density changes can be detected. The amount <strong>of</strong> snow could be calculated by Rob<strong>in</strong>s<br />
Equation when know<strong>in</strong>g the density or depth. To pro<strong>of</strong> the method <strong>and</strong> to get additional<br />
data about the depth <strong>of</strong> the layer, cores where drilled <strong>and</strong> dielectric measurements where<br />
taken <strong>in</strong> comb<strong>in</strong>ation to manual sound<strong>in</strong>g <strong>and</strong> visual stratigraphy.<br />
<strong>Radar</strong> has been used to map older annual layers <strong>in</strong> glaciers. Those are thought to reflect<br />
radar waves due to density changes <strong>and</strong> changes <strong>in</strong> crystal structure.<br />
As the resolution <strong>of</strong> the radar depends on its frequency it is possible to use a multi<br />
frequency radar to detect the size <strong>of</strong> a po<strong>in</strong>t reflector by f<strong>in</strong>d<strong>in</strong>g the boundary frequency
<strong>Application</strong> <strong>of</strong> GPR <strong>in</strong> glaciology <strong>and</strong> permafrost prospect<strong>in</strong>g 17<br />
that just detects it. This method was used to scale crevasses <strong>and</strong> bottom structures <strong>in</strong><br />
Antarctic ice streams.<br />
Another factor that causes reflection <strong>in</strong> ice is the change <strong>in</strong> conductivity due to chemical<br />
impurities, which are ma<strong>in</strong>ly situated at gra<strong>in</strong> boundaries. This becomes important <strong>in</strong> polar<br />
ice sheets where changes <strong>in</strong> conductivity are more thought to cause <strong>in</strong>ternal reflections than<br />
permittivity changes <strong>in</strong> a depth greater than a few hundred meters. Therefore this sound<strong>in</strong>gs<br />
are more commonly done by other RES techniques due to the required depth <strong>of</strong><br />
penetration. As high polar ice sheets conta<strong>in</strong> generally cold ice only the <strong>in</strong>ternal reflections<br />
are not caused by changes <strong>in</strong> permittivity which is shown to be ma<strong>in</strong>ly a function <strong>of</strong> depth<br />
due to <strong>in</strong>creas<strong>in</strong>g density, see equation 13b. The reflections are caused by different<br />
conductivities which are due to changes <strong>in</strong> acidity <strong>and</strong> other chemical impurities due to<br />
volcanic eruptions <strong>and</strong> changes <strong>in</strong> climatic conditions. The ice <strong>of</strong> the Greenl<strong>and</strong> ice sheet<br />
for example that was deposited dur<strong>in</strong>g the Wiscons<strong>in</strong> glaciation period is alkal<strong>in</strong>e due to<br />
higher amounts <strong>of</strong> dust while the Holocene is acidic. Those conductivity changes are much<br />
greater than those found by density changes (Moore 1988).<br />
4. GPR <strong>and</strong> permafrost<br />
Permafrost is def<strong>in</strong>ed as any material that ma<strong>in</strong>ta<strong>in</strong>s a temperature below 0 °C for at least<br />
two years. For practical reasons however it is widely accepted to use the term permafrost<br />
where temperatures rema<strong>in</strong> below 0 °C over one summer.<br />
Especially <strong>in</strong> areas without cont<strong>in</strong>uous permafrost its occurrence <strong>and</strong> properties show a<br />
strong lateral variability <strong>in</strong> response to exposition, ground composition local hydrology <strong>and</strong><br />
microclimate. Permafrost is also subject to temporal variations <strong>in</strong> response to changes <strong>in</strong><br />
surface conditions or climate <strong>and</strong> therefore <strong>of</strong> <strong>in</strong>terest for <strong>in</strong>vestigations <strong>of</strong> global warm<strong>in</strong>g<br />
trends.<br />
The practical <strong>in</strong>terest <strong>in</strong> <strong>in</strong>vestigat<strong>in</strong>g permafrost arises form the cont<strong>in</strong>u<strong>in</strong>g expansion <strong>of</strong><br />
<strong>in</strong>frastructure <strong>in</strong>to areas with permafrost occurrence. As geologic materials exhibit very<br />
different physical behaviours <strong>in</strong> the presence <strong>of</strong> liquid water or ice it is vital basis for<br />
plann<strong>in</strong>g <strong>and</strong> eng<strong>in</strong>eer<strong>in</strong>g to know the spatial <strong>and</strong> temporal variations <strong>in</strong> freez<strong>in</strong>g <strong>and</strong><br />
thaw<strong>in</strong>g <strong>of</strong> the ground that underlies <strong>and</strong> surrounds a planned object. Furthermore it can be<br />
desirable to monitor the formation or degradation <strong>of</strong> permafrost due to human activities<br />
<strong>and</strong> there is a scientific <strong>in</strong>terest <strong>in</strong> <strong>in</strong>vestigat<strong>in</strong>g permafrost distribution <strong>and</strong> properties.<br />
As the application <strong>of</strong> GPR on permafrost uses the strong dielectric contrast between liquid<br />
water <strong>and</strong> ice to dist<strong>in</strong>guish between frozen <strong>and</strong> unfrozen materials it is not suitable for<br />
detect<strong>in</strong>g dry permafrost i.e. frozen bedrock. GPR responds to the physical properties <strong>of</strong> the<br />
ground <strong>and</strong> does not reveal the actual composition <strong>of</strong> soil or rock (Judge et al. 1991).<br />
Therefore additional <strong>in</strong>formation e.g. from bore holes is needed if the exact composition <strong>of</strong><br />
subsurface materials is <strong>of</strong> <strong>in</strong>terest. In most cases however <strong>in</strong>vestigat<strong>in</strong>g permafrost<br />
primarily means the detection <strong>of</strong> <strong>in</strong>terfaces between materials conta<strong>in</strong><strong>in</strong>g liquid <strong>and</strong> frozen<br />
water. Additionally the exploration <strong>of</strong> stratigraphy <strong>and</strong> <strong>of</strong> massive ground ice are <strong>of</strong>ten<br />
desirable.<br />
As figure 13 shows, most frost <strong>in</strong>terfaces exhibit annual variations. Some shallow diurnal<br />
fluctuations can be observed, too. It is therefore necessary to carefully consider the tim<strong>in</strong>g<br />
<strong>of</strong> a GPR survey on permafrost depend<strong>in</strong>g on the aim <strong>of</strong> it.
18 <strong>Application</strong> <strong>of</strong> GPR <strong>in</strong> glaciology <strong>and</strong> permafrost prospect<strong>in</strong>g<br />
MAGT<br />
0 ºC<br />
negative temperature<br />
positive temperature<br />
A C T I V E L A Y E R<br />
ground surface<br />
permafrost table<br />
depth <strong>of</strong> freez<strong>in</strong>g front<br />
depth <strong>of</strong> thaw<br />
depth <strong>of</strong> ZAA<br />
P E R M A F R O S T<br />
temperature<br />
<strong>in</strong> late w<strong>in</strong>ter<br />
temperature<br />
<strong>in</strong> late summer<br />
depth limit <strong>of</strong> permafrost<br />
autumn<br />
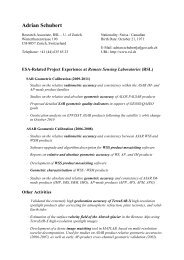
Figure 12 Schematic cross-section <strong>of</strong> permafrost (after K<strong>in</strong>g, 1984)<br />
spr<strong>in</strong>g<br />
Figure 12 shows a vertical section through ground conta<strong>in</strong><strong>in</strong>g permafrost <strong>in</strong> order to def<strong>in</strong>e<br />
some frequently used terms. The ground temperature regime is show schematically for late<br />
w<strong>in</strong>ter <strong>and</strong> late summer, <strong>and</strong> the mean annual ground temperature (MAGT) as well as the<br />
depth <strong>of</strong> the zero annual amplitude (ZAA) are <strong>in</strong>dicated. As ice wedges, which are not<br />
shown <strong>in</strong> this diagram, do not extend <strong>in</strong>to the active layer (Williams & Smith 1989) their<br />
detection can give an estimate <strong>of</strong> the depth <strong>of</strong> the permafrost table.<br />
The depth to which a radar pulse will effectively penetrate is dependent upon the power<br />
<strong>and</strong> performance <strong>of</strong> the system, the frequency <strong>of</strong> the pulse, the number <strong>and</strong> strength <strong>of</strong><br />
reflect<strong>in</strong>g <strong>in</strong>terfaces <strong>and</strong> the attenuation properties <strong>of</strong> subsurface materials.<br />
GPR produces better results <strong>in</strong> well-dra<strong>in</strong>ed, course materials than <strong>in</strong> f<strong>in</strong>e gra<strong>in</strong>ed ones as<br />
granular material produces less signal attenuation (Judge et al. 1991). In s<strong>and</strong>, gravel <strong>and</strong><br />
rock GPR has been demonstrated to sound to depths <strong>of</strong> 50 m but the range decreases to a<br />
few meters <strong>in</strong> conductive materials such as moist silts or soils with sal<strong>in</strong>e pore water<br />
(Davis & Annan 1989). Clays are virtually opaque to microwaves. Also, the presence <strong>of</strong><br />
boulders <strong>and</strong> blocks larger than one wavelength attenuates the signal due to scatter<strong>in</strong>g <strong>and</strong><br />
thus reduces the depth <strong>of</strong> sound<strong>in</strong>g.<br />
The electric/dielectric properties <strong>of</strong> ground materials are partly determ<strong>in</strong>ed by their dry<br />
characteristics i.e. gra<strong>in</strong> size distribution, porosity <strong>and</strong> m<strong>in</strong>eral composition. In dependence<br />
on these dry properties the amount <strong>of</strong> liquid water, ice <strong>and</strong> air present <strong>in</strong> the ground greatly<br />
<strong>in</strong>fluences its electric/dielectric properties <strong>and</strong> thus reflection from <strong>in</strong>terfaces <strong>and</strong><br />
attenuation <strong>of</strong> the transmitted signal.<br />
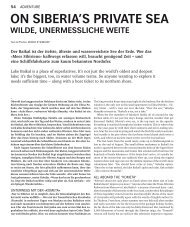
Pore water usually freezes <strong>and</strong> therefore effects a significant change <strong>in</strong> the ground<br />
dielectric constant at 0 °C. F<strong>in</strong>e gra<strong>in</strong>ed materials however, have the ability to reta<strong>in</strong> a<br />
some molecules thick layer <strong>of</strong> unfrozen water even several degrees below zero as shown <strong>in</strong><br />
figure 14. Between 0 <strong>and</strong> -1.5 °C capillarity is responsible for much <strong>of</strong> the freez<strong>in</strong>g po<strong>in</strong>t<br />
depression (Williams & Smith 1989). The amount <strong>of</strong> water adsorbed on particle surfaces or<br />
kept liquid <strong>in</strong> capillarys is a function <strong>of</strong> the particle surface, i.e. gra<strong>in</strong> size distribution, <strong>and</strong><br />
its temperature.
<strong>Application</strong> <strong>of</strong> GPR <strong>in</strong> glaciology <strong>and</strong> permafrost prospect<strong>in</strong>g 19<br />
Figure 14<br />
Amount <strong>of</strong> unfrozen water at different temperatures for various soils.<br />
(Williams & Smith 1989)<br />
A very high permittivity due to rotation <strong>of</strong> molecules <strong>and</strong> due to ionic charge carriers<br />
(Moore 1992) <strong>in</strong> this liquid water can be observed below freez<strong>in</strong>g. Mobile charge carriers<br />
also <strong>in</strong>crease the conductivity <strong>and</strong> therefore the signal attenuation <strong>in</strong> a material.<br />
To illustrate the result<strong>in</strong>g dielectric behaviour <strong>of</strong> ground materials we consider a dry, f<strong>in</strong>e<br />
gra<strong>in</strong>ed matrix with a permittivity lower than ice <strong>and</strong> a certa<strong>in</strong> porosity. Increas<strong>in</strong>g the<br />
water content <strong>of</strong> this material from 0 to 100 % will result <strong>in</strong> a non-l<strong>in</strong>ear response <strong>of</strong><br />
permittivity (Arcone & Delaney 1989) at natural temperatures below zero: Hav<strong>in</strong>g no water<br />
content the permittivity will be given by the value for the material itself <strong>and</strong> for the air<br />
conta<strong>in</strong>ed <strong>in</strong> the pores at any temperature. Increas<strong>in</strong>g the water content, a state will be<br />
reached where all water is adsorbed on soil particles at a given temperature below zero <strong>and</strong><br />
the rema<strong>in</strong><strong>in</strong>g pore volume is occupied by air. Until that po<strong>in</strong>t is reached a rapid <strong>in</strong>crease <strong>of</strong><br />
the permittivity can be observed as all water rema<strong>in</strong>s liquid <strong>in</strong> adsorption. After the po<strong>in</strong>t <strong>of</strong><br />
full adsorption, the rema<strong>in</strong><strong>in</strong>g air <strong>in</strong> the pores is gradually replaced by pore ice thus slowly<br />
<strong>in</strong>creas<strong>in</strong>g the permittivity until saturation is reached. Further <strong>in</strong>creas<strong>in</strong>g the water <strong>and</strong><br />
therefore ice content after saturation will subsequently lower the permittivity (Arcone &<br />
Delaney 1989) to that <strong>of</strong> ice at 100 % ice content, f<strong>in</strong>ally.
20 <strong>Application</strong> <strong>of</strong> GPR <strong>in</strong> glaciology <strong>and</strong> permafrost prospect<strong>in</strong>g<br />
Similarly for massive ground ice dielectric behaviour can change <strong>in</strong> dependence on the<br />
amount <strong>of</strong> air trapped <strong>in</strong> it <strong>and</strong> on the amount <strong>and</strong> type <strong>of</strong> impurities conta<strong>in</strong>ed <strong>in</strong> it.<br />
Furthermore temperature which affects the amount <strong>of</strong> liquid water <strong>in</strong> it determ<strong>in</strong>es its<br />
permittivity.<br />
For these reasons the use <strong>of</strong> radar alone to predict the ice content <strong>of</strong> soil (Annan & Davis<br />
1976) or the amount <strong>of</strong> air <strong>in</strong> massive ground ice is not feasible as too many variables are<br />
<strong>in</strong>volved <strong>in</strong> determ<strong>in</strong><strong>in</strong>g ground dielectric properties.<br />
<strong>Ground</strong> penetrat<strong>in</strong>g radar has been successfully used <strong>in</strong> detect<strong>in</strong>g ground ice bodies <strong>and</strong> <strong>in</strong><br />
mapp<strong>in</strong>g the seasonal depth <strong>of</strong> thaw <strong>in</strong> permafrost areas (e.g. Judge et al. 1991). Where<br />
with<strong>in</strong> its depth penetration range it may also be employed to detect the lower limit <strong>of</strong><br />
frozen material <strong>in</strong> the ground, preferably <strong>in</strong> spr<strong>in</strong>g when the active layer is completely<br />
frozen. In areas with discont<strong>in</strong>uous permafrost ground penetrat<strong>in</strong>g radar can be used to<br />
detect isolated bodies <strong>of</strong> frozen ground. GPR is able to fairly precisely def<strong>in</strong>e stratigraphic<br />
units two-dimensionally which could be extended towards three-dimensional pr<strong>of</strong>iles (e.g.<br />
Judge et al. 1991). For the detection <strong>of</strong> the mostly very dist<strong>in</strong>ct <strong>in</strong>terfaces between thawed<br />
<strong>and</strong> frozen ground GPR may be employed without the aid <strong>of</strong> other geophysical methods.<br />
Borehole <strong>in</strong>formation or other additional sources <strong>of</strong> <strong>in</strong>formation are needed however to<br />
refer the exact composition <strong>of</strong> the detected ground materials like air content <strong>in</strong> massive ice<br />
or ice content <strong>in</strong> soil.<br />
5. Conclusion<br />
<strong>Ground</strong> penetrat<strong>in</strong>g radar is a capable <strong>in</strong>strument for mapp<strong>in</strong>g various structures on glaciers<br />
as well as for <strong>in</strong>vestigat<strong>in</strong>g permafrost. However, <strong>in</strong> many cases further <strong>in</strong>formation from<br />
different sources is required to <strong>in</strong>terpret the radar data. Especially on permafrost GPR<br />
surveys strongly depend on additional data from e.g. bore holes or seismic measurements<br />
as ground dielectric properties have a very complex dependency on different material<br />
compositions <strong>and</strong> on temperature <strong>and</strong> are therefore hard to <strong>in</strong>terpret. On glaciers reflections<br />
are easier to <strong>in</strong>terpret as their causes are more limited. WARR or CMP surveys can provide<br />
quantitative <strong>in</strong>formation to make GPR sound<strong>in</strong>gs more <strong>in</strong>dependent from additional data<br />
collected by other techniques.<br />
6. Acknowledgements<br />
This study paper <strong>and</strong> our <strong>in</strong>terest <strong>in</strong> GPR has been supported by our supervisor Dr. John<br />
Moore with much commitment <strong>and</strong> patience. Neil Parry <strong>of</strong> EBA Eng<strong>in</strong>eer<strong>in</strong>g Consultants<br />
Ltd., Edmonton, Canada, Brian Mooreman from the University <strong>of</strong> Calgary, Canada <strong>and</strong><br />
Pekka Majala from the University <strong>of</strong> Oulu, F<strong>in</strong>l<strong>and</strong> po<strong>in</strong>ted out sources <strong>of</strong> <strong>in</strong>formation to<br />
us <strong>and</strong> answered some specific questions. Furthermore, ERA Technology, Surrey, Engl<strong>and</strong><br />
<strong>and</strong> Toikka Oy, Espoo, F<strong>in</strong>l<strong>and</strong>, k<strong>in</strong>dly supplied <strong>in</strong>formation on their commercial radar<br />
units. Pr<strong>of</strong>. Lorenz K<strong>in</strong>g from the University <strong>of</strong> Gießen made some <strong>of</strong> his work about<br />
geoelectrical <strong>and</strong> seismic permafrost detection available to us.<br />
We thank all these persons <strong>and</strong> <strong>in</strong>stitutions.<br />
Alison Tracey made the draw<strong>in</strong>g on the cover-page. Thanks a lot.
<strong>Application</strong> <strong>of</strong> GPR <strong>in</strong> glaciology <strong>and</strong> permafrost prospect<strong>in</strong>g 21<br />
7. Literature<br />
Acorne, S.A. <strong>and</strong> Delaney, A.J. 1984. Field dielectric measurements <strong>of</strong> frozen silt us<strong>in</strong>g<br />
VHF pulses. Cold Regions Science <strong>and</strong> Technology 9, 1984. pp. 29-37.<br />
Acorne, S.A. <strong>and</strong> Delaney, A.J. 1989. Investigations <strong>of</strong> dielectric properties <strong>of</strong> some<br />
frozen materials us<strong>in</strong>g cross-borehole radiowave pule transmissions. CRREL Report 89<br />
(4), 1989.<br />
Acorne, S.A., Lawson, D.E. <strong>and</strong> Delaney, A.J. 1995. Short-pulse radar wavelet recovery<br />
<strong>and</strong> resolution <strong>of</strong> dielectric contrasts with<strong>in</strong> englacial <strong>and</strong> basal ice <strong>of</strong> Matanuska Glacier,<br />
Alaska, U.S.A. Journal <strong>of</strong> <strong>Glaciology</strong> 41 (137), 1995. pp. 68-86.<br />
Annan, A.P. <strong>and</strong> Davis, J.L. 1976. Impulse radar sound<strong>in</strong>g <strong>in</strong> permafrost. Radio Science<br />
11, 1976. pp. 383-394.<br />
Bjoernson, H., Gjes<strong>in</strong>g, Y., Hansen, S., Hagen, J.O., Padsson, F., Erl<strong>in</strong>gsson, B. 1996<br />
The thermal regieme <strong>of</strong> sub polar glaciers mapped by multi frequency radio echo sound<strong>in</strong>g.<br />
Journal <strong>of</strong> <strong>Glaciology</strong> 42 (140), 1996.<br />
Davis, J.L. <strong>and</strong> Annan, A.P. 1989. <strong>Ground</strong>-penetrat<strong>in</strong>g radar for high resolution mapp<strong>in</strong>g<br />
<strong>of</strong> soil <strong>and</strong> rock stratigraphy. Geophysical Prospect<strong>in</strong>g 37, 1989. pp. 531-551.<br />
Drury, S.A. 1993. Image <strong>in</strong>terpretation <strong>in</strong> geology. pp. 1-4, 41-47, 175-203. Chapman &<br />
Hall, London, 1993.<br />
ERA Technology (1996), SPRscan - produc<strong>in</strong>g results. EBA Technology, Surrey KT22<br />
7SA, Engl<strong>and</strong>.<br />
Hall, D.K. 1985. Remote sens<strong>in</strong>g <strong>of</strong> ice <strong>and</strong> snow. pp. 1-22, 109-155. Chapman & Hall,<br />
London, 1985.<br />
Judge, A.S., Tucker, C.M., Pilon, J.A. <strong>and</strong> Moorman, B.J. 1991. Remote Sens<strong>in</strong>g <strong>of</strong><br />
Permafrost by <strong>Ground</strong>-<strong>Penetrat<strong>in</strong>g</strong> <strong>Radar</strong> at Two Airports <strong>in</strong> Arctic Canada. Arctic 44<br />
Supplement 1, pp. 40-48.<br />
K<strong>in</strong>g, L. 1984. Permafrost <strong>in</strong> Sk<strong>and</strong><strong>in</strong>avien. Untersuchungsergebnisse aus Lappl<strong>and</strong>,<br />
Jotunheimen und Dovre/Rondane. Dept. <strong>of</strong> Geography, University <strong>of</strong> Heidelberg,<br />
Heidelberger Geographische Arbeiten, 76.<br />
Kip, A.F., 1969. Fundamentals <strong>of</strong> Electricity <strong>and</strong> Magnetism. International student edition.<br />
McGraw-Hill Kogakusha Ltd, Tokyo.<br />
Kohler, J., Moore, J., Kennt, M., Engeset, R., Elvehoey, H. 1997, <strong>in</strong> press. Us<strong>in</strong>g<br />
ground penetrat<strong>in</strong>g radar to f<strong>in</strong>d last year’s summer surface <strong>in</strong> mass balance measurements:<br />
what are we really see<strong>in</strong>g ?<br />
Macharet, Y.Y., Moskalevsky, M.Y., Vasilenko, E.V. 1993. Velocity <strong>of</strong> radio waves <strong>in</strong><br />
glaciers as <strong>in</strong>dicator <strong>of</strong> their hydrothermal state, structure <strong>and</strong> regime. Journal <strong>of</strong><br />
<strong>Glaciology</strong> 39 (132), 1993.<br />
Maeno, N., Araki, T., Moore, J. <strong>and</strong> Fukuda, M. 1992. Dielectric Response <strong>of</strong> Water<br />
<strong>and</strong> Ice <strong>in</strong> Frozen Soils. In: Maeno, N. & Hondoh, T. (ed). Physics <strong>and</strong> Chemistry <strong>of</strong> Ice.<br />
Hokkaido University Press. 1992, Sapporo.<br />
Malå GeoScience 1995. RAMAC-GPR - Operat<strong>in</strong>g Manual. Malå GeoScience, Skolgatan<br />
11, 93070 Malå, Sweden.
22 <strong>Application</strong> <strong>of</strong> GPR <strong>in</strong> glaciology <strong>and</strong> permafrost prospect<strong>in</strong>g<br />
Moore, J.C.,1988a. Dielectric variability <strong>of</strong> a 130 m Antarctic ice core: Implications for<br />
radar sound<strong>in</strong>g. Annals <strong>of</strong> <strong>Glaciology</strong> 11. 1988.<br />
Moore, J.C., 1988b. Geophysical aspects <strong>of</strong> ice core drill<strong>in</strong>g <strong>in</strong> Antarctica., Ph. D. British<br />
Antarctic Survey. Cambridge, Engl<strong>and</strong>.<br />
Telford, W.M., Geldart, L.P. <strong>and</strong> Sheriff, R.E. 1990. Applied Geophysics - Second<br />
Edition. Cambridge University Press, Cambridge 1990.<br />
Williams, P.J. <strong>and</strong> Smith, M.W. 1989. The frozen earth. Cambridge University Press,<br />
Cambridge 1989.<br />
This document is available on the <strong>in</strong>ternet. It can be viewed <strong>in</strong> HTML or<br />
downloaded <strong>in</strong> pdf format, <strong>in</strong>clud<strong>in</strong>g all graphics.<br />
http://www.sgruber.de/pap-rad.htm<br />
Stephan Gruber / Florian Ludwig<br />
c/o Geographisches Institut/JLU Gießen<br />
Senckenbergstraße 1<br />
35390 Gießen, Germany<br />
email: mail@sgruber.de<br />
Dr. John Moore<br />
Arctic Centre<br />
Box 122<br />
96101 Rovaniemi, F<strong>in</strong>l<strong>and</strong><br />
email: jmoore@levi.urova.fi<br />
Ph. +358 16 324 757<br />
Fax: +358 16 324 777