discharge capacity of prefabricated vertical drains confined in clay
discharge capacity of prefabricated vertical drains confined in clay
discharge capacity of prefabricated vertical drains confined in clay

Create successful ePaper yourself
Turn your PDF publications into a flip-book with our unique Google optimized e-Paper software.
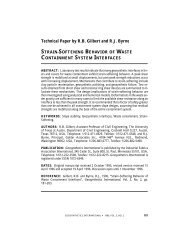
Technical Paper by N. Miura and J.C. Chai<br />
DISCHARGE CAPACITY OF PREFABRICATED<br />
VERTICAL DRAINS CONFINED IN CLAY<br />
ABSTRACT: This paper reports the long-term <strong>discharge</strong> capacities <strong>of</strong> four types <strong>of</strong><br />
<strong>prefabricated</strong> <strong>vertical</strong> <strong>dra<strong>in</strong>s</strong> (PVDs) <strong>conf<strong>in</strong>ed</strong> <strong>in</strong> <strong>clay</strong>. The results <strong>in</strong>dicate that under<br />
<strong>clay</strong> conf<strong>in</strong>ement, the PVD <strong>discharge</strong> capacities significantly reduced with time. The<br />
<strong>discharge</strong> <strong>capacity</strong> reduction may be caused by creep deformation <strong>of</strong> the PVD filter or<br />
clogg<strong>in</strong>g <strong>of</strong> the dra<strong>in</strong>age channels. PVD filter creep test results <strong>in</strong>dicated that, for the<br />
conditions considered, creep deformation was limited, which implies that clogg<strong>in</strong>g is<br />
the ma<strong>in</strong> cause <strong>of</strong> the <strong>discharge</strong> <strong>capacity</strong> reduction. Hydraulic shocks were applied,<br />
which partially unclogged the PVD, recover<strong>in</strong>g a significant amount <strong>of</strong> the <strong>discharge</strong><br />
<strong>capacity</strong>. The higher the PVD hydraulic gradient and the larger the shape factor <strong>of</strong> the<br />
dra<strong>in</strong>age channel (def<strong>in</strong>ed as the dra<strong>in</strong>age area per channel divided by its perimeter<br />
length), the less <strong>discharge</strong> <strong>capacity</strong> reduction with time. However, there was no clear<br />
trend regard<strong>in</strong>g the effect <strong>of</strong> the apparent open<strong>in</strong>g size, O 95 , <strong>of</strong> the filter on long-term<br />
<strong>discharge</strong> <strong>capacity</strong>. Based on the test results, an empirical equation was proposed for<br />
estimat<strong>in</strong>g the long-term <strong>clay</strong>-<strong>conf<strong>in</strong>ed</strong> <strong>discharge</strong> <strong>capacity</strong> by us<strong>in</strong>g short-term rubber<br />
membrane-<strong>conf<strong>in</strong>ed</strong> test results. Regard<strong>in</strong>g long-term <strong>discharge</strong> <strong>capacity</strong>, it is recommended<br />
that a PVD with a larger dra<strong>in</strong>age area per channel (approximately 3 mm 2 )and<br />
a larger dra<strong>in</strong>age channel shape factor (larger than 0.4 mm) should be selected.<br />
KEYWORDS: Prefabricated <strong>vertical</strong> dra<strong>in</strong>, Discharge <strong>capacity</strong>, Geotextile, Filter,<br />
Creep, Deformation.<br />
AUTHORS: N. Miura, Pr<strong>of</strong>essor and Director, Institute <strong>of</strong> Lowland Technology,<br />
Saga University, 1 Honjo, Saga, 840-8502, Japan, Telephone: 81/952-28-8576,<br />
Telefax: 81/952-28-8190, E-mail: miuran@cc.saga-u.ac.jp; and J.C. Chai, Associate<br />
Pr<strong>of</strong>essor, Department <strong>of</strong> Civil Eng<strong>in</strong>eer<strong>in</strong>g, Saga University, 1 Honjo, Saga,<br />
840-8502, Japan, Telephone: 81/952-28-8580, Telefax: 81/952-28-8190, E-mail:<br />
chai@cc.saga-u.ac.jp.<br />
PUBLICATION: Geosynthetics International is published by the Industrial Fabrics<br />
Association International, 1801 County Road B West, Roseville, M<strong>in</strong>nesota<br />
55113-4061, USA, Telephone: 1/651-222-2508, Telefax: 1/651-631-9334.<br />
Geosynthetics International is registered under ISSN 1072-6349.<br />
DATES: Orig<strong>in</strong>al manuscript received 17 January 2000, revised version received 25<br />
April 2000 and accepted 28 April 2000. Discussion open until 1 January 2001.<br />
REFERENCE: Miura, N. and Chai, J.C., 2000, “Discharge Capacity <strong>of</strong> Prefabricated<br />
Vertical Dra<strong>in</strong>s Conf<strong>in</strong>ed <strong>in</strong> Clay”, Geosynthetics International, Vol. 7, No. 2, pp.<br />
119-135.<br />
GEOSYNTHETICS INTERNATIONAL S 2000, VOL. 7, NO. 2<br />
119
MIURA AND CHAI D Discharge Capacity <strong>of</strong> Prefabricated Vertical Dra<strong>in</strong>s Conf<strong>in</strong>ed <strong>in</strong> Clay<br />
1 INTRODUCTION<br />
Prefabricated <strong>vertical</strong> <strong>dra<strong>in</strong>s</strong> (PVDs) are widely used to accelerate the consolidation<br />
<strong>of</strong> s<strong>of</strong>t <strong>clay</strong> deposits under preload<strong>in</strong>g. Discharge <strong>capacity</strong> is one <strong>of</strong> the factors affect<strong>in</strong>g<br />
the behavior <strong>of</strong> PVDs (Hansbo 1981). Most PVD <strong>discharge</strong> <strong>capacity</strong> tests were conducted<br />
by conf<strong>in</strong><strong>in</strong>g a PVD specimen <strong>in</strong> a rubber membrane; however, <strong>discharge</strong> <strong>capacity</strong><br />
tests with rubber membrane conf<strong>in</strong>ement do not represent field conditions. In the<br />
field, a PVD is <strong>conf<strong>in</strong>ed</strong> by <strong>clay</strong>, which is normally remolded dur<strong>in</strong>g PVD <strong>in</strong>stallation.<br />
Under field conditions, <strong>clay</strong> particles may enter the PVD dra<strong>in</strong>age channels, and the<br />
consolidation settlement <strong>of</strong> the improved subsoil may cause fold<strong>in</strong>g <strong>of</strong> the PVD. These<br />
factors will affect the <strong>discharge</strong> <strong>capacity</strong> <strong>of</strong> PVDs. Miura et al. (1998) conducted a series<br />
<strong>of</strong> laboratory tests <strong>in</strong>vestigat<strong>in</strong>g the <strong>discharge</strong> <strong>capacity</strong> <strong>of</strong> PVDs. The follow<strong>in</strong>g factors<br />
were studied: (i) conf<strong>in</strong>ement condition (<strong>conf<strong>in</strong>ed</strong> by a rubber membrane or <strong>clay</strong>); (ii)<br />
fold<strong>in</strong>g <strong>of</strong> the PVD; (iii) air bubbles trapped <strong>in</strong> the dra<strong>in</strong>age channels; and (iv) variation<br />
<strong>of</strong> the <strong>discharge</strong> <strong>capacity</strong> with time under <strong>clay</strong> conf<strong>in</strong>ement. For the conditions <strong>in</strong>vestigated,<br />
it was found that the <strong>discharge</strong> <strong>capacity</strong> <strong>of</strong> the <strong>clay</strong>-<strong>conf<strong>in</strong>ed</strong> PVD was much lower<br />
than that <strong>of</strong> the rubber membrane-<strong>conf<strong>in</strong>ed</strong> PVD, and, <strong>in</strong> the case <strong>of</strong> <strong>clay</strong><br />
conf<strong>in</strong>ement, the <strong>discharge</strong> <strong>capacity</strong> cont<strong>in</strong>uously decreased with time. Chai and Miura<br />
(1999) reported test results on the <strong>discharge</strong> <strong>capacity</strong> <strong>of</strong> PVDs, as well as creep deformation<br />
<strong>of</strong> PVD filters. The mechanism <strong>of</strong> PVD <strong>discharge</strong> <strong>capacity</strong> reduction with time under<br />
<strong>clay</strong> conf<strong>in</strong>ement was also <strong>in</strong>vestigated. For the two types <strong>of</strong> PVDs tested, it was<br />
concluded that the deformation (<strong>in</strong>clud<strong>in</strong>g creep) <strong>of</strong> the PVD filter contributed less than<br />
20% <strong>of</strong> the <strong>discharge</strong> <strong>capacity</strong> reduction for the conditions <strong>in</strong>vestigated. More than 80%<br />
<strong>of</strong> the reduction was attributed to clogg<strong>in</strong>g, which was caused by soil particles enter<strong>in</strong>g<br />
the PVD core dra<strong>in</strong>age channels and bio-films form<strong>in</strong>g <strong>in</strong>side the dra<strong>in</strong>age channels.<br />
The <strong>clay</strong>-<strong>conf<strong>in</strong>ed</strong> PVD test data reported by Miura et al. (1998) and Chai and Miura<br />
(1999) were for two types <strong>of</strong> PVDs tested under a low hydraulic gradient (approximately<br />
0.08). The follow<strong>in</strong>g po<strong>in</strong>ts were not clarified: (i) is the conclusion drawn applicable<br />
to other PVDs? and (ii) what are the important factors affect<strong>in</strong>g the long-term <strong>clay</strong>-<strong>conf<strong>in</strong>ed</strong><br />
<strong>discharge</strong> <strong>capacity</strong>? Also, <strong>in</strong> practice, the follow<strong>in</strong>g questions need to be answered.<br />
Is it possible to estimate the long-term <strong>clay</strong>-<strong>conf<strong>in</strong>ed</strong> <strong>discharge</strong> <strong>capacity</strong> us<strong>in</strong>g<br />
short-term rubber membrane-<strong>conf<strong>in</strong>ed</strong> test results (e.g. those tests conducted by<br />
manufacturers)? And, what type <strong>of</strong> PVD will have a higher long-term <strong>clay</strong>-<strong>conf<strong>in</strong>ed</strong><br />
<strong>discharge</strong> <strong>capacity</strong>? The objective <strong>of</strong> the present study is to attempt to answer these<br />
questions.<br />
In the present paper, the laboratory <strong>discharge</strong> <strong>capacity</strong> test results <strong>of</strong> four types <strong>of</strong><br />
commonly used PVDs <strong>in</strong> Japan are reported. The creep deformation and apparent open<strong>in</strong>g<br />
size <strong>of</strong> the filter, as well as the effect <strong>of</strong> hydraulic gradient on the long-term <strong>clay</strong><strong>conf<strong>in</strong>ed</strong><br />
<strong>discharge</strong> <strong>capacity</strong>, are <strong>in</strong>vestigated. An empirical method for estimat<strong>in</strong>g the<br />
long-term <strong>clay</strong>-<strong>conf<strong>in</strong>ed</strong> <strong>discharge</strong> <strong>capacity</strong> <strong>of</strong> PVDs is presented. Suggestions are provided<br />
for the selection <strong>of</strong> PVDs <strong>in</strong> eng<strong>in</strong>eer<strong>in</strong>g practice based on the test results <strong>of</strong> the<br />
present study.<br />
120 GEOSYNTHETICS INTERNATIONAL S 2000, VOL. 7, NO. 2
MIURA AND CHAI D Discharge Capacity <strong>of</strong> Prefabricated Vertical Dra<strong>in</strong>s Conf<strong>in</strong>ed <strong>in</strong> Clay<br />
2 DISCHARGE CAPACITY OF CLAY-CONFINED PVD SPECIMENS<br />
2.1 Test Method and Materials Used<br />
The device used for <strong>clay</strong>-<strong>conf<strong>in</strong>ed</strong> PVD <strong>discharge</strong> <strong>capacity</strong> tests is illustrated <strong>in</strong> Figure<br />
1. The apparatus <strong>in</strong>cludes a cyl<strong>in</strong>drical cell with a diameter <strong>of</strong> 200 mm and height<br />
<strong>of</strong> 600 mm. The maximum PVD specimen length that can be tested with this device is<br />
approximately 400 mm. The PVD is <strong>conf<strong>in</strong>ed</strong> by a 100 mm-diameter remolded soil column<br />
conta<strong>in</strong>ed <strong>in</strong> a rubber membrane. The soil column simulates remolded soil around<br />
the PVD, i.e. the smear zone. A detailed description <strong>of</strong> the test procedure can be found<br />
<strong>in</strong> the paper by Chai and Miura (1999). The primary test setup procedures are summarized<br />
as follows:<br />
1. Install the PVD specimen <strong>in</strong> the bottom pedestal, which is connected to the <strong>in</strong>let water<br />
flow system.<br />
2. Fix the rubber membrane <strong>in</strong> the bottom pedestal and place the cyl<strong>in</strong>drical mold (<strong>in</strong>ner<br />
diameter <strong>of</strong> 100 mm) <strong>in</strong>to position.<br />
Head difference, ∆H<br />
Conf<strong>in</strong><strong>in</strong>g pressure<br />
100 mm<br />
Clay<br />
PVD<br />
Rubber membrane<br />
Cross section <strong>of</strong> PVD specimen<br />
Specimen<br />
200 to 400 mm<br />
Figure 1.<br />
Apparatus used to measure the <strong>discharge</strong> <strong>capacity</strong> <strong>of</strong> PVD specimens.<br />
GEOSYNTHETICS INTERNATIONAL S 2000, VOL. 7, NO. 2<br />
121
MIURA AND CHAI D Discharge Capacity <strong>of</strong> Prefabricated Vertical Dra<strong>in</strong>s Conf<strong>in</strong>ed <strong>in</strong> Clay<br />
3. Place the remolded <strong>clay</strong> (at a water content approximately equal to the liquid limit)<br />
<strong>in</strong>to the mold layer-by-layer until the desired height is atta<strong>in</strong>ed.<br />
4. Install the top pedestal and connect the PVD specimen to the outlet water flow system.<br />
Fix the rubber membrane to the top pedestal.<br />
5. Apply a suction <strong>of</strong> approximately 10 kPa to the specimen and remove the mold.<br />
6. Apply the conf<strong>in</strong><strong>in</strong>g pressure and gradually release the suction.<br />
7. Set the desired hydraulic gradient.<br />
8. Allow the <strong>clay</strong> to consolidate under a given conf<strong>in</strong><strong>in</strong>g pressure. After the <strong>clay</strong> consolidates,<br />
measure the <strong>discharge</strong> <strong>capacity</strong>.<br />
Four types <strong>of</strong> PVDs commonly used <strong>in</strong> Japan were tested. The four PVDs have different<br />
core structures (Figure 2) and filters (Table 1). Both rubber membrane-<strong>conf<strong>in</strong>ed</strong><br />
(approximately 0.9 mm thick) and <strong>clay</strong>-<strong>conf<strong>in</strong>ed</strong> tests were conducted. To simulate<br />
long-term field behavior, the <strong>clay</strong>-<strong>conf<strong>in</strong>ed</strong> tests were approximately three months long<br />
(except for one test). A micro pump was used to recirculate the water (tap water, not<br />
de-aired) dur<strong>in</strong>g the tests. The tests were conducted <strong>in</strong> an air-conditioned room with the<br />
temperature typically with<strong>in</strong> the range <strong>of</strong> 18 to 26_C. The pump motor was not placed<br />
<strong>in</strong> the water to ensure that it would have no effect on the water temperature. Most tests<br />
were conducted at a conf<strong>in</strong><strong>in</strong>g pressure, σ, <strong>of</strong> 49 kPa. Assum<strong>in</strong>g an earth pressure coefficient<br />
<strong>of</strong> 0.5, 49 kPa represents the horizontal earth pressure under an embankment<br />
approximately 5 m high, or the <strong>in</strong>itial horizontal earth pressure at a depth <strong>of</strong> approximately<br />
10 m <strong>in</strong> the ground. Remolded Ariake <strong>clay</strong>, which consisted <strong>of</strong> 57.0% <strong>clay</strong>,<br />
41.7% silt, and 1.3% sand particles, was used (liquid limit <strong>of</strong> 105.0% and a plastic limit<br />
<strong>of</strong> 42.8%).<br />
For the test apparatus used (Figure 1), an amount <strong>of</strong> head loss is associated with the<br />
hose connect<strong>in</strong>g the <strong>in</strong>let and outlet water tanks, which should be considered when <strong>in</strong>terpret<strong>in</strong>g<br />
the test results. To calibrate the head loss, a test without a PVD specimen and<br />
soil column was conducted. In this case, the water flowed from the <strong>in</strong>let water tank to<br />
the outlet water tank through the hoses and cyl<strong>in</strong>drical chamber only. The head difference,<br />
∆H, between the <strong>in</strong>let and outlet water tanks was varied, and the correspond<strong>in</strong>g<br />
amount <strong>of</strong> water flow, Q, was measured. The Q versus ∆h relationship for this test device<br />
is plotted <strong>in</strong> Figure 3. This curve was used to correct the test results accord<strong>in</strong>g to<br />
the follow<strong>in</strong>g procedure:<br />
Table 1.<br />
Physical properties <strong>of</strong> the <strong>prefabricated</strong> <strong>vertical</strong> dra<strong>in</strong> (PVD) filters.<br />
Property<br />
PVD filter<br />
PVD A PVD B PVD C PVD D<br />
Mass/unit area (g/m 2 ) 50 37 50 154<br />
Thickness (mm) 0.21 0.12 0.21 0.44<br />
Polymer Polyester Polyolef<strong>in</strong> Polyester Polypropylene<br />
Manufactur<strong>in</strong>g<br />
process<br />
Cont<strong>in</strong>uous filament<br />
(heat-bonded)<br />
Short fibre<br />
(heat-bonded)<br />
Cont<strong>in</strong>uous filament<br />
(heat-bonded)<br />
Short fibre<br />
(heat-bonded)<br />
122 GEOSYNTHETICS INTERNATIONAL S 2000, VOL. 7, NO. 2
MIURA AND CHAI D Discharge Capacity <strong>of</strong> Prefabricated Vertical Dra<strong>in</strong>s Conf<strong>in</strong>ed <strong>in</strong> Clay<br />
PVD A<br />
Unit dra<strong>in</strong>age<br />
channel<br />
PVD B<br />
Unit dra<strong>in</strong>age<br />
channel<br />
1.8<br />
2.0<br />
2.4<br />
Filter<br />
Core<br />
94<br />
2.4<br />
40 dra<strong>in</strong>age channels<br />
1.5<br />
Initial dra<strong>in</strong>age area = 108 mm 2<br />
97<br />
3.6<br />
70 dra<strong>in</strong>age channels<br />
1.3 Initial dra<strong>in</strong>age area = 200 mm 2<br />
PVD C<br />
Unit dra<strong>in</strong>age<br />
channel 1.7<br />
2.7<br />
1.0<br />
94<br />
3.6<br />
39 dra<strong>in</strong>age channels<br />
Initial dra<strong>in</strong>age area = 199 mm 2<br />
1.0<br />
99<br />
PVD D<br />
3.1<br />
Unit dra<strong>in</strong>age 3.3<br />
56 dra<strong>in</strong>age channels<br />
channel<br />
1.4 0.8 Initial dra<strong>in</strong>age area = 224 mm 2<br />
0.8<br />
Dimensions <strong>in</strong> mm<br />
Figure 2.<br />
Core structures <strong>of</strong> the tested PVD specimens.<br />
1. From a measured amount <strong>of</strong> water flow, the correspond<strong>in</strong>g head loss <strong>in</strong> the hoses,<br />
∆h, was obta<strong>in</strong>ed from Figure 3.<br />
2. To calculate the head loss, ∆H - ∆h, with<strong>in</strong> a PVD specimen, ∆h was subtracted from<br />
the total head difference, ∆H, used dur<strong>in</strong>g the test.<br />
3. The corrected hydraulic gradient, i, with<strong>in</strong> the PVD specimen was calculated as<br />
(where L is the length <strong>of</strong> the PVD specimen):<br />
i =<br />
∆H − ∆h<br />
L<br />
(1)<br />
GEOSYNTHETICS INTERNATIONAL S 2000, VOL. 7, NO. 2<br />
123
MIURA AND CHAI D Discharge Capacity <strong>of</strong> Prefabricated Vertical Dra<strong>in</strong>s Conf<strong>in</strong>ed <strong>in</strong> Clay<br />
Head loss with<strong>in</strong> test apparatus, ∆h (mm)<br />
30<br />
20<br />
10<br />
∆h = 0.000526Q 1.588<br />
0<br />
0 200 400 600 800 1000<br />
Rate <strong>of</strong> water flow, Q (m 3 /year)<br />
Figure 3.<br />
Correction curve for the head loss <strong>of</strong> the test apparatus.<br />
4. For ease <strong>of</strong> comparison, the results were further l<strong>in</strong>early converted to a fixed hydraulic<br />
gradient, which was approximately the average value <strong>of</strong> the corrected hydraulic<br />
gradients.<br />
2.2 Test Results for Low Hydraulic Gradient<br />
The hydraulic gradient, i, with<strong>in</strong> a PVD may also have an <strong>in</strong>fluence on <strong>discharge</strong><br />
<strong>capacity</strong>. Conceptually, the higher the i value, the less the clogg<strong>in</strong>g effect. Laboratory<br />
tests should be conducted with an i value close to field conditions; however, to measure<br />
the field hydraulic gradient with<strong>in</strong> a PVD is not practical. Also, s<strong>in</strong>ce the hydraulic gradient<br />
varies with time, as well as with soil conditions, embankment load<strong>in</strong>g, and<br />
construction scheme, it is difficult to def<strong>in</strong>e a s<strong>in</strong>gle hydraulic gradient value. Chai and<br />
Miura (1999) conducted f<strong>in</strong>ite element analyses for three embankments on PVD-improved<br />
subsoil. In the analyses, the effect <strong>of</strong> the PVD was simulated us<strong>in</strong>g one-dimensional<br />
dra<strong>in</strong>age elements (Chai et al. 1995). The numerical results <strong>in</strong>dicated that, at the<br />
end <strong>of</strong> construction, the maximum hydraulic gradient with<strong>in</strong> the PVDs was <strong>in</strong> the range<br />
<strong>of</strong> 0.1 to 0.3. Consider<strong>in</strong>g that the value <strong>of</strong> i will decrease dur<strong>in</strong>g the consolidation process,<br />
most <strong>clay</strong>-<strong>conf<strong>in</strong>ed</strong> tests were set with a hydraulic gradient <strong>of</strong> approximately 0.08<br />
<strong>in</strong> the present study.<br />
Figures 4a to 4d present the <strong>clay</strong>-<strong>conf<strong>in</strong>ed</strong> test results for PVDs A, B, C, and D, respectively.<br />
In Figures 4a to 4d, the left ord<strong>in</strong>ate is the ratio <strong>of</strong> the <strong>clay</strong>-<strong>conf<strong>in</strong>ed</strong> <strong>discharge</strong><br />
<strong>capacity</strong>, Q C , divided by the short-term (approximately two days) rubber<br />
membrane-<strong>conf<strong>in</strong>ed</strong> <strong>discharge</strong> <strong>capacity</strong>, Q R . The pattern <strong>of</strong> the variation <strong>of</strong> Q C /Q R with<br />
124 GEOSYNTHETICS INTERNATIONAL S 2000, VOL. 7, NO. 2
MIURA AND CHAI D Discharge Capacity <strong>of</strong> Prefabricated Vertical Dra<strong>in</strong>s Conf<strong>in</strong>ed <strong>in</strong> Clay<br />
(a)<br />
(b)<br />
Discharge <strong>capacity</strong> ratio, Q C / Q R<br />
(c)<br />
Discharge <strong>capacity</strong> ratio, Q C / Q R<br />
1<br />
0.8<br />
0.6<br />
0.4<br />
0.2<br />
Elapsed time, t (days)<br />
1<br />
0.8<br />
100<br />
0.6<br />
0.4<br />
0.2<br />
0 0 0<br />
0 100 200 300 0<br />
1<br />
0.8<br />
0.6<br />
0.4<br />
0.2<br />
PVD A<br />
σ =49kPa<br />
i =0.08<br />
Predicted<br />
Discharge <strong>capacity</strong> recovery<br />
due to partial unclogg<strong>in</strong>g<br />
PVD C<br />
σ =49kPa<br />
i =0.08<br />
Predicted<br />
Discharge <strong>capacity</strong> recovery<br />
due to partial unclogg<strong>in</strong>g<br />
0<br />
0<br />
0 100 200 300<br />
Elapsed time, t (days)<br />
150<br />
50<br />
400<br />
(d)<br />
1<br />
0.8<br />
300<br />
200<br />
0.6<br />
0.4<br />
100<br />
0.2<br />
0<br />
PVD B<br />
σ =49kPa<br />
i =0.08<br />
PVD D<br />
0<br />
100 200 300<br />
Elapsed time, t (days)<br />
σ =49kPa<br />
i =0.08<br />
Predicted<br />
Predicted<br />
300<br />
200<br />
100<br />
0<br />
100 200 300<br />
Elapsed time, t (days)<br />
600<br />
400<br />
200<br />
Rate <strong>of</strong> water flow, Q C (m 3 /year)<br />
Rate <strong>of</strong> water flow, Q C (m 3 /year)<br />
Figure 4. Discharge <strong>capacity</strong>-elapsed time curves for a low hydraulic gradient, i = 0.08,<br />
and a conf<strong>in</strong><strong>in</strong>g pressure, σ = 49 kPa: (a) PVD A; (b) PVD B; (c) PVD C; (d) PVD D.<br />
elapsed time will be used to develop an empirical equation for predict<strong>in</strong>g the long-term<br />
<strong>clay</strong>-<strong>conf<strong>in</strong>ed</strong> <strong>discharge</strong> <strong>capacity</strong> us<strong>in</strong>g the short-term rubber membrane-<strong>conf<strong>in</strong>ed</strong> test<br />
results <strong>in</strong> Section 2.3. The right ord<strong>in</strong>ate is the rate <strong>of</strong> water flow. Test results, for PVDs<br />
A and B, that were reported by Chai and Miura (1999) are <strong>in</strong>cluded here for comparison.<br />
It can be seen that, for the four PVDs tested, the <strong>discharge</strong> capacities all decreased significantly<br />
with time. The recovery <strong>of</strong> <strong>discharge</strong> capacities <strong>in</strong> Figures 4a and 4c was due<br />
to the application <strong>of</strong> hydraulic shocks, which is discussed later <strong>in</strong> this section. S<strong>in</strong>ce the<br />
four types <strong>of</strong> PVDs tested have different core structures and filters, it can be stated that,<br />
under the adopted conditions, the reduction <strong>of</strong> <strong>discharge</strong> <strong>capacity</strong> with time is a com-<br />
GEOSYNTHETICS INTERNATIONAL S 2000, VOL. 7, NO. 2<br />
125
MIURA AND CHAI D Discharge Capacity <strong>of</strong> Prefabricated Vertical Dra<strong>in</strong>s Conf<strong>in</strong>ed <strong>in</strong> Clay<br />
mon phenomenon and should be considered when design<strong>in</strong>g s<strong>of</strong>t subsoil improvements<br />
us<strong>in</strong>g PVDs.<br />
The follow<strong>in</strong>g phenomena have been considered for the reduction <strong>of</strong> PVD <strong>discharge</strong><br />
<strong>capacity</strong> with time: (i) creep deformation <strong>of</strong> the filters; and (ii) clogg<strong>in</strong>g due to <strong>clay</strong> particles<br />
enter<strong>in</strong>g the dra<strong>in</strong>age channels <strong>of</strong> the PVD core and possible formation <strong>of</strong> bi<strong>of</strong>ilms<br />
(Chai and Miura 1999). Creep tests for the PVD filters were conducted. The creep<br />
test device is illustrated <strong>in</strong> Figure 5. The filter was tested <strong>in</strong> the direction correspond<strong>in</strong>g<br />
to the transverse direction <strong>of</strong> the PVDs. The tested specimens were 200 mm wide and<br />
400 mm long. To avoid neck<strong>in</strong>g <strong>of</strong> the specimen, a clamp was fixed <strong>in</strong> the middle <strong>of</strong><br />
the specimen. The creep test results are summarized <strong>in</strong> Figure 6. It can be seen that the<br />
PVD B filter is weaker than PVD A and C filters. To relate the deformation (<strong>in</strong>clud<strong>in</strong>g<br />
creep) <strong>of</strong> a filter with the reduction <strong>of</strong> the cross-sectional area <strong>of</strong> the dra<strong>in</strong>age channel,<br />
the follow<strong>in</strong>g assumptions were made:<br />
1. As illustrated <strong>in</strong> Figure 7, the deformed shape <strong>of</strong> the filter is a circular arc.<br />
2. The conf<strong>in</strong><strong>in</strong>g pressure is balanced by the tensile force, T, <strong>in</strong> the filter <strong>in</strong> the y direction<br />
(Figure 7).<br />
400 mm<br />
Filter specimen<br />
Weight<br />
200 mm<br />
Middle clamp to<br />
restrict neck<strong>in</strong>g<br />
<strong>of</strong> the specimen<br />
Bar to prevent<br />
sw<strong>in</strong>g<strong>in</strong>g <strong>of</strong> the<br />
specimen<br />
Ruler<br />
Side view<br />
Front view<br />
Figure 5.<br />
Illustration <strong>of</strong> the PVD filter creep test apparatus.<br />
126 GEOSYNTHETICS INTERNATIONAL S 2000, VOL. 7, NO. 2
MIURA AND CHAI D Discharge Capacity <strong>of</strong> Prefabricated Vertical Dra<strong>in</strong>s Conf<strong>in</strong>ed <strong>in</strong> Clay<br />
Elapsed time, t (logarithmic scale)<br />
(a)<br />
Tensile stra<strong>in</strong>, ε (%)<br />
0<br />
10<br />
20<br />
30<br />
40<br />
1hour<br />
PVDs A and C<br />
1 week<br />
1day<br />
1month<br />
1year<br />
191 N<br />
241 N<br />
341 N<br />
391 N<br />
(b)<br />
0<br />
Tensile stra<strong>in</strong>, ε (%)<br />
10<br />
20<br />
30<br />
40<br />
PVD B<br />
141 N<br />
Failure<br />
91 N<br />
41 N<br />
64 N<br />
(c)<br />
Tensile stra<strong>in</strong>, ε (%)<br />
0<br />
10<br />
20<br />
30<br />
40<br />
PVD C<br />
241 N<br />
341 N<br />
441 N<br />
641 N<br />
Figure 6. Creep test results for the PVD filters (specimen width = 200 mm): (a) PVDs A<br />
andC;(b)PVDB;(c)PVDD.<br />
GEOSYNTHETICS INTERNATIONAL S 2000, VOL. 7, NO. 2<br />
127
MIURA AND CHAI D Discharge Capacity <strong>of</strong> Prefabricated Vertical Dra<strong>in</strong>s Conf<strong>in</strong>ed <strong>in</strong> Clay<br />
y<br />
x<br />
Conf<strong>in</strong><strong>in</strong>g<br />
pressure,<br />
F=Bσ<br />
Ts<strong>in</strong>α<br />
Tensile force, T<br />
α<br />
Core<br />
B<br />
Deformed filter<br />
(circular arc)<br />
Figure 7.<br />
Calculation <strong>of</strong> the reduction <strong>of</strong> the dra<strong>in</strong>age area.<br />
By vary<strong>in</strong>g the value <strong>of</strong> α (Figure 7) (and therefore, the radius <strong>of</strong> the arc), balance<br />
between the conf<strong>in</strong><strong>in</strong>g pressure and the mobilized tensile force <strong>in</strong> the filter can be obta<strong>in</strong>ed<br />
(trial and error). The reduction <strong>of</strong> the cross-sectional area <strong>of</strong> the dra<strong>in</strong>age channel<br />
is a function <strong>of</strong> the filter deformation behavior and the geometry <strong>of</strong> the dra<strong>in</strong>age channel.<br />
Based on the test results, the relationships between conf<strong>in</strong><strong>in</strong>g pressure and the reduction<br />
<strong>of</strong> the cross-sectional area <strong>of</strong> the dra<strong>in</strong>age channels were calculated and are<br />
shown <strong>in</strong> Figures 8a to 8d for PVDs A to D, respectively. Figure 8 <strong>in</strong>dicates that under<br />
a conf<strong>in</strong><strong>in</strong>g pressure <strong>of</strong> 49 kPa, deformation (<strong>in</strong>clud<strong>in</strong>g creep) <strong>of</strong> the filter reduces the<br />
cross-sectional area <strong>of</strong> the dra<strong>in</strong>age channel by approximately 5% for PVDs A and C,<br />
and approximately 20% for PVDs B and D. Compar<strong>in</strong>g the amount <strong>of</strong> reduction after<br />
one day, one month, and one year (extrapolated), it can be seen that under a conf<strong>in</strong><strong>in</strong>g<br />
pressure <strong>of</strong> 49 kPa, most <strong>of</strong> the cross-sectional area reduction is due to short-term deformation<br />
and the creep deformation is small. The PVD D filter is strong, but the perimeter<br />
length <strong>of</strong> the filter sleeve is longer than the perimeter length <strong>of</strong> the core, and the<br />
core is weaker. In particular, the extra length <strong>of</strong> the filter sleeve contributed approximately<br />
15% to the reduction <strong>of</strong> the cross-sectional area <strong>of</strong> the dra<strong>in</strong>age channel. The<br />
test results <strong>in</strong>dicate that PVD filter deformation is not a dom<strong>in</strong>at<strong>in</strong>g factor for <strong>discharge</strong><br />
<strong>capacity</strong> reduction.<br />
For PVDs A and C, before term<strong>in</strong>at<strong>in</strong>g the <strong>clay</strong>-<strong>conf<strong>in</strong>ed</strong> tests, hydraulic shockswere<br />
applied by firmly stepp<strong>in</strong>g on the <strong>in</strong>let hose or rapidly vary<strong>in</strong>g the head difference. By<br />
do<strong>in</strong>g so, the f<strong>in</strong>e particles (or bio-films) were partially pumped out <strong>of</strong> the dra<strong>in</strong>age<br />
channels <strong>of</strong> the PVD core. Then, the <strong>discharge</strong> capacities were recovered to a value correspond<strong>in</strong>g<br />
to that <strong>of</strong> approximately one week <strong>of</strong> elapsed time (Figures 4a and 4c). This<br />
<strong>in</strong>directly <strong>in</strong>dicates that clogg<strong>in</strong>g <strong>of</strong> the PVD core is the ma<strong>in</strong> mechanism reduc<strong>in</strong>g the<br />
<strong>discharge</strong> <strong>capacity</strong> with time. It was observed that, dur<strong>in</strong>g application <strong>of</strong> the hydraulic<br />
shocks, flocculated f<strong>in</strong>e particles were forced out <strong>of</strong> the PVD dra<strong>in</strong>age channels and deposited<br />
on the wall <strong>of</strong> the outlet hose. Also, after the <strong>discharge</strong> <strong>capacity</strong> test, the filter<br />
was analyzed us<strong>in</strong>g electron-microscope photographs. There were bio-films on the<br />
dra<strong>in</strong>age-channel side <strong>of</strong> the filter (Chai and Miura 1999). Air bubbles trapped <strong>in</strong> the<br />
dra<strong>in</strong>age channels were also considered a possible cause <strong>of</strong> the <strong>discharge</strong> <strong>capacity</strong> re-<br />
128 GEOSYNTHETICS INTERNATIONAL S 2000, VOL. 7, NO. 2
MIURA AND CHAI D Discharge Capacity <strong>of</strong> Prefabricated Vertical Dra<strong>in</strong>s Conf<strong>in</strong>ed <strong>in</strong> Clay<br />
(a)<br />
Reduction <strong>of</strong> cross-sectional area, R A (%)<br />
0<br />
20<br />
40<br />
60<br />
(b)<br />
Conf<strong>in</strong><strong>in</strong>g pressure, σ (kPa)<br />
100 200 300 400<br />
0<br />
PVD A<br />
20<br />
40<br />
After 1 day<br />
After 1 month<br />
After 1 year (extrapolated)<br />
60<br />
Conf<strong>in</strong><strong>in</strong>g pressure, σ (kPa)<br />
100 200 300 400<br />
PVD B<br />
(c)<br />
(d)<br />
Reduction <strong>of</strong> cross-sectional area, R A (%)<br />
0<br />
20<br />
40<br />
60<br />
Conf<strong>in</strong><strong>in</strong>g pressure, σ (kPa)<br />
100 200 300 400<br />
PVD C<br />
0<br />
20<br />
40<br />
60<br />
Conf<strong>in</strong><strong>in</strong>g pressure, σ (kPa)<br />
100 200 300 400<br />
PVD D<br />
Figure 8. Relationship between conf<strong>in</strong><strong>in</strong>g pressure and the reduction <strong>of</strong> the dra<strong>in</strong>age<br />
area:(a)PVDA;(b)PVDB;(c)PVDC;(d)PVDD.<br />
duction with time. Miura et al. (1993) reported that trapped air bubbles caused a reduction<br />
<strong>of</strong> the PVD <strong>discharge</strong> <strong>capacity</strong> under rubber membrane conf<strong>in</strong>ement. With further<br />
<strong>in</strong>vestigation, it was found that when ma<strong>in</strong>ta<strong>in</strong><strong>in</strong>g unfolded <strong>in</strong>let and outlet hoses, the<br />
effect <strong>of</strong> trapped air bubbles was a m<strong>in</strong>or factor <strong>in</strong>fluenc<strong>in</strong>g PVD <strong>discharge</strong> <strong>capacity</strong><br />
GEOSYNTHETICS INTERNATIONAL S 2000, VOL. 7, NO. 2<br />
129
MIURA AND CHAI D Discharge Capacity <strong>of</strong> Prefabricated Vertical Dra<strong>in</strong>s Conf<strong>in</strong>ed <strong>in</strong> Clay<br />
(Miura et al. 1998). Furthermore, no air bubbles were forced out when the hydraulic<br />
shocks were applied for the tests on PVDs A and C.<br />
The filter open<strong>in</strong>g size and geometry <strong>of</strong> the dra<strong>in</strong>age channels may have an effect<br />
on the clogg<strong>in</strong>g phenomenon. The apparent open<strong>in</strong>g size (O 95 , the filter open<strong>in</strong>g diameter<br />
such that 95% <strong>of</strong> the open<strong>in</strong>gs are smaller that that size) <strong>of</strong> the four filter types was<br />
measured us<strong>in</strong>g glass beads accord<strong>in</strong>g to ASTM D 4751. The apparent open<strong>in</strong>g size distributions<br />
<strong>of</strong> the four filters are given <strong>in</strong> Figure 9, and the O 95 values are listed <strong>in</strong> Table<br />
2. Even though it is not generally agreed upon to use O 95 values to represent the open<strong>in</strong>g<br />
size <strong>of</strong> nonwoven geotextiles, i.e. filters (Giroud 1996), it is believed that O 95 values<br />
are a useful <strong>in</strong>dex for compar<strong>in</strong>g the relative size <strong>of</strong> the 5%-larger geotextile open<strong>in</strong>gs.<br />
Table 2.<br />
The O 95 values <strong>of</strong> the PVD filters and the geometry <strong>of</strong> a unit dra<strong>in</strong>age channel.<br />
Test<br />
no.<br />
PVD<br />
O 95 <strong>of</strong><br />
filter (µm)<br />
Geometry <strong>of</strong> unit<br />
dra<strong>in</strong>age channel<br />
Cross-sectional<br />
area (mm 2 )<br />
Shape<br />
factor (mm)<br />
t filt d f ti C<br />
Q C<br />
Area reduction due<br />
to filter deformation<br />
(%)<br />
Q R<br />
3months<br />
1 PVD A 52 2.70 0.41 3.1 0.108<br />
2 PVD B 78 2.86 0.41 15.4 0.117<br />
3 PVD C 52 2.57 (3.91) 0.41 (0.48) 4.6 0.105*<br />
4 PVD D 213 3.98 0.47 21.5 0.230<br />
Notes: The number outside the parentheses is the average value <strong>of</strong> larger and smaller channels, and the<br />
number <strong>in</strong> parentheses is for the larger channel only (Figure 2). *Extrapolated value.<br />
Percent pass<strong>in</strong>g by weight (%)<br />
100<br />
80<br />
60<br />
40<br />
20<br />
PVDs A and C<br />
PVD B<br />
PVD D<br />
0<br />
0 100 200 300<br />
Apparent open<strong>in</strong>g size (µm)<br />
Figure 9.<br />
Apparent open<strong>in</strong>g size distribution <strong>of</strong> the PVD filters.<br />
130 GEOSYNTHETICS INTERNATIONAL S 2000, VOL. 7, NO. 2
MIURA AND CHAI D Discharge Capacity <strong>of</strong> Prefabricated Vertical Dra<strong>in</strong>s Conf<strong>in</strong>ed <strong>in</strong> Clay<br />
The size <strong>of</strong> a dra<strong>in</strong>age channel is expressed as its cross-sectional area. A parameter<br />
called the shape factor is <strong>in</strong>troduced to represent the shape <strong>of</strong> a dra<strong>in</strong>age channel. The<br />
shape factor <strong>of</strong> a dra<strong>in</strong>age channel is def<strong>in</strong>ed as the ratio <strong>of</strong> the cross-sectional area divided<br />
by the perimeter length <strong>of</strong> the cross section. To develop a relationship between<br />
the dra<strong>in</strong>age channel size/shape factor and the degree <strong>of</strong> <strong>discharge</strong> <strong>capacity</strong> reduction,<br />
an arbitrary <strong>discharge</strong> <strong>capacity</strong> ratio at three months, (Q C /Q R ) 3months , was adopted. For<br />
the PVDs tested, cross-sectional area, shape factor <strong>of</strong> the dra<strong>in</strong>age channel, area reduction<br />
due to filter deformation (t = 1 month and σ = 49 kPa), and the value <strong>of</strong><br />
(Q C /Q R ) 3months are given <strong>in</strong> Table 2. The follow<strong>in</strong>g observations can be made with regard<br />
to the data <strong>in</strong> Table 2: (i) there is no clear trend regard<strong>in</strong>g the relationship between apparent<br />
open<strong>in</strong>g size, O 95 , <strong>of</strong> the filter and (Q C /Q R ) 3months ; (ii) it appears that the geometry<br />
<strong>of</strong> the dra<strong>in</strong>age channel has an effect on the value <strong>of</strong> (Q C /Q R ) 3months . PVD D has the largest<br />
(Q C /Q R ) 3months value, and, accord<strong>in</strong>gly, it has the largest dra<strong>in</strong>age area per channel<br />
and the largest shape factor.<br />
2.3 Effect <strong>of</strong> Hydraulic Gradient<br />
For PVDs A, B, and D, <strong>clay</strong>-<strong>conf<strong>in</strong>ed</strong> <strong>discharge</strong> <strong>capacity</strong> tests were conducted us<strong>in</strong>g<br />
a higher hydraulic gradient (i ≈ 0.4) . The Q C /Q R values are compared <strong>in</strong> Figures 10a<br />
to 10c, respectively. As expected, for the PVDs tested, there was less reduction <strong>in</strong> the<br />
<strong>discharge</strong> <strong>capacity</strong> for higher i values. For example, at t = 2 months and i = 0.08, the<br />
<strong>clay</strong>-<strong>conf<strong>in</strong>ed</strong> <strong>discharge</strong> <strong>capacity</strong> was approximately 18, 20, and 23% <strong>of</strong> the rubber<br />
membrane-<strong>conf<strong>in</strong>ed</strong> short-term values for PVDs A, B, and D, respectively. For the i =<br />
0.4 case, the correspond<strong>in</strong>g values are approximately 35, 46, and 55%, respectively.<br />
The <strong>discharge</strong> <strong>capacity</strong> ratios for i = 0.4 are approximately twice the correspond<strong>in</strong>g values<br />
for i = 0.08.<br />
In the field, after construction and dur<strong>in</strong>g the consolidation process, the hydraulic<br />
gradient with<strong>in</strong> the PVD will reduce. Reduction <strong>of</strong>the hydraulic gradient promotesPVD<br />
clogg<strong>in</strong>g and reduces the PVD efficiency. This factorshould be considered whendesign<strong>in</strong>g<br />
s<strong>of</strong>t subsoil improvements us<strong>in</strong>g PVDs, especially when the designed consolidation<br />
period is long.<br />
3 ESTIMATION OF THE LONG-TERM CLAY-CONFINED DISCHARGE<br />
CAPACITY OF PVDs<br />
The long-term <strong>clay</strong>-<strong>conf<strong>in</strong>ed</strong> <strong>discharge</strong> <strong>capacity</strong> test is time consum<strong>in</strong>g and not a<br />
rout<strong>in</strong>e test. Based on the test results <strong>of</strong> the present study, an empirical equation is proposed<br />
to estimate the long-term <strong>clay</strong>-<strong>conf<strong>in</strong>ed</strong> <strong>discharge</strong> <strong>capacity</strong>, Q C , by us<strong>in</strong>g the<br />
short-term rubber membrane-<strong>conf<strong>in</strong>ed</strong> <strong>discharge</strong> <strong>capacity</strong>, Q R . It is assumed that the<br />
effect <strong>of</strong> conf<strong>in</strong><strong>in</strong>g pressure is approximately the same for the rubber membrane- and<br />
<strong>clay</strong>-<strong>conf<strong>in</strong>ed</strong> tests. Also, as discussed <strong>in</strong> Section 2.2, creep deformation may not be a<br />
significant factor under work<strong>in</strong>g conditions. Only two variables, elapsed time, t, and<br />
hydraulic gradient, i, are considered <strong>in</strong> the follow<strong>in</strong>g proposed equation:<br />
Q C = Q R<br />
i<br />
C s (t∕t c ) + i<br />
(2)<br />
GEOSYNTHETICS INTERNATIONAL S 2000, VOL. 7, NO. 2<br />
131
MIURA AND CHAI D Discharge Capacity <strong>of</strong> Prefabricated Vertical Dra<strong>in</strong>s Conf<strong>in</strong>ed <strong>in</strong> Clay<br />
(a)<br />
(b)<br />
(c)<br />
Discharge <strong>capacity</strong> ratio, Q C / Q R<br />
Discharge <strong>capacity</strong> ratio, Q C / Q R<br />
Discharge <strong>capacity</strong> ratio, Q C / Q R<br />
1<br />
0.8<br />
0.6<br />
0.4<br />
0.2<br />
0<br />
0<br />
1<br />
0.8<br />
0.6<br />
0.4<br />
0.2<br />
100 200 300<br />
0<br />
0<br />
1<br />
100 200 300<br />
PVD D σ =49kPa<br />
0.8<br />
i =0.4(measured)<br />
i =0.08(measured)<br />
0.6<br />
Predicted<br />
0.4<br />
0.2<br />
PVD A<br />
PVD B<br />
σ =49kPa<br />
i =0.4(measured)<br />
i =0.08(measured)<br />
Predicted<br />
σ =49kPa<br />
i =0.4(measured)<br />
i =0.08(measured)<br />
Predicted<br />
0<br />
0 100 200 300<br />
Elapsed time, t (days)<br />
Figure 10. Effect <strong>of</strong> the hydraulic gradient on the <strong>discharge</strong> <strong>capacity</strong> ratio values: (a) PVD<br />
A; (b) PVD B; (c) PVD D.<br />
132 GEOSYNTHETICS INTERNATIONAL S 2000, VOL. 7, NO. 2
MIURA AND CHAI D Discharge Capacity <strong>of</strong> Prefabricated Vertical Dra<strong>in</strong>s Conf<strong>in</strong>ed <strong>in</strong> Clay<br />
where: t c = time constant (= 1 day, which was <strong>in</strong>troduced to balance the units); and C s<br />
= constant. Although different soils and PVDs may have different C s values, for simplicity,<br />
C s = 0.01 is recommended for mak<strong>in</strong>g a prelim<strong>in</strong>ary prediction. The calculated/<br />
predicted <strong>discharge</strong> <strong>capacity</strong> ratio values for C s = 0.01 are <strong>in</strong>cluded <strong>in</strong> Figures 4a to 4d<br />
and Figures 10a to 10c as solid l<strong>in</strong>es. Generally, Equation 2 gives a reasonable prediction<br />
<strong>of</strong> long-term <strong>clay</strong>-<strong>conf<strong>in</strong>ed</strong> <strong>discharge</strong> capacities. For PVD B and a higher hydraulic<br />
gradient, i = 0.4, the prediction <strong>of</strong> Q C is poor. To improve the accuracy <strong>of</strong> the calculated<br />
Q C value, the C s value may be varied accord<strong>in</strong>g to soil conditions, filter type, and the<br />
geometry <strong>of</strong> the dra<strong>in</strong>age channel. Presently, there is not enough <strong>in</strong>formation to establish<br />
a general relationship between C s and these <strong>in</strong>fluenc<strong>in</strong>g factors. Qualitatively, the<br />
larger the creep deformation <strong>of</strong> the filter, the smaller the cross-sectional area, and, the<br />
smaller the dra<strong>in</strong>age channel shape factor, the larger the C s value. Therefore, for PVDs<br />
with a strong filter (for example, the PVD A filter), a larger dra<strong>in</strong>age-channel shape factor<br />
will cause less reduction <strong>of</strong> the <strong>discharge</strong> <strong>capacity</strong> with time. A larger square (ideally<br />
circular) dra<strong>in</strong>age channel will provide better performance than a rectangular dra<strong>in</strong>age<br />
channel with the same cross-sectional area. All <strong>of</strong> these factors should be considered<br />
when select<strong>in</strong>g a PVD.<br />
4 CONCLUSIONS<br />
The follow<strong>in</strong>g conclusions have been made regard<strong>in</strong>g the present study:<br />
1. Long-term <strong>clay</strong>-<strong>conf<strong>in</strong>ed</strong> <strong>discharge</strong> <strong>capacity</strong> tests were conducted for four types <strong>of</strong><br />
PVDs commonly used <strong>in</strong> Japan. The results <strong>in</strong>dicate that, for all <strong>of</strong> the PVDs tested,<br />
the <strong>discharge</strong> <strong>capacity</strong> significantly reduced with time. It is suggested that this factor<br />
be considered when design<strong>in</strong>g s<strong>of</strong>t subsoil improvements us<strong>in</strong>g PVDs.<br />
2. The two factors considered for the reduction <strong>of</strong> <strong>discharge</strong> <strong>capacity</strong> with time are<br />
creep deformation <strong>of</strong> the PVD filter and clogg<strong>in</strong>g <strong>of</strong> the PVD dra<strong>in</strong>age channels. The<br />
PVD filter creep tests <strong>in</strong>dicated that creep deformation <strong>of</strong> the filter only causes less<br />
than a 20% reduction <strong>of</strong> the cross-sectional area <strong>of</strong> the dra<strong>in</strong>age channel, which implies<br />
that clogg<strong>in</strong>g is a dom<strong>in</strong>at<strong>in</strong>g factor for the follow<strong>in</strong>g reasons:<br />
S The application <strong>of</strong> hydraulic shocks partially cleared up the clogg<strong>in</strong>g and significantly<br />
recovered the <strong>discharge</strong> <strong>capacity</strong> <strong>of</strong> the PVDs.<br />
S Increas<strong>in</strong>g the hydraulic gradient with<strong>in</strong> the PVD (i.e. reduce the clogg<strong>in</strong>g potential),<br />
reduced the amount <strong>of</strong> <strong>discharge</strong> <strong>capacity</strong> reduction with time.<br />
S The PVD with a larger dra<strong>in</strong>age channel and a larger shape factor (dra<strong>in</strong>age area<br />
per channel divided by its perimeter length) showed less <strong>discharge</strong> <strong>capacity</strong> reduction<br />
because the dra<strong>in</strong>age channel is not easily clogged.<br />
However, there is no clear trend between the apparent open<strong>in</strong>g size <strong>of</strong> the filter, O 95 ,<br />
and the <strong>discharge</strong> <strong>capacity</strong> reduction with time for the cases <strong>in</strong>vestigated.<br />
3. S<strong>in</strong>ce the long-term <strong>clay</strong>-<strong>conf<strong>in</strong>ed</strong> <strong>discharge</strong> <strong>capacity</strong> test is not a rout<strong>in</strong>e test, an empirical<br />
equation was proposed to estimate the long-term <strong>clay</strong>-<strong>conf<strong>in</strong>ed</strong> <strong>discharge</strong> <strong>capacity</strong><br />
<strong>of</strong> PVDs by us<strong>in</strong>g a short-term rubber membrane-<strong>conf<strong>in</strong>ed</strong> test result.<br />
GEOSYNTHETICS INTERNATIONAL S 2000, VOL. 7, NO. 2<br />
133
MIURA AND CHAI D Discharge Capacity <strong>of</strong> Prefabricated Vertical Dra<strong>in</strong>s Conf<strong>in</strong>ed <strong>in</strong> Clay<br />
4. For practical purposes, it is suggested that, regard<strong>in</strong>g the long-term <strong>discharge</strong> <strong>capacity</strong>,<br />
a PVD with a larger dra<strong>in</strong>age area per channel (approximately 3 mm 2 ) and a larger<br />
dra<strong>in</strong>age channel shape factor (greater than 0.40 mm) should be selected.<br />
ACKNOWLEDGMENTS<br />
This research was partly supported by K<strong>in</strong>jo Rubber Co., Ltd., Osaka, Japan. The<br />
authors would like to express their appreciation to N. Nomura, Director <strong>of</strong> the Technical<br />
Department <strong>of</strong> K<strong>in</strong>jo Rubber Co., Ltd., for his helpful suggestions and comments.<br />
Thanks are also extended to K. Toyota and H. Yamasaki, graduates <strong>of</strong> Saga University,<br />
Japan, for conduct<strong>in</strong>g some <strong>of</strong> the laboratory tests and assist<strong>in</strong>g <strong>in</strong> figure preparation.<br />
REFERENCES<br />
ASTM D 4751, “Standard Test Method for Determ<strong>in</strong><strong>in</strong>g Apparent Open<strong>in</strong>g Size <strong>of</strong> a<br />
Geotextile”, American Society for Test<strong>in</strong>g and Materials, West Conshohocken, Pennsylvania,<br />
USA.<br />
Chai, J.C. and Miura, N., 1999, “Investigation <strong>of</strong> Factors Affect<strong>in</strong>g Vertical Dra<strong>in</strong> Behavior”,<br />
Journal <strong>of</strong> Geotechnical and Geoenvironmental Eng<strong>in</strong>eer<strong>in</strong>g, Vol. 125, No.<br />
3, pp. 216-226.<br />
Chai, J.C., Miura, N., Sakajo, S. and Bergado, D.T., 1995, “Behavior <strong>of</strong> Vertical Dra<strong>in</strong><br />
Improved Subsoil Under Embankment Load<strong>in</strong>g”, Soils and Foundations, Vol. 35,<br />
No. 4, pp. 49-61.<br />
Giroud, J.P., 1996, “Granular Filters and Geotextile Filters”, Ge<strong>of</strong>ilters ’96: comptes<br />
rendus, Lafleur, J. and Roll<strong>in</strong>, A., Editors, École Polytechnique, Proceed<strong>in</strong>gs <strong>of</strong> the<br />
conference Ge<strong>of</strong>ilters’96 held <strong>in</strong> Montreal, Quebec, Canada, May 1996, pp. 565-680.<br />
Hansbo, S., 1981, “Consolidation <strong>of</strong> F<strong>in</strong>e-Gra<strong>in</strong>ed Soils by Prefabricated Dra<strong>in</strong>s”, Proceed<strong>in</strong>gs<br />
<strong>of</strong> the Tenth International Conference on Soil Mechanics and Foundation<br />
Eng<strong>in</strong>eer<strong>in</strong>g, Balkema, Vol. 3, Stockholm, Sweden, June 1981, pp. 677-682.<br />
Miura, N., Chai, J.C. and Toyota, K, 1998, “Investigation on Some Factors Affect<strong>in</strong>g<br />
Discharge Capacity <strong>of</strong> Prefabricated Vertical Dra<strong>in</strong>”, Proceed<strong>in</strong>gs <strong>of</strong> the Sixth International<br />
Conference on Geosynthetics, IFAI, Vol. 2, Atlanta, Georgia, USA, April<br />
1998, pp. 845-850.<br />
Miura, N., Park, Y.M. and Madhav, M.R., 1993, “Fundamental Study on the Discharge<br />
Capacity <strong>of</strong> Plastic Board Dra<strong>in</strong>”, Journal <strong>of</strong> Geotechnical Eng<strong>in</strong>eer<strong>in</strong>g,JSCE,Vol.<br />
35, No. 3, pp. 31-40. (<strong>in</strong> Japanese)<br />
134 GEOSYNTHETICS INTERNATIONAL S 2000, VOL. 7, NO. 2
MIURA AND CHAI D Discharge Capacity <strong>of</strong> Prefabricated Vertical Dra<strong>in</strong>s Conf<strong>in</strong>ed <strong>in</strong> Clay<br />
NOTATIONS<br />
Basic SI units are given <strong>in</strong> parentheses.<br />
B = width <strong>of</strong> dra<strong>in</strong>age channel (m)<br />
C s = a constant (Equation 2) (dimensionless)<br />
F = conf<strong>in</strong><strong>in</strong>g load (N/m)<br />
i = hydraulic gradient (dimensionless)<br />
L = length <strong>of</strong> specimen (m)<br />
O 95 = filter open<strong>in</strong>g size such that 95% <strong>of</strong> pores are smaller than that size,<br />
i.e apparent open<strong>in</strong>g size <strong>of</strong> filter (m)<br />
Q = rate <strong>of</strong> water flow dur<strong>in</strong>g <strong>discharge</strong> <strong>capacity</strong> test (m 3 /s)<br />
Q C = <strong>conf<strong>in</strong>ed</strong> <strong>in</strong>-<strong>clay</strong> <strong>discharge</strong> <strong>capacity</strong> (m 3 /s)<br />
Q R = <strong>conf<strong>in</strong>ed</strong> <strong>in</strong> rubber membrane <strong>discharge</strong> <strong>capacity</strong> (m 3 /s)<br />
(Q C /Q R ) 3months<br />
= <strong>discharge</strong> <strong>capacity</strong> ratio after three months (dimensionless)<br />
R A = reduction <strong>of</strong> cross-sectional area (%)<br />
T = tensile force <strong>in</strong> filter (N/m)<br />
t = time (s)<br />
t c = time constant = 1 day<br />
x = horizontal distance (m)<br />
y = <strong>vertical</strong> distance (m)<br />
α = <strong>in</strong>cl<strong>in</strong>ation angle (_)<br />
∆H = total head difference (m)<br />
∆h = head loss with<strong>in</strong> hose system <strong>of</strong> test apparatus (m)<br />
ε = tensile stra<strong>in</strong> (dimensionless)<br />
σ = conf<strong>in</strong><strong>in</strong>g pressure (N/m 2 )<br />
GEOSYNTHETICS INTERNATIONAL S 2000, VOL. 7, NO. 2<br />
135