UV measurements in the centre of East Antarctic Plateau - GEWEX
UV measurements in the centre of East Antarctic Plateau - GEWEX
UV measurements in the centre of East Antarctic Plateau - GEWEX

Create successful ePaper yourself
Turn your PDF publications into a flip-book with our unique Google optimized e-Paper software.
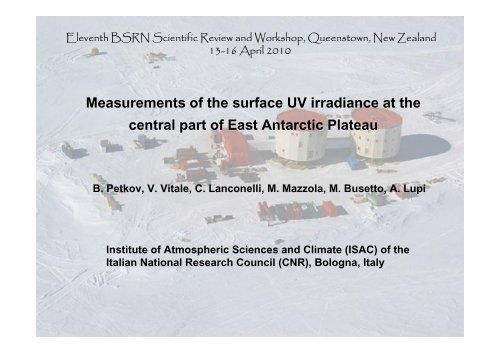
Eleventh BSRN Scientific Review and Workshop, Queenstown, New Zealand<br />
13-16 April 2010<br />
Measurements <strong>of</strong> <strong>the</strong> surface <strong>UV</strong> irradiance at <strong>the</strong><br />
central part <strong>of</strong> <strong>East</strong> <strong>Antarctic</strong> <strong>Plateau</strong><br />
B. Petkov, V. Vitale, C. Lanconelli, M. Mazzola, M. Busetto, A. Lupi<br />
Institute <strong>of</strong> Atmospheric Sciences and Climate (ISAC) <strong>of</strong> <strong>the</strong><br />
Italian National Research Council (CNR), Bologna, Italy
The results, presented below are obta<strong>in</strong>ed by<br />
UltraViolet narrow-band filter RADiometer (<strong>UV</strong>-RAD),<br />
designed at <strong>the</strong> Institute <strong>of</strong> Atmospheric Sciences<br />
and Climate (ISAC) <strong>of</strong> <strong>the</strong> Italian National Research<br />
Council (CNR) to measure <strong>the</strong> surface solar <strong>UV</strong><br />
irradiance <strong>in</strong> harsh <strong>Antarctic</strong> conditions.
On <strong>the</strong> left, diagram <strong>of</strong> <strong>the</strong> <strong>UV</strong>-RAD radiometer, with its ma<strong>in</strong> components: 1 –<br />
hemispherical diffuser; 2 – entrance optics with field stopper and collimat<strong>in</strong>g system<br />
(consist<strong>in</strong>g <strong>of</strong> two lenses); 3 – <strong>UV</strong>-VIS pass-band with <strong>the</strong> pair <strong>of</strong> colored glass filters<br />
(see also Fig. 3); 4 – filter-wheel; 5 – synchronous motor rotat<strong>in</strong>g <strong>the</strong> filter-wheel; 6 –<br />
photomultiplier; 7 – <strong>the</strong>rmoelectric (Peltier) heat pump; 8 – record<strong>in</strong>g and controll<strong>in</strong>g<br />
electronics. On <strong>the</strong> right, photograph <strong>of</strong> <strong>the</strong> <strong>in</strong>strument dur<strong>in</strong>g a measurement test <strong>in</strong><br />
<strong>Antarctic</strong>a. The radiometer sizes are 310x300x370 mm, with an overall weight <strong>of</strong> 12 kg.
COMPONENT TRANSMITTANCE (%)<br />
OVERALL<br />
TRANSMITTANCE (%)<br />
100<br />
75<br />
50<br />
25<br />
0<br />
100<br />
75<br />
50<br />
25<br />
0<br />
100<br />
75<br />
50<br />
25<br />
0<br />
100<br />
75<br />
50<br />
25<br />
0<br />
30<br />
20<br />
10<br />
0<br />
<strong>UV</strong>-VIS Pass-band<br />
<strong>UV</strong> short-pass<br />
Narrow-band Filter<br />
314.25 nm channel<br />
WAVELENGTH (nm)<br />
(a)<br />
(b)<br />
Colored Filter<br />
ORIEL 51 124<br />
(c)<br />
(d)<br />
(e)<br />
200 300 400 500 600 700 800<br />
The channel<br />
structure<br />
Photomultiplier Entranse optics<br />
<strong>UV</strong>-VIS Pass band<br />
Colored filter<br />
Colored filter<br />
<strong>UV</strong> short-pass<br />
F i l t e r<br />
N<br />
1<br />
2<br />
3<br />
4<br />
5<br />
6<br />
7<br />
<strong>UV</strong><br />
Shortpass<br />
<strong>UV</strong>-<br />
VIS<br />
Passband<br />
1<br />
1<br />
1<br />
1<br />
1<br />
1<br />
1<br />
Characteristics <strong>of</strong> <strong>the</strong> <strong>UV</strong>-RAD channels<br />
Number <strong>of</strong> <strong>the</strong> optical elements employed<br />
to def<strong>in</strong>e each <strong>UV</strong>-RAD channel<br />
Colored<br />
glass<br />
filter<br />
2<br />
2<br />
2<br />
2<br />
2<br />
2<br />
2<br />
2<br />
2<br />
2<br />
1<br />
1<br />
1<br />
1<br />
Narrowband<br />
filter<br />
1<br />
1<br />
1<br />
1<br />
1<br />
1<br />
1<br />
Peak<br />
transmittance<br />
wavelength<br />
(nm)<br />
299.60<br />
305.80<br />
309.60<br />
314.25<br />
325.50<br />
338.30<br />
364.05<br />
FWHM<br />
(nm)<br />
0.67<br />
0.71<br />
0.67<br />
0.73<br />
0.80<br />
0.86<br />
0.98<br />
Peak<br />
transmittance<br />
0.14<br />
0.15<br />
0.20<br />
0.26<br />
0.24<br />
0.27<br />
0.12<br />
From <strong>the</strong> left (i) spectral transmittance<br />
curves <strong>of</strong> <strong>the</strong> various components used to<br />
give form to <strong>the</strong> 314.25 nm <strong>UV</strong>-RAD channel<br />
(ii) sequence <strong>of</strong> <strong>the</strong> optical components<br />
used to def<strong>in</strong>e <strong>the</strong> overall <strong>UV</strong>-RAD channel<br />
structure follow<strong>in</strong>g <strong>the</strong> <strong>in</strong>com<strong>in</strong>g radiation<br />
direction (from <strong>the</strong> top to <strong>the</strong> bottom) and<br />
(iii) <strong>the</strong> characteristics <strong>of</strong> <strong>the</strong> <strong>UV</strong>-RAD<br />
channels
C o s i n e e r r o r<br />
1.08<br />
C O S I N E E R R O R<br />
1.06<br />
1.04<br />
1.02<br />
1.00<br />
CEg (299.60 nm)<br />
CEg (325.50 nm)<br />
CEg (364.05 nm) Angular dependence<br />
0.98<br />
0° 30° 60° 90°<br />
S O L A R Z E N I T H A N G L E<br />
curves <strong>of</strong> <strong>the</strong> cos<strong>in</strong>e<br />
error CE g <strong>of</strong> <strong>UV</strong>-RAD<br />
entrance optics, as a<br />
function <strong>of</strong> solar zenith<br />
angle for three different<br />
channels.
The performed by <strong>UV</strong>-RAD <strong>measurements</strong> allow:<br />
Retrieval <strong>of</strong> <strong>the</strong> total ozone amount us<strong>in</strong>g <strong>the</strong> Stamnes method (The<br />
ratio <strong>of</strong> irradiance at two wavelengths is compared with <strong>the</strong><br />
correspond<strong>in</strong>g one evaluated by radiative transfer model for different<br />
solar zenith angles and ozone amounts).<br />
Reconstruction <strong>of</strong> <strong>the</strong> surface solar <strong>UV</strong> spectrum<br />
Evaluation <strong>of</strong> <strong>the</strong> weighted dose rates and correspond<strong>in</strong>g daily doses
Reconstruction <strong>of</strong> <strong>the</strong> solar spectrum us<strong>in</strong>g <strong>the</strong> <strong>UV</strong>-RAD data<br />
IRRADIANCE (mW m -2 nm -1 )<br />
140<br />
120<br />
100<br />
80<br />
60<br />
40<br />
20<br />
model (T<strong>UV</strong>)<br />
measured (Brewer)<br />
0<br />
290 300 310 320 330 340 350 360 370<br />
WAVELENGTH (nm)<br />
The nowadays radiative transfer<br />
models are able to represent<br />
realistically <strong>the</strong> features <strong>of</strong> <strong>the</strong><br />
surface solar irradiance. The figure<br />
shows a comparison between<br />
measured by Brewer <strong>UV</strong> spectrum at<br />
ALOMAR, Norway and<br />
correspond<strong>in</strong>g one, evaluated<br />
through T<strong>UV</strong> model<br />
IRRADIANCE (mW m -2 nm -1 )<br />
200<br />
150<br />
100<br />
50<br />
0<br />
3<br />
290 300 310 320 330 340 350 360 370 380 390 400 410<br />
WAVELENGTH (nm)<br />
Bear<strong>in</strong>g <strong>in</strong> m<strong>in</strong>d this and <strong>the</strong> spectral characteristics <strong>of</strong> <strong>the</strong><br />
<strong>UV</strong>-RAD channels, <strong>the</strong> solar spectrum is reconstructed<br />
through <strong>the</strong> follow<strong>in</strong>g steps:<br />
1. Measurements<br />
2<br />
2. Model evaluation (us<strong>in</strong>g T<strong>UV</strong>) with 1 nm resolution<br />
and FWHM = 0.8 nm, tak<strong>in</strong>g <strong>the</strong> retrieved total<br />
ozone as <strong>in</strong>put<br />
3. Fitt<strong>in</strong>g <strong>the</strong> evaluated spectrum to measured values<br />
1
Evaluation <strong>of</strong> <strong>the</strong> ery<strong>the</strong>mal dose rate<br />
200<br />
10 1<br />
dD<br />
dt<br />
=<br />
∫ ∞<br />
0<br />
F( λ)<br />
A(<br />
λ)<br />
dλ<br />
IRRADIANCE (mW m -2 nm -1 )<br />
150<br />
100<br />
50<br />
Solar spectrum at <strong>the</strong> ground<br />
CIE Ery<strong>the</strong>mal action spectrum<br />
10 0<br />
10 -1<br />
10 -2<br />
10 -3<br />
10 -4<br />
ERITHEMA ACTION SPECTRUM<br />
0<br />
290 300 310 320 330 340 350 360 370 380 390 400 410<br />
WAVELENGTH (nm)<br />
10 -5<br />
F(λ) is measured solar spectrum<br />
A(λ) is <strong>the</strong> ery<strong>the</strong>mal action spectrum
<strong>UV</strong>-RAD was calibrated through a comparison with<br />
<strong>the</strong> Bentam spectroradiometer operat<strong>in</strong>g at<br />
ALOMAR (Arctic Lidar Observatory for Middle<br />
Atmosphere Research), Andenes, Norway. After<br />
that, <strong>UV</strong>-RAD was participated <strong>in</strong> several<br />
<strong>in</strong>tercomparison campaigns which help to control<br />
<strong>the</strong> quality <strong>of</strong> <strong>the</strong> <strong>in</strong>strument and to make <strong>the</strong><br />
necessary corrections.
Intercomparison campaign at ALOMAR, Norway<br />
September-November, 2004<br />
Brewer<br />
Bentham<br />
<strong>UV</strong>-RAD<br />
G<strong>UV</strong>
ERYTHEMAL<br />
DOSE RATE (mW m -2 )<br />
10<br />
8<br />
6<br />
4<br />
2<br />
0<br />
1.2<br />
<strong>UV</strong>-RAD<br />
G<strong>UV</strong><br />
Brewer<br />
Daily time-patterns <strong>of</strong> <strong>the</strong> <strong>UV</strong> ery<strong>the</strong>mal dose<br />
rates measured at <strong>the</strong> ALOMAR<br />
Observatory, on 17 October, 2004, for<br />
predom<strong>in</strong>ant clear-sky conditions, with <strong>the</strong><br />
<strong>UV</strong>-RAD radiometer, G<strong>UV</strong> radiometer, and<br />
Brewer spectroradiometer.<br />
BREWER / <strong>UV</strong>-RAD<br />
G<strong>UV</strong> / <strong>UV</strong>-RAD<br />
1.1<br />
1.0<br />
0.9<br />
0.8<br />
1.4<br />
1.2<br />
1.0<br />
0.8<br />
0.6<br />
7 8 9 10 11 12 13 14 15 16 17<br />
LOCAL TIME<br />
Values <strong>of</strong> <strong>the</strong> difference between <strong>the</strong> <strong>UV</strong> dose rates<br />
determ<strong>in</strong>ed from <strong>the</strong> Brewer<br />
spectroradiometer and <strong>the</strong> <strong>UV</strong>-RAD<br />
radiometer <strong>measurements</strong>, carried out at<br />
different hours <strong>of</strong> <strong>the</strong> day dur<strong>in</strong>g <strong>the</strong><br />
ALOMAR campaign, giv<strong>in</strong>g overall mean<br />
value equal to 0.9%, toge<strong>the</strong>r with standard<br />
deviations <strong>of</strong> 2.4%.<br />
Scatter diagram <strong>of</strong> <strong>the</strong> <strong>UV</strong> dose rates determ<strong>in</strong>ed<br />
by G<strong>UV</strong> and <strong>UV</strong>-RAD at ALOMAR on <strong>the</strong><br />
different days <strong>of</strong> <strong>the</strong> October 2004 fieldcampaign,<br />
giv<strong>in</strong>g a mean value <strong>of</strong> 5% with<br />
standard deviation equal to 6%.
Intercomparison campaign at Aosta, Italy<br />
September, 2006<br />
IRRADIANCE (W m -2 )<br />
<strong>UV</strong>-RAD / BENTHAM<br />
0.4<br />
0.3<br />
0.2<br />
0.1<br />
325 nm 338 nm<br />
<strong>UV</strong>-RAD<br />
Bentham<br />
0.0<br />
1.3<br />
1.2<br />
1.1<br />
1.0<br />
0.9<br />
0.8<br />
0.7<br />
4 6 8 10 12 14 16 18 20 6 8 10 12 14 16 18 20<br />
TIME (hours UTC)<br />
Comparison between <strong>UV</strong><br />
irradiance, measured by <strong>UV</strong>-<br />
RAD at 325 and 338 nm<br />
channels, respectively at Aosta,<br />
Italy on 20 Sep 2006 and<br />
correspond<strong>in</strong>g ones given by<br />
Bentham spectroradiometer<br />
rout<strong>in</strong>ely operat<strong>in</strong>g at ARPA<br />
Aosta station. The lower panels<br />
show <strong>the</strong> ratio between two<br />
<strong>in</strong>struments.
Intercomparison campaign at Ny-Ålesund, Norway<br />
May-June, 2009
Solar <strong>UV</strong>-Index <strong>measurements</strong> from <strong>the</strong> AWI<br />
spectroradiometer, Brewer #050, <strong>the</strong> multifilter<br />
radiometer <strong>UV</strong>RAD, <strong>the</strong> multifilter radiometer<br />
G<strong>UV</strong>7275 and <strong>the</strong> QASUME reference<br />
spectroradiometer. The measurement period lasted<br />
from 27 May to 6 June 2009 and was located at Ny-<br />
Ålesund, Svalbard, Norway.<br />
Ratio between <strong>the</strong> <strong>UV</strong>-Indices<br />
determ<strong>in</strong>ed by <strong>UV</strong>RAD to <strong>the</strong> ones from<br />
<strong>the</strong> QASUME spectroradiometer.<br />
Gröbner et al., Photochem. Photobiol. Sci., 2009, DOI: 10.1039/B9PP00170K
Three radiometers <strong>UV</strong>-RAD has<br />
been operat<strong>in</strong>g
at ISAC-CNR Bologna, Italy station from 2005
at Dome Concordia <strong>Antarctic</strong> station from 2007
at Ny-Ålesund Arctic station from 2008
TOTAL OZONE AMOUNT, MEASURED AT NY-ÅLESUND AND<br />
DOME CONCORDIA<br />
R A T I O<br />
TOTAL OZONE (DU)<br />
500<br />
450<br />
400<br />
350<br />
300<br />
250<br />
200<br />
1.2<br />
1.1<br />
1.0<br />
0.9<br />
0.8<br />
0.7<br />
Ny-Ålesund<br />
MAY JUN JUL AUG<br />
<strong>UV</strong>-RAD/OMI<br />
<strong>UV</strong>-RAD/SAOZ<br />
JUN JUL AUG SEP OCT<br />
2008 2009<br />
<strong>UV</strong>-RAD<br />
SAOZ<br />
OMI<br />
RATIO<br />
TOTAL OZONE (DU)<br />
400<br />
360<br />
320<br />
280<br />
240<br />
200<br />
160<br />
120<br />
Nov Dec<br />
1.6<br />
1.4<br />
1.2<br />
1.0<br />
0.8<br />
0.6<br />
0.4<br />
Nov Dec<br />
2007<br />
Dome Concordia<br />
Jan Feb<br />
Jan Feb<br />
SAOZ<br />
OMI<br />
<strong>UV</strong>-RAD<br />
Oct Nov Dec Jan Feb Oct Nov<br />
Oct Nov Dec<br />
2008<br />
<strong>UV</strong>-RAD/OMI<br />
<strong>UV</strong>-RAD/SAOZ<br />
Jan Feb Oct Nov<br />
2009<br />
The figures present <strong>the</strong> total ozone amount measured by <strong>UV</strong>-RAD (<strong>in</strong> blue) at Ny-Ålesund<br />
(2008 and 2009) and Dome Concordia (2007-2009). For comparison <strong>the</strong> data taken from <strong>the</strong><br />
satellite <strong>in</strong>strument OMI (<strong>in</strong> green) and spectrophotometer SAOZ (<strong>in</strong> red) based at both<br />
stations are also given. The SAOZ data obta<strong>in</strong>ed as a result <strong>of</strong> observations performed <strong>in</strong> <strong>the</strong><br />
period, when <strong>the</strong> solar elevation exceeded 5° dur<strong>in</strong>g all <strong>the</strong> day are not considered. The lower<br />
panels show <strong>the</strong> ratio between <strong>UV</strong>-RAD and two o<strong>the</strong>r <strong>in</strong>struments.
DAILY ERYTHEMAL DOSE<br />
AT NY-ÅLESUND AND<br />
DOME CONCORDIA<br />
The daily ery<strong>the</strong>mal dose, def<strong>in</strong>ed by<br />
<strong>UV</strong>-RAD at two stations dur<strong>in</strong>g <strong>the</strong> 2007-<br />
2009 period. The clear sky values are<br />
determ<strong>in</strong>ed trough model evaluations<br />
tak<strong>in</strong>g <strong>the</strong> total ozone, retrieved from <strong>the</strong><br />
<strong>UV</strong>-RAD data as <strong>in</strong>put parameter.<br />
The figures demonstrate<br />
that <strong>the</strong> daily ery<strong>the</strong>mal<br />
dose at Ny-Ålesund is<br />
ma<strong>in</strong>ly affected by <strong>the</strong><br />
cloud cover conditions<br />
while <strong>the</strong> total ozone<br />
variations predom<strong>in</strong>antly<br />
cause <strong>the</strong> correspond<strong>in</strong>g<br />
ery<strong>the</strong>mal dose variations<br />
at Concordia station.<br />
ERYTHEMAL DOSE (kJ m -2 )<br />
8<br />
6<br />
4<br />
2<br />
0<br />
Nov<br />
Dec<br />
2007<br />
ERYTHEMAL DOSE (kJ m -2 )<br />
3.5<br />
3.0<br />
2.5<br />
2.0<br />
1.5<br />
1.0<br />
0.5<br />
0.0<br />
Dome Concordia<br />
Jan Feb<br />
MAY JUN JUL AUG<br />
2008<br />
2008<br />
Aug Sep Oct Nov Dec<br />
Clear sky Dose<br />
Measured Dose<br />
Ny-Ålesund<br />
JUN JUL AUG SEP<br />
Jan Feb Mar<br />
2009<br />
Clear sky Dose<br />
Measured Dose<br />
2009<br />
AugSepOctNov
TOTAL OZONE (DU)<br />
450<br />
400<br />
350<br />
300<br />
250<br />
200<br />
150<br />
100<br />
(a)<br />
SAOZ<br />
OMI<br />
<strong>UV</strong>-RAD<br />
VARIATION OF THE<br />
SURFACE <strong>UV</strong> IRRADIANCE<br />
DURING THE 2008 AND<br />
2009 AUSTRAL SPRINGS AT<br />
DOME CONCORDIA<br />
I R R A D I A N C E ( W m -2 nm -1 )<br />
CLOUD TRANSMITTANCE<br />
T cloud<br />
6.0 10 -4<br />
5.0<br />
4.0<br />
3.0<br />
2.0<br />
1.0<br />
(b)<br />
0.0<br />
8.0 10 -2<br />
7.0<br />
6.0<br />
5.0<br />
4.0<br />
3.0<br />
1.0<br />
0.9<br />
0.8<br />
0.7<br />
0.6<br />
0.5<br />
0.4<br />
AUG<br />
306 nm<br />
364 nm<br />
(c)<br />
(d)<br />
SEP OCT NOV AUG SEP OCT NOV<br />
2008 2009<br />
180<br />
160<br />
140<br />
120<br />
100<br />
80<br />
60<br />
40<br />
LONGWAVE<br />
IRRADIANCE (W m -2 )<br />
Comparison between (a) variations <strong>of</strong> <strong>the</strong><br />
total ozone amount determ<strong>in</strong>ed at<br />
Concordia station by different <strong>in</strong>struments,<br />
(b) time-patterns <strong>of</strong> <strong>the</strong> solar irradiance at<br />
306 nm and (c) 364 nm wavelengths<br />
respectively, measured by <strong>UV</strong>-RAD at z o<br />
= 85°. The yellow curve <strong>in</strong> (c) presents <strong>the</strong><br />
runn<strong>in</strong>g average <strong>of</strong> <strong>the</strong> <strong>measurements</strong><br />
performed over five days. Panel (d) shows<br />
variations <strong>of</strong> <strong>the</strong> cloud transmittance T cloud<br />
(green dots) as obta<strong>in</strong>ed follow<strong>in</strong>g <strong>the</strong><br />
Long and Ackerman methodology. The<br />
dark green curves represent <strong>the</strong> five-days<br />
runn<strong>in</strong>g averaged time-patterns <strong>of</strong> T cloud .<br />
In <strong>the</strong> same panel, <strong>the</strong> mean daily values<br />
<strong>of</strong> LWI down-well<strong>in</strong>g irradiation are also<br />
given (yellow triangles) toge<strong>the</strong>r with fivedays<br />
runn<strong>in</strong>g averaged time-patterns<br />
(dark yellow curves).<br />
Vitale et al., submitted to <strong>Antarctic</strong> Science
DEPENDENCE OF <strong>UV</strong>-B IRRADIANCE ON THE TOTAL OZONE<br />
AMOUNT DURING THE 2008 AND 2009 SPRINGS<br />
IRRADIANCE I(306 nm) (W m -2 )<br />
6.0 10 -4 I 306<br />
−4<br />
= 10.37 10<br />
−<br />
e<br />
R = - 0.75<br />
5.0<br />
4.0<br />
−3<br />
8.0 10 Q<br />
( )<br />
3.0<br />
2.0<br />
1.0<br />
0.0<br />
100 150 200 250 300<br />
TOTAL OZONE AMOUNT Q (DU)<br />
Irradiance I(306) measured by<br />
<strong>UV</strong>-RAD versus total ozone<br />
amount determ<strong>in</strong>ed by SAOZ<br />
and OMI <strong>in</strong>struments. The<br />
irradiance values presented<br />
refer to <strong>the</strong> case <strong>in</strong> which <strong>the</strong><br />
solar zenith angle was equal to<br />
85°. The best curve (solid) is<br />
presented toge<strong>the</strong>r with its<br />
analytical expression and two<br />
dashed curves show<strong>in</strong>g <strong>the</strong><br />
standard error <strong>of</strong> estimation.<br />
The correspond<strong>in</strong>g regression<br />
coefficient R is also <strong>in</strong>dicated.<br />
Vitale et al., submitted to <strong>Antarctic</strong> Science
Thank you for <strong>the</strong> attention!