Liquid vs. solid culture for tuberculosis: performance ... - GHDonline
Liquid vs. solid culture for tuberculosis: performance ... - GHDonline
Liquid vs. solid culture for tuberculosis: performance ... - GHDonline

You also want an ePaper? Increase the reach of your titles
YUMPU automatically turns print PDFs into web optimized ePapers that Google loves.
MGIT <strong>vs</strong>. L J in gold mines in South Africa 1027<br />
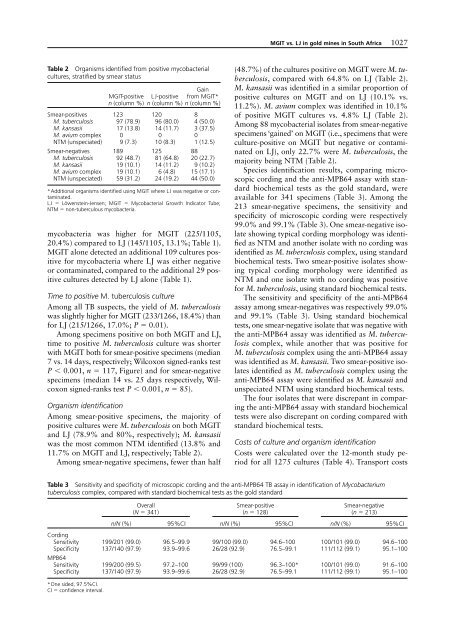
Table 2 Organisms identified from positive mycobacterial<br />
<strong>culture</strong>s, stratified by smear status<br />
Smear-positives<br />
M. <strong>tuberculosis</strong><br />
M. kansasii<br />
M. avium complex<br />
NTM (unspeciated)<br />
MGIT-positive<br />
n (column %)<br />
123<br />
97 (78.9)<br />
17 (13.8)<br />
0<br />
9 (7.3)<br />
L J-positive<br />
n (column %)<br />
120<br />
96 (80.0)<br />
14 (11.7)<br />
0<br />
10 (8.3)<br />
Gain<br />
from MGIT*<br />
n (column %)<br />
8<br />
4 (50.0)<br />
3 (37.5)<br />
0<br />
1 (12.5)<br />
Smear-negatives 189 125 88<br />
M. <strong>tuberculosis</strong><br />
M. kansasii<br />
M. avium complex<br />
NTM (unspeciated)<br />
92 (48.7)<br />
19 (10.1)<br />
19 (10.1)<br />
59 (31.2)<br />
81 (64.8)<br />
14 (11.2)<br />
6 (4.8)<br />
24 (19.2)<br />
20 (22.7)<br />
9 (10.2)<br />
15 (17.1)<br />
44 (50.0)<br />
* Additional organisms identified using MGIT where L J was negative or contaminated.<br />
L J = Löwenstein-Jensen; MGIT = Mycobacterial Growth Indicator Tube;<br />
NTM = non-tuberculous mycobacteria.<br />
m ycobacteria was higher <strong>for</strong> MGIT (225/1105,<br />
20.4%) compared to LJ (145/1105, 13.1%; Table 1).<br />
MGIT alone detected an additional 109 <strong>culture</strong>s positive<br />
<strong>for</strong> mycobacteria where LJ was either negative<br />
or contaminated, compared to the additional 29 positive<br />
<strong>culture</strong>s detected by LJ alone (Table 1).<br />
Time to positive M. <strong>tuberculosis</strong> <strong>culture</strong><br />
Among all TB suspects, the yield of M. <strong>tuberculosis</strong><br />
was slightly higher <strong>for</strong> MGIT (233/1266, 18.4%) than<br />
<strong>for</strong> LJ (215/1266, 17.0%; P = 0.01).<br />
Among specimens positive on both MGIT and LJ,<br />
time to positive M. <strong>tuberculosis</strong> <strong>culture</strong> was shorter<br />
with MGIT both <strong>for</strong> smear-positive specimens (median<br />
7 <strong>vs</strong>. 14 days, respectively; Wilcoxon signed-ranks test<br />
P < 0.001, n = 117, Figure) and <strong>for</strong> smear-negative<br />
specimens (median 14 <strong>vs</strong>. 25 days respectively, Wilcoxon<br />
signed-ranks test P < 0.001, n = 85).<br />
Organism identification<br />
Among smear-positive specimens, the majority of<br />
positive <strong>culture</strong>s were M. <strong>tuberculosis</strong> on both MGIT<br />
and LJ (78.9% and 80%, respectively); M. kansasii<br />
was the most common NTM identified (13.8% and<br />
11.7% on MGIT and LJ, respectively; Table 2).<br />
Among smear-negative specimens, fewer than half<br />
(48.7%) of the <strong>culture</strong>s positive on MGIT were M. <strong>tuberculosis</strong>,<br />
compared with 64.8% on LJ (Table 2).<br />
M. kansasii was identified in a similar proportion of<br />
positive <strong>culture</strong>s on MGIT and on LJ (10.1% <strong>vs</strong>.<br />
11.2%). M. avium complex was identified in 10.1%<br />
of positive MGIT <strong>culture</strong>s <strong>vs</strong>. 4.8% LJ (Table 2).<br />
Among 88 mycobacterial isolates from smear-negative<br />
specimens ‘gained’ on MGIT (i.e., specimens that were<br />
<strong>culture</strong>-positive on MGIT but negative or contaminated<br />
on LJ), only 22.7% were M. <strong>tuberculosis</strong>, the<br />
majority being NTM (Table 2).<br />
Species identification results, comparing microscopic<br />
cording and the anti-MPB64 assay with standard<br />
biochemical tests as the gold standard, were<br />
available <strong>for</strong> 341 specimens (Table 3). Among the<br />
213 smear-negative specimens, the sensitivity and<br />
specificity of microscopic cording were respectively<br />
99.0% and 99.1% (Table 3). One smear-negative isolate<br />
showing typical cording morphology was identified<br />
as NTM and another isolate with no cording was<br />
identified as M. tu berculosis complex, using standard<br />
biochemical tests. Two smear-positive isolates showing<br />
typical cording morphology were identified as<br />
NTM and one isolate with no cording was positive<br />
<strong>for</strong> M. <strong>tuberculosis</strong>, using standard biochemical tests.<br />
The sensitivity and specificity of the anti-MPB64<br />
assay among smear-negatives was respectively 99.0%<br />
and 99.1% (Table 3). Using standard biochemical<br />
tests, one smear-negative isolate that was negative with<br />
the anti-MPB64 assay was identified as M. <strong>tuberculosis</strong><br />
complex, while another that was positive <strong>for</strong><br />
M. <strong>tuberculosis</strong> complex using the anti-MPB64 assay<br />
was identified as M. kansasii. Two smear-positive isolates<br />
identified as M. <strong>tuberculosis</strong> complex using the<br />
anti-MPB64 assay were identified as M. kansasii and<br />
unspeciated NTM using standard biochemical tests.<br />
The four isolates that were discrepant in comparing<br />
the anti-MPB64 assay with standard biochemical<br />
tests were also discrepant on cording compared with<br />
standard biochemical tests.<br />
Costs of <strong>culture</strong> and organism identification<br />
Costs were calculated over the 12-month study period<br />
<strong>for</strong> all 1275 <strong>culture</strong>s (Table 4). Transport costs<br />
Table 3 Sensitivity and specificity of microscopic cording and the anti-MPB64 TB assay in identification of Mycobacterium<br />
<strong>tuberculosis</strong> complex, compared with standard biochemical tests as the gold standard<br />
Overall<br />
(N = 341)<br />
Smear-positive<br />
(n = 128)<br />
Smear-negative<br />
(n = 213)<br />
n/N (%) 95%CI n/N (%) 95%CI n/N (%) 95%CI<br />
Cording<br />
Sensitivity 199/201 (99.0) 96.5–99.9 99/100 (99.0) 94.6–100 100/101 (99.0) 94.6–100<br />
Specificity 137/140 (97.9) 93.9–99.6 26/28 (92.9) 76.5–99.1 111/112 (99.1) 95.1–100<br />
MPB64<br />
Sensitivity 199/200 (99.5) 97.2–100 99/99 (100) 96.3–100* 100/101 (99.0) 91.6–100<br />
Specificity 137/140 (97.9) 93.9–99.6 26/28 (92.9) 76.5–99.1 111/112 (99.1) 95.1–100<br />
* One sided, 97.5%CI.<br />
CI = confidence interval.