Magnetic anomaly map for Northern, Western, and ... - geo.edu.ro
Magnetic anomaly map for Northern, Western, and ... - geo.edu.ro
Magnetic anomaly map for Northern, Western, and ... - geo.edu.ro

Create successful ePaper yourself
Turn your PDF publications into a flip-book with our unique Google optimized e-Paper software.
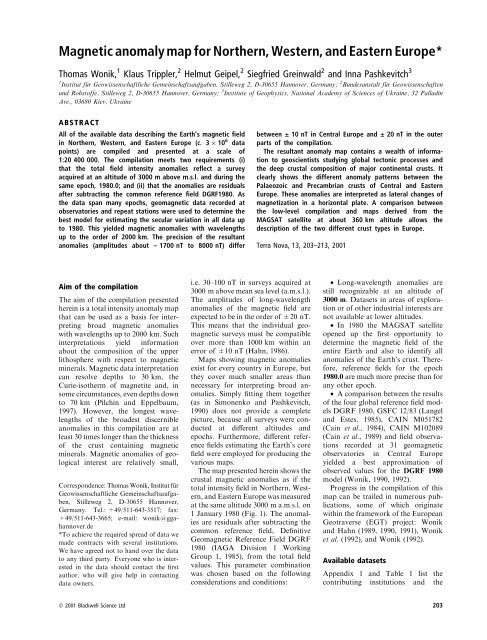
<st<strong>ro</strong>ng>Magnetic</st<strong>ro</strong>ng> <st<strong>ro</strong>ng>anomaly</st<strong>ro</strong>ng> <st<strong>ro</strong>ng>map</st<strong>ro</strong>ng> <st<strong>ro</strong>ng>for</st<strong>ro</strong>ng> <st<strong>ro</strong>ng>Northern</st<strong>ro</strong>ng>, <st<strong>ro</strong>ng>Western</st<strong>ro</strong>ng>, <st<strong>ro</strong>ng>and</st<strong>ro</strong>ng> Eastern Eu<strong>ro</strong>pe*<br />
Thomas Wonik, 1 Klaus Trippler, 2 Helmut Geipel, 2 Siegfried Greinwald 2 <st<strong>ro</strong>ng>and</st<strong>ro</strong>ng> Inna Pashkevitch 3<br />
1 Institut fuÈ r Geowissenschaftliche Gemeinschaftsaufgaben, Stilleweg 2, D-30655 Hannover, Germany; 2 Bundesanstalt fuÈ r Geowissenschaften<br />
und Rohstoffe, Stilleweg 2, D-30655 Hannover, Germany; 3 Institute of Geophysics, National Academy of Sciences of Ukraine, 32 Palladin<br />
Ave., 03680 Kiev, Ukraine<br />
ABSTRACT<br />
All of the available data describing the Earth's magnetic ®eld<br />
in <st<strong>ro</strong>ng>Northern</st<strong>ro</strong>ng>, <st<strong>ro</strong>ng>Western</st<strong>ro</strong>ng>, <st<strong>ro</strong>ng>and</st<strong>ro</strong>ng> Eastern Eu<strong>ro</strong>pe (c. 3 ´ 10 6 data<br />
points) are compiled <st<strong>ro</strong>ng>and</st<strong>ro</strong>ng> presented at a scale of<br />
1:20 400 000. The compilation meets two requirements (i)<br />
that the total ®eld intensity anomalies re¯ect a survey<br />
acquired at an altitude of 3000 m above m.s.l. <st<strong>ro</strong>ng>and</st<strong>ro</strong>ng> during the<br />
1 same epoch, 1980.0; <st<strong>ro</strong>ng>and</st<strong>ro</strong>ng> (ii) that the anomalies are residuals<br />
after subtracting the common reference ®eld DGRF1980. As<br />
the data span many epochs, <st<strong>ro</strong>ng>geo</st<strong>ro</strong>ng>magnetic data recorded at<br />
observatories <st<strong>ro</strong>ng>and</st<strong>ro</strong>ng> repeat stations were used to determine the<br />
best model <st<strong>ro</strong>ng>for</st<strong>ro</strong>ng> estimating the secular variation in all data up<br />
to 1980. This yielded magnetic anomalies with wavelengths<br />
up to the order of 2000 km. The precision of the resultant<br />
anomalies (amplitudes about ± 1700 nT to 8000 nT) differ<br />
between ‹ 10 nT in Central Eu<strong>ro</strong>pe <st<strong>ro</strong>ng>and</st<strong>ro</strong>ng> ‹ 20 nT in the outer<br />
parts of the compilation.<br />
The resultant <st<strong>ro</strong>ng>anomaly</st<strong>ro</strong>ng> <st<strong>ro</strong>ng>map</st<strong>ro</strong>ng> contains a wealth of in<st<strong>ro</strong>ng>for</st<strong>ro</strong>ng>mation<br />
to <st<strong>ro</strong>ng>geo</st<strong>ro</strong>ng>scientists studying global tectonic p<strong>ro</strong>cesses <st<strong>ro</strong>ng>and</st<strong>ro</strong>ng><br />
the deep crustal composition of major continental crusts. It<br />
clearly shows the different <st<strong>ro</strong>ng>anomaly</st<strong>ro</strong>ng> patterns between the<br />
Palaeozoic <st<strong>ro</strong>ng>and</st<strong>ro</strong>ng> Precambrian crusts of Central <st<strong>ro</strong>ng>and</st<strong>ro</strong>ng> Eastern<br />
Eu<strong>ro</strong>pe. These anomalies are interpreted as lateral changes of<br />
magnetization in a horizontal plate. A comparison between<br />
the low-level compilation <st<strong>ro</strong>ng>and</st<strong>ro</strong>ng> <st<strong>ro</strong>ng>map</st<strong>ro</strong>ng>s derived f<strong>ro</strong>m the<br />
MAGSAT satellite at about 360 km altitude allows the<br />
description of the two different crust types in Eu<strong>ro</strong>pe.<br />
Terra Nova, 13, 203±213, 2001<br />
Aim of the compilation<br />
The aim of the compilation presented<br />
herein is a total intensity <st<strong>ro</strong>ng>anomaly</st<strong>ro</strong>ng> <st<strong>ro</strong>ng>map</st<strong>ro</strong>ng><br />
that can be used as a basis <st<strong>ro</strong>ng>for</st<strong>ro</strong>ng> interpreting<br />
b<strong>ro</strong>ad magnetic anomalies<br />
with wavelengths up to 2000 km. Such<br />
interpretations yield in<st<strong>ro</strong>ng>for</st<strong>ro</strong>ng>mation<br />
about the composition of the upper<br />
lithosphere with respect to magnetic<br />
minerals. <st<strong>ro</strong>ng>Magnetic</st<strong>ro</strong>ng> data interpretation<br />
can resolve depths to 30 km, the<br />
Curie-isotherm of magnetite <st<strong>ro</strong>ng>and</st<strong>ro</strong>ng>, in<br />
some circumstances, even depths down<br />
to 70 km (Pilchin <st<strong>ro</strong>ng>and</st<strong>ro</strong>ng> Eppelbaum,<br />
1997). However, the longest wavelengths<br />
of the b<strong>ro</strong>adest discernible<br />
anomalies in this compilation are at<br />
least 30 times longer than the thickness<br />
of the crust containing magnetic<br />
minerals. <st<strong>ro</strong>ng>Magnetic</st<strong>ro</strong>ng> anomalies of <st<strong>ro</strong>ng>geo</st<strong>ro</strong>ng>logical<br />
interest are relatively small,<br />
Correspondence: Thomas Wonik, Institut fuÈ r<br />
Geowissenschaftliche Gemeinschaftsaufgaben,<br />
Stilleweg 2, D-30655 Hannover,<br />
Germany. Tel.: +49/511-643-3517; fax:<br />
+49/511-643-3665; e-mail: wonik@ggahannover.de<br />
*To achieve the required spread of data we<br />
made contracts with several institutions.<br />
We have agreed not to h<st<strong>ro</strong>ng>and</st<strong>ro</strong>ng> over the data<br />
to any third party. Everyone who is interested<br />
in the data should contact the ®rst<br />
author, who will give help in contacting<br />
data owners.<br />
i.e. 30±100 nT in surveys acquired at<br />
3000 m above mean sea level (a.m.s.l.).<br />
The amplitudes of long-wavelength<br />
anomalies of the magnetic ®eld are<br />
expected to be in the order of ‹20 nT.<br />
This means that the individual <st<strong>ro</strong>ng>geo</st<strong>ro</strong>ng>magnetic<br />
surveys must be compatible<br />
over more than 1000 km within an<br />
er<strong>ro</strong>r of ‹10 nT (Hahn, 1986).<br />
Maps showing magnetic anomalies<br />
exist <st<strong>ro</strong>ng>for</st<strong>ro</strong>ng> every country in Eu<strong>ro</strong>pe, but<br />
they cover much smaller areas than<br />
necessary <st<strong>ro</strong>ng>for</st<strong>ro</strong>ng> interpreting b<strong>ro</strong>ad anomalies.<br />
Simply ®tting them together<br />
(as in Simonenko <st<strong>ro</strong>ng>and</st<strong>ro</strong>ng> Pashkevitch,<br />
1990) does not p<strong>ro</strong>vide a complete<br />
picture, because all surveys were conducted<br />
at di€erent altitudes <st<strong>ro</strong>ng>and</st<strong>ro</strong>ng><br />
epochs. Furthermore, di€erent reference<br />
®elds estimating the Earth's core<br />
®eld were employed <st<strong>ro</strong>ng>for</st<strong>ro</strong>ng> p<strong>ro</strong>ducing the<br />
various <st<strong>ro</strong>ng>map</st<strong>ro</strong>ng>s.<br />
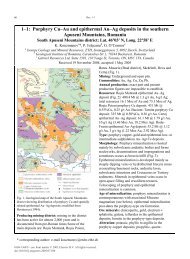
The <st<strong>ro</strong>ng>map</st<strong>ro</strong>ng> presented herein shows the<br />
crustal magnetic anomalies as if the<br />
total intensity ®eld in <st<strong>ro</strong>ng>Northern</st<strong>ro</strong>ng>, <st<strong>ro</strong>ng>Western</st<strong>ro</strong>ng>,<br />
<st<strong>ro</strong>ng>and</st<strong>ro</strong>ng> Eastern Eu<strong>ro</strong>pe was measured<br />
at the same altitude 3000 m a.m.s.l. on<br />
1 January 1980 (Fig. 1). The anomalies<br />
are residuals after subtracting the<br />
common reference ®eld, De®nitive<br />
Geomagnetic Reference Field DGRF<br />
1980 (IAGA Division 1 Working<br />
G<strong>ro</strong>up 1, 1985), f<strong>ro</strong>m the total ®eld<br />
values. This parameter combination<br />
was chosen based on the following<br />
considerations <st<strong>ro</strong>ng>and</st<strong>ro</strong>ng> conditions:<br />
· Long-wavelength anomalies are<br />
still recognizable at an altitude of<br />
3000 m. Datasets in areas of exploration<br />
or of other industrial interests are<br />
not available at lower altitudes.<br />
· In 1980 the MAGSAT satellite<br />
opened up the ®rst opportunity to<br />
determine the magnetic ®eld of the<br />
entire Earth <st<strong>ro</strong>ng>and</st<strong>ro</strong>ng> also to identify all<br />
anomalies of the Earth's crust. There<st<strong>ro</strong>ng>for</st<strong>ro</strong>ng>e,<br />
reference ®elds <st<strong>ro</strong>ng>for</st<strong>ro</strong>ng> the epoch<br />
1980.0 are much more precise than <st<strong>ro</strong>ng>for</st<strong>ro</strong>ng><br />
any other epoch.<br />
· A comparison between the results<br />
of the four global reference ®eld models<br />
DGRF 1980, GSFC 12/83 (Langel<br />
<st<strong>ro</strong>ng>and</st<strong>ro</strong>ng> Estes, 1985), CAIN M051782<br />
(Cain et al., 1984), CAIN M102089<br />
(Cain et al., 1989) <st<strong>ro</strong>ng>and</st<strong>ro</strong>ng> ®eld observations<br />
recorded at 31 <st<strong>ro</strong>ng>geo</st<strong>ro</strong>ng>magnetic<br />
observatories in Central Eu<strong>ro</strong>pe<br />
yielded a best app<strong>ro</strong>ximation of<br />
observed values <st<strong>ro</strong>ng>for</st<strong>ro</strong>ng> the DGRF 1980<br />
model (Wonik, 1990, 1992).<br />
P<strong>ro</strong>gress in the compilation of this<br />
<st<strong>ro</strong>ng>map</st<strong>ro</strong>ng> can be trailed in nume<strong>ro</strong>us publications,<br />
some of which originate<br />
within the framework of the Eu<strong>ro</strong>pean<br />
Geotraverse (EGT) p<strong>ro</strong>ject: Wonik<br />
<st<strong>ro</strong>ng>and</st<strong>ro</strong>ng> Hahn (1989, 1990, 1991), Wonik<br />
et al. (1992), <st<strong>ro</strong>ng>and</st<strong>ro</strong>ng> Wonik (1992).<br />
Available datasets<br />
Appendix 1 <st<strong>ro</strong>ng>and</st<strong>ro</strong>ng> Table 1 list the<br />
contributing institutions <st<strong>ro</strong>ng>and</st<strong>ro</strong>ng> the<br />
Ó 2001 Blackwell Science Ltd 203
<st<strong>ro</strong>ng>Magnetic</st<strong>ro</strong>ng> <st<strong>ro</strong>ng>anomaly</st<strong>ro</strong>ng> <st<strong>ro</strong>ng>map</st<strong>ro</strong>ng> · T. Wonik et al. Terra Nova, Vol 13, No. 3, 203±213<br />
.............................................................................................................................................................<br />
sources of all data used in the compilation.<br />
The key parameters <st<strong>ro</strong>ng>for</st<strong>ro</strong>ng> each<br />
dataset are also listed. The present<br />
authors have acquired <st<strong>ro</strong>ng>and</st<strong>ro</strong>ng> compiled<br />
datasets f<strong>ro</strong>m nume<strong>ro</strong>us organizations<br />
since 1986 in order to create a digital<br />
database of coherent magnetic observations.<br />
Many of the datasets used result<br />
f<strong>ro</strong>m surveys which were not only<br />
carried out at di€erent ¯ight altitudes<br />
<st<strong>ro</strong>ng>and</st<strong>ro</strong>ng> epochs, but also used di€erent<br />
co-ordinate systems, p<strong>ro</strong>®le spacings,<br />
instruments <st<strong>ro</strong>ng>and</st<strong>ro</strong>ng> p<strong>ro</strong>cessing. Moreover,<br />
the data were made available in<br />
a variety of <st<strong>ro</strong>ng>for</st<strong>ro</strong>ng>mats. In most cases the<br />
compilation was started with digital<br />
magnetic <st<strong>ro</strong>ng>anomaly</st<strong>ro</strong>ng> values of total<br />
intensity DF or vertical intensity DZ.<br />
Where raw data of surveys were not<br />
available, it was necessary to use<br />
values obtained by digitization of<br />
<st<strong>ro</strong>ng>map</st<strong>ro</strong>ng>s showing <st<strong>ro</strong>ng>anomaly</st<strong>ro</strong>ng> values. For<br />
surveys 10, 17, 18, 20, 22, 25, 30, <st<strong>ro</strong>ng>and</st<strong>ro</strong>ng><br />
31 (see Appendix 1) only <st<strong>ro</strong>ng>map</st<strong>ro</strong>ng>s scaled<br />
1:100 000±1:5 000 000 were available.<br />
Even punch cards (surveys 1 <st<strong>ro</strong>ng>and</st<strong>ro</strong>ng> 6)<br />
<st<strong>ro</strong>ng>and</st<strong>ro</strong>ng> lists taken f<strong>ro</strong>m publications (surveys<br />
11±13, 16, 26, 28, <st<strong>ro</strong>ng>and</st<strong>ro</strong>ng> 29) were<br />
used to amass the most complete<br />
dataset.<br />
Topographic elevation in<st<strong>ro</strong>ng>for</st<strong>ro</strong>ng>mation<br />
was required to compile surveys<br />
measured on the g<strong>ro</strong>und <st<strong>ro</strong>ng>and</st<strong>ro</strong>ng> airborne<br />
surveys carried out at constant<br />
g<strong>ro</strong>und clearance. Mean values estimated<br />
f<strong>ro</strong>m a <st<strong>ro</strong>ng>map</st<strong>ro</strong>ng> published by<br />
Schleusener (1959) were used <st<strong>ro</strong>ng>for</st<strong>ro</strong>ng><br />
surveys 3±5, 11±13, 16, 26, <st<strong>ro</strong>ng>and</st<strong>ro</strong>ng> 28±<br />
30, <st<strong>ro</strong>ng>and</st<strong>ro</strong>ng> are given in Appendix 1.<br />
Additionally, mean topographic<br />
heights <st<strong>ro</strong>ng>for</st<strong>ro</strong>ng> the Finnish survey were<br />
published by Mikkola (1983). A dataset<br />
comprising the heights of Norway<br />
<st<strong>ro</strong>ng>and</st<strong>ro</strong>ng> parts of Sweden in a 1-km<br />
grid was purchased f<strong>ro</strong>m the Norwegian<br />
Mapping Authority, while the<br />
British Geological Survey made available<br />
a detailed digital topographic<br />
dataset <st<strong>ro</strong>ng>for</st<strong>ro</strong>ng> Great Britain. For the<br />
Harz mountains area (Germany) a<br />
dataset comprising heights in a 70-m<br />
grid were given by the University of<br />
Clausthal-Zellerfeld, Germany.<br />
Appendix 1 also gives a list of the<br />
many reference ®elds used <st<strong>ro</strong>ng>for</st<strong>ro</strong>ng> the<br />
calculation of <st<strong>ro</strong>ng>anomaly</st<strong>ro</strong>ng> values. They<br />
vary f<strong>ro</strong>m polynomials (e.g. BGR,<br />
Fig. 1 Total magnetic <st<strong>ro</strong>ng>anomaly</st<strong>ro</strong>ng> <st<strong>ro</strong>ng>map</st<strong>ro</strong>ng> <st<strong>ro</strong>ng>for</st<strong>ro</strong>ng><br />
<st<strong>ro</strong>ng>Northern</st<strong>ro</strong>ng>, <st<strong>ro</strong>ng>Western</st<strong>ro</strong>ng> <st<strong>ro</strong>ng>and</st<strong>ro</strong>ng> Eastern Eu<strong>ro</strong>pe.<br />
1976), presentations in a <st<strong>ro</strong>ng>map</st<strong>ro</strong>ng> <st<strong>ro</strong>ng>for</st<strong>ro</strong>ng>m<br />
(e.g. GyoÈ rgy, 1966), special reference<br />
®elds published in papers (e.g.<br />
Galdeano et al., 1980), to global reference<br />
®elds such as DGRF or IGRF.<br />
A total of about 3 000 000 input<br />
magnetic data were used in this compilation.<br />
P<strong>ro</strong>c<st<strong>ro</strong>ng>edu</st<strong>ro</strong>ng>res <st<strong>ro</strong>ng>for</st<strong>ro</strong>ng> p<strong>ro</strong>cessing<br />
& merging the datasets<br />
Figure 2 shows the calculation steps<br />
necessary to obtain <st<strong>ro</strong>ng>anomaly</st<strong>ro</strong>ng> values at<br />
a common altitude of 3000 m a.m.s.l.<br />
<st<strong>ro</strong>ng>for</st<strong>ro</strong>ng> the epoch 1980.0. As an example,<br />
the p<strong>ro</strong>c<st<strong>ro</strong>ng>edu</st<strong>ro</strong>ng>re used to compute <st<strong>ro</strong>ng>anomaly</st<strong>ro</strong>ng><br />
values f<strong>ro</strong>m the southern part of<br />
the German airborne survey at<br />
1500 m a.m.s.l. <st<strong>ro</strong>ng>and</st<strong>ro</strong>ng> the epoch 1967.5<br />
is shown.<br />
Step 1: Values of total intensity F<br />
(1500 m 1967.5) are obtained by adding<br />
the `old' reference ®eld (quadratic<br />
Table 1 The institutions listed below p<strong>ro</strong>vided magnetic data <st<strong>ro</strong>ng>for</st<strong>ro</strong>ng> the compilation p<strong>ro</strong>ject<br />
Country Town Institution Contact<br />
Austria Vienna Geologische Bundesanstalt GATTINGER, T. & EICHBERGER, H.<br />
Vienna Institut fuÈ r Meteo<strong>ro</strong>logie und Geophysik der UniversitaÈ t Wien GUTDEUTSCH, R. & SEIBERL, W.<br />
Canada Dartmouth Geological Survey of Canada MACNAB, R.<br />
Denmark Copenhagen Danish Meteo<strong>ro</strong>logical Institute LAURIDSEN, E.K.<br />
Copenhagen Geological Survey of Denmark DINESEN, A. & HANSEN, C.F.<br />
Finl<st<strong>ro</strong>ng>and</st<strong>ro</strong>ng> Espoo Geological Survey of Finl<st<strong>ro</strong>ng>and</st<strong>ro</strong>ng> KORHONEN, J. & KORPELA, K.<br />
France Paris Centre National de la Recherche Scienti®que<br />
Paris<br />
Institut National d'Ast<strong>ro</strong>nomie et de GeÂophysique<br />
Paris Institut de Physique du Globe GALDEANO, A.<br />
Former GDR Berlin Heinrich-Hertz-Institut fuÈ r AtmosphaÈren<st<strong>ro</strong>ng>for</st<strong>ro</strong>ng>schung und Geomagnetismus MUNDT, W.<br />
Leipzig Geophysik GGD Leipzig SCHEIBE, R. & LINDNER, H.<br />
Germany Hamburg Deutsches Hyd<strong>ro</strong>graphisches Institut VOPPEL, D.<br />
Hannover Bundesanstalt fuÈ r Geowissenschaften und Rohstoffe SENGPIEL, K.P. & BOSUM, W.<br />
Hannover Institut fuÈ r Geowissenschaftliche Gemeinschaftsaufgaben Hannover PUCHER, R.<br />
Hannover<br />
NiedersaÈ chsisches L<st<strong>ro</strong>ng>and</st<strong>ro</strong>ng>esamt fuÈ r Boden<st<strong>ro</strong>ng>for</st<strong>ro</strong>ng>schung<br />
Clausthal-Zellerfeld University of Clausthal-Zellerfeld<br />
Great Britain Keyworth British Geological Survey LEE, M. & SMITH, I.F.<br />
Irel<st<strong>ro</strong>ng>and</st<strong>ro</strong>ng> Dublin Geological Survey of Irel<st<strong>ro</strong>ng>and</st<strong>ro</strong>ng> INAMDAR, D.<br />
Dublin Pet<strong>ro</strong>leum Affairs Division CROKER, P.<br />
Galway National University of Irel<st<strong>ro</strong>ng>and</st<strong>ro</strong>ng> MURPHY, C. & BROCK, A.<br />
Luxembourg Luxembourg Service GeÂologique Luxembourg BINTZ, J.<br />
The Netherl<st<strong>ro</strong>ng>and</st<strong>ro</strong>ng>s Utrecht University of Utrecht COLLETTE, B.J.<br />
Norway T<strong>ro</strong>ndheim Geological Survey of Norway HAÊ BREKKE, H.<br />
Pol<st<strong>ro</strong>ng>and</st<strong>ro</strong>ng> Warsaw Polish Geological Institute WYBRANIEC, S.<br />
Sweden Stockholm Svenska Pet<strong>ro</strong>leum Exploration AB LINDER, F. & STROÈ M, R.G.<br />
Uppsala Geological Survey of Sweden BORG, K. & HOLDAR, B.<br />
Switzerl<st<strong>ro</strong>ng>and</st<strong>ro</strong>ng> Zurich Schweizerische Geophysikalische Kommission KLINGELE, E.<br />
204 Ó 2001 Blackwell Science Ltd
Terra Nova, Vol 13, No. 3, 203±213<br />
T. Wonik et al. · <st<strong>ro</strong>ng>Magnetic</st<strong>ro</strong>ng> <st<strong>ro</strong>ng>anomaly</st<strong>ro</strong>ng> <st<strong>ro</strong>ng>map</st<strong>ro</strong>ng><br />
.............................................................................................................................................................<br />
Fig. 2 P<strong>ro</strong>c<st<strong>ro</strong>ng>edu</st<strong>ro</strong>ng>re <st<strong>ro</strong>ng>for</st<strong>ro</strong>ng> converting <st<strong>ro</strong>ng>anomaly</st<strong>ro</strong>ng> values f<strong>ro</strong>m the southern part of Germany<br />
to a common altitude of 3000 m a.m.s.l. <st<strong>ro</strong>ng>and</st<strong>ro</strong>ng> epoch 1980.0.<br />
polynomial) used <st<strong>ro</strong>ng>for</st<strong>ro</strong>ng> p<strong>ro</strong>ducing the<br />
<st<strong>ro</strong>ng>anomaly</st<strong>ro</strong>ng> <st<strong>ro</strong>ng>map</st<strong>ro</strong>ng> (BGR, 1976) to the<br />
<st<strong>ro</strong>ng>anomaly</st<strong>ro</strong>ng> values of the <st<strong>ro</strong>ng>map</st<strong>ro</strong>ng> DF<br />
(1500 m, 1967.5).<br />
Step 2: To trans<st<strong>ro</strong>ng>for</st<strong>ro</strong>ng>m the F-values to<br />
the epoch 1980.0, a representation of<br />
secular variation (here: 1967.5±1980.0)<br />
in the area under consideration is<br />
necessary.<br />
Global reference ®elds describe the<br />
magnetic ®eld <st<strong>ro</strong>ng>and</st<strong>ro</strong>ng> its secular variation<br />
ac<strong>ro</strong>ss the Earth as a whole. The<br />
International Association of Geomagnetism<br />
<st<strong>ro</strong>ng>and</st<strong>ro</strong>ng> Ae<strong>ro</strong>nomy (IAGA) tries to<br />
consider the magnetic ®eld variations<br />
by publishing a new model of the<br />
DGRF every ®ve years (DGRF 1965,<br />
DGRF 1970,¼). Because the focus<br />
here is Eu<strong>ro</strong>pe, it is obvious that data<br />
f<strong>ro</strong>m <st<strong>ro</strong>ng>geo</st<strong>ro</strong>ng>magnetic observatories <st<strong>ro</strong>ng>and</st<strong>ro</strong>ng><br />
repeat stations are more detailed <st<strong>ro</strong>ng>and</st<strong>ro</strong>ng><br />
realistic than computed values f<strong>ro</strong>m a<br />
global reference ®eld model.<br />
For the epochs 1965.0 <st<strong>ro</strong>ng>and</st<strong>ro</strong>ng> 1982.5,<br />
Wonik <st<strong>ro</strong>ng>and</st<strong>ro</strong>ng> Hahn (1988) compared the<br />
results of 10 Central Eu<strong>ro</strong>pean observatories<br />
(Golovkov et al., 1983) <st<strong>ro</strong>ng>and</st<strong>ro</strong>ng> 78<br />
repeat stations in Germany (Voppel<br />
<st<strong>ro</strong>ng>and</st<strong>ro</strong>ng> Wienert, 1974; Schulz et al., 1997)<br />
<st<strong>ro</strong>ng>and</st<strong>ro</strong>ng> France (e.g. Gilbert <st<strong>ro</strong>ng>and</st<strong>ro</strong>ng> Le Mouel,<br />
1984) with the ®eld values computed<br />
f<strong>ro</strong>m the reference ®elds DGRF 1980<br />
<st<strong>ro</strong>ng>and</st<strong>ro</strong>ng> DGRF 1965 at these sites. The<br />
data f<strong>ro</strong>m the observatories <st<strong>ro</strong>ng>and</st<strong>ro</strong>ng> repeat<br />
stations show a secular variation<br />
(1965.0±1982.5) of 475 nT <st<strong>ro</strong>ng>for</st<strong>ro</strong>ng> southern<br />
Germany <st<strong>ro</strong>ng>and</st<strong>ro</strong>ng> of 530 nT <st<strong>ro</strong>ng>for</st<strong>ro</strong>ng> northern<br />
Germany. The secular variation<br />
computed f<strong>ro</strong>m the differences between<br />
DGRF 1980 <st<strong>ro</strong>ng>and</st<strong>ro</strong>ng> DGRF 1965<br />
varies f<strong>ro</strong>m 500 to 525 nT. A difference<br />
of about 30 nT (± 25 nT to + 5 nT)<br />
over a period of 17.5 years is observed<br />
between the results of the two methods<br />
of calculating secular variation within<br />
a distance of about 1000 km. Coles<br />
(1979) made similar investigations <st<strong>ro</strong>ng>for</st<strong>ro</strong>ng><br />
Canada <st<strong>ro</strong>ng>and</st<strong>ro</strong>ng> obtained maximal er<strong>ro</strong>rs<br />
of 50 nT yr ±1 in secular variation <st<strong>ro</strong>ng>for</st<strong>ro</strong>ng><br />
several reference ®elds.<br />
Secular variations were estimated in<br />
this compilation by calculating a<br />
quadratic polynomial <st<strong>ro</strong>ng>for</st<strong>ro</strong>ng> the whole<br />
of Eu<strong>ro</strong>pe using <st<strong>ro</strong>ng>geo</st<strong>ro</strong>ng>magnetic observatory<br />
data (Golovkov et al., 1983).<br />
Different quadratic polynomials are<br />
calculated <st<strong>ro</strong>ng>for</st<strong>ro</strong>ng> surveys referred to<br />
other epochs. These are based on the<br />
above-mentioned sources or the annual<br />
mean values published by the<br />
Eu<strong>ro</strong>pean <st<strong>ro</strong>ng>geo</st<strong>ro</strong>ng>magnetic observatories<br />
(e.g. IPGP, 1987).<br />
Step 3: The De®nitive Geomagnetic<br />
Reference Field `DGRF 1980', altitude<br />
1500 m, epoch 1980.0 (IAGA<br />
Division Working G<strong>ro</strong>up 1, 1985) is<br />
subtracted.<br />
The determination of a reference<br />
core ®eld is necessary, although somewhat<br />
arbitrary. This is because its<br />
spectrum partially overlaps the spectrum<br />
of the crustal ®eld. Because<br />
sources in both the crust <st<strong>ro</strong>ng>and</st<strong>ro</strong>ng> core are<br />
unknown, the two components are<br />
impossible to separate <st<strong>ro</strong>ng>and</st<strong>ro</strong>ng> the shape<br />
of the magnetic anomalies depends on<br />
the reference ®eld <st<strong>ro</strong>ng>and</st<strong>ro</strong>ng> its truncation<br />
level. It should be noted, however, that<br />
even the use of di€erent DGRF models<br />
causes varying anomalies at the<br />
same location (Pucher <st<strong>ro</strong>ng>and</st<strong>ro</strong>ng> Wonik,<br />
22001). Four reference ®elds were<br />
examined by Wonik (1990 <st<strong>ro</strong>ng>and</st<strong>ro</strong>ng> 1992):<br />
DGRF 1980, GSFC 12/83 (Langel <st<strong>ro</strong>ng>and</st<strong>ro</strong>ng><br />
Estes, 1985), CAIN M051782 (Cain<br />
et al., 1984) <st<strong>ro</strong>ng>and</st<strong>ro</strong>ng> CAIN M102089<br />
(Cain et al., 1989). The mean values<br />
of 31 Eu<strong>ro</strong>pean observatories were<br />
compared with the mean values calculated<br />
using the four reference ®eld<br />
models <st<strong>ro</strong>ng>for</st<strong>ro</strong>ng> the same locations <st<strong>ro</strong>ng>and</st<strong>ro</strong>ng><br />
epochs. The differences between these<br />
<st<strong>ro</strong>ng>and</st<strong>ro</strong>ng> the DGRF 1980 model p<strong>ro</strong>ved to<br />
be minimal <st<strong>ro</strong>ng>for</st<strong>ro</strong>ng> Eu<strong>ro</strong>pe <st<strong>ro</strong>ng>and</st<strong>ro</strong>ng> there<st<strong>ro</strong>ng>for</st<strong>ro</strong>ng>e,<br />
DGRF 1980 was selected as the<br />
app<strong>ro</strong>priate reference model.<br />
Step 4: The anomalies DF (1500 m,<br />
1980.0) are upward-continued to<br />
3000 m using an algorithm published<br />
by Gibert <st<strong>ro</strong>ng>and</st<strong>ro</strong>ng> Galdeano (1985).<br />
A comparison between Gibert <st<strong>ro</strong>ng>and</st<strong>ro</strong>ng><br />
Galdeano (1985)'s algorithm <st<strong>ro</strong>ng>and</st<strong>ro</strong>ng><br />
three further methods of upward continuation<br />
published by Hahn (1965),<br />
Hartmann (1963), <st<strong>ro</strong>ng>and</st<strong>ro</strong>ng> Rudman <st<strong>ro</strong>ng>and</st<strong>ro</strong>ng><br />
Blakely (1975) results in only slight<br />
di€erences (Wonik, 1992) at grid margins.<br />
The algorithm of Gibert <st<strong>ro</strong>ng>and</st<strong>ro</strong>ng><br />
Galdeano (1985) was chosen because<br />
of its ability to h<st<strong>ro</strong>ng>and</st<strong>ro</strong>ng>le large datasets in<br />
one run, thus minimizing the amount<br />
of er<strong>ro</strong>r at grid margins.<br />
For those areas where measurements<br />
were carried out at constant<br />
g<strong>ro</strong>und clearance ± as was the case in<br />
most parts of Norway, Finl<st<strong>ro</strong>ng>and</st<strong>ro</strong>ng>, Sweden<br />
north of 66°N, Irel<st<strong>ro</strong>ng>and</st<strong>ro</strong>ng>, <st<strong>ro</strong>ng>and</st<strong>ro</strong>ng> Great<br />
Britain ± the method published by<br />
Grauch (1984) <st<strong>ro</strong>ng>and</st<strong>ro</strong>ng> applied by Cordell<br />
<st<strong>ro</strong>ng>and</st<strong>ro</strong>ng> Grauch (1985) was used. The<br />
method is based on a Taylor series<br />
algorithm <st<strong>ro</strong>ng>and</st<strong>ro</strong>ng> allows the upward<br />
continuation of data measured on an<br />
irregular surface to a horizontal plain.<br />
The topographic elevations in the<br />
Harz mountain area in Germany<br />
show di€erences between 250 m <st<strong>ro</strong>ng>and</st<strong>ro</strong>ng><br />
850 m a.m.s.l. There<st<strong>ro</strong>ng>for</st<strong>ro</strong>ng>e, an airborne<br />
survey (survey 2 in Appendix 1) was<br />
conducted resulting in anomalies of<br />
total intensity at 50 m above the<br />
g<strong>ro</strong>und. These data were upward-continued<br />
to 3000 m using the algorithm<br />
of Gibert <st<strong>ro</strong>ng>and</st<strong>ro</strong>ng> Galdeano (1985) <st<strong>ro</strong>ng>and</st<strong>ro</strong>ng><br />
assuming a mean altitude of the Harz<br />
mountains of 400 m. For comparison<br />
the same dataset was upward-continued<br />
to 3000 m using the Grauch<br />
(1984)'s algorithm. The resulting<br />
<st<strong>ro</strong>ng>anomaly</st<strong>ro</strong>ng> patterns clearly di€er. The<br />
maximal di€erence in <st<strong>ro</strong>ng>anomaly</st<strong>ro</strong>ng> amplitude<br />
is about 15%, which cannot be<br />
ignored in terms of long-wavelength<br />
anomalies. There<st<strong>ro</strong>ng>for</st<strong>ro</strong>ng>e, <st<strong>ro</strong>ng>for</st<strong>ro</strong>ng> the ®nal<br />
dataset, the data measured at constant<br />
g<strong>ro</strong>und clearance were upward-continued<br />
using the Grauch's (1984)<br />
p<strong>ro</strong>gram.<br />
Ó 2001 Blackwell Science Ltd 205
<st<strong>ro</strong>ng>Magnetic</st<strong>ro</strong>ng> <st<strong>ro</strong>ng>anomaly</st<strong>ro</strong>ng> <st<strong>ro</strong>ng>map</st<strong>ro</strong>ng> · T. Wonik et al. Terra Nova, Vol 13, No. 3, 203±213<br />
.............................................................................................................................................................<br />
Be<st<strong>ro</strong>ng>for</st<strong>ro</strong>ng>e upward-continuing the<br />
DF-data, the data were trans<st<strong>ro</strong>ng>for</st<strong>ro</strong>ng>med<br />
onto a rectangular kilometric grid.<br />
The Lambert con<st<strong>ro</strong>ng>for</st<strong>ro</strong>ng>mal conic p<strong>ro</strong>jection<br />
with a central meridian of 20°N<br />
<st<strong>ro</strong>ng>and</st<strong>ro</strong>ng> st<st<strong>ro</strong>ng>and</st<strong>ro</strong>ng>ard parallels 30°N <st<strong>ro</strong>ng>and</st<strong>ro</strong>ng> 60°N<br />
was chosen. The p<strong>ro</strong>jection allows a<br />
direct comparison between the magnetic<br />
anomalies <st<strong>ro</strong>ng>and</st<strong>ro</strong>ng> the International<br />
Tectonic Map of Eu<strong>ro</strong>pe (Bogdanov<br />
et al., 1973). Data with Gauss±KruÈ ger<br />
or UTM co-ordinates were ®rst trans<st<strong>ro</strong>ng>for</st<strong>ro</strong>ng>med<br />
into <st<strong>ro</strong>ng>geo</st<strong>ro</strong>ng>graphical co-ordinates<br />
using an algorithm published by G<strong>ro</strong>ssmann<br />
(1964), <st<strong>ro</strong>ng>and</st<strong>ro</strong>ng> those with Swiss<br />
rectangular kilometric co-ordinates<br />
were converted into <st<strong>ro</strong>ng>geo</st<strong>ro</strong>ng>graphical<br />
co-ordinates using Bolliger (1967).<br />
These <st<strong>ro</strong>ng>geo</st<strong>ro</strong>ng>graphical co-ordinates<br />
were then trans<st<strong>ro</strong>ng>for</st<strong>ro</strong>ng>med into Lambert<br />
co-ordinates using Snyder (1987).<br />
All data were gridded using the<br />
UNIRAS interpolation sub<strong>ro</strong>utine<br />
GINTP1. The grid spacing was adjusted<br />
to the respective p<strong>ro</strong>®le spacing<br />
<st<strong>ro</strong>ng>and</st<strong>ro</strong>ng> varied between 0.2 km <st<strong>ro</strong>ng>and</st<strong>ro</strong>ng> 10 km.<br />
The <st<strong>ro</strong>ng>map</st<strong>ro</strong>ng>: p<strong>ro</strong>duction <st<strong>ro</strong>ng>and</st<strong>ro</strong>ng> precision<br />
The ®nal dataset is gridded at 5 km<br />
<st<strong>ro</strong>ng>and</st<strong>ro</strong>ng> presented at a scale of<br />
1:20 400 000 (see ¯yout). The ®nal<br />
grid comprises a 1351 ´ 891 matrix<br />
58% ®lled with data <st<strong>ro</strong>ng>and</st<strong>ro</strong>ng> with a mean<br />
value of 16 ‹ 176 nT. The values<br />
vary between ± 1689 nT <st<strong>ro</strong>ng>and</st<strong>ro</strong>ng><br />
8036 nT.<br />
The grid node distance of 5 km<br />
corresponds to 0.5 mm on the<br />
<st<strong>ro</strong>ng>map</st<strong>ro</strong>ng>. Contouring <st<strong>ro</strong>ng>and</st<strong>ro</strong>ng> shading was<br />
per<st<strong>ro</strong>ng>for</st<strong>ro</strong>ng>med with the sub<strong>ro</strong>utines<br />
GCRN2V <st<strong>ro</strong>ng>and</st<strong>ro</strong>ng> GCRN2S. The contour<br />
interval is 50 nT. However, below<br />
± 400 nT <st<strong>ro</strong>ng>and</st<strong>ro</strong>ng> above + 400 nT the<br />
interval is 100 nT. The 27-colour scale<br />
is quasi-logarithmic to show anomalies<br />
in areas without st<strong>ro</strong>ng gradients.<br />
About 70% of the ®nal p<strong>ro</strong>cessed<br />
anomalies meet the requirement that<br />
the values of two adjoining surveys<br />
di€er by less than 10 nT in the overlapping<br />
area. For some parts of the<br />
compiled area, er<strong>ro</strong>rs increase but<br />
they do not exceed 20 nT. This decrease<br />
in precision occurs <st<strong>ro</strong>ng>for</st<strong>ro</strong>ng> the<br />
following reasons.<br />
· Seven datasets comprise surveys<br />
with only wide-spaced p<strong>ro</strong>®les or large<br />
data spacings. Ae<strong>ro</strong>magnetic data<br />
measured on p<strong>ro</strong>®les 35 km apart<br />
had to be used <st<strong>ro</strong>ng>for</st<strong>ro</strong>ng> Central <st<strong>ro</strong>ng>and</st<strong>ro</strong>ng> Southern<br />
Sweden (survey 24). The shipborne<br />
survey of the Dutch North Sea<br />
(14) was carried out with a p<strong>ro</strong>®le<br />
spacing of 20 km. For Belgium, the<br />
<st<strong>ro</strong>ng>for</st<strong>ro</strong>ng>mer Czechoslovakia,Hungary, The<br />
Netherl<st<strong>ro</strong>ng>and</st<strong>ro</strong>ng>s, <st<strong>ro</strong>ng>and</st<strong>ro</strong>ng> Romania, only irregularly<br />
distributed g<strong>ro</strong>und measurements<br />
with mean data spacings of<br />
about 6±20 km measurements were<br />
available.<br />
· For some parts of Belgium, the<br />
<st<strong>ro</strong>ng>for</st<strong>ro</strong>ng>mer Czechoslovakia, small parts of<br />
<st<strong>ro</strong>ng>Western</st<strong>ro</strong>ng> Germany (surveys 3±5), Hungary,<br />
The Netherl<st<strong>ro</strong>ng>and</st<strong>ro</strong>ng>s, <st<strong>ro</strong>ng>and</st<strong>ro</strong>ng> Romania<br />
no topographic elevation data were<br />
available. Mean altitudes had to be<br />
estimated, which cause a decrease in<br />
precision, especially in areas with<br />
higher gradients in elevation.<br />
· The airborne data <st<strong>ro</strong>ng>for</st<strong>ro</strong>ng> onshore<br />
<st<strong>ro</strong>ng>and</st<strong>ro</strong>ng> o€shore Denmark (surveys 17<br />
<st<strong>ro</strong>ng>and</st<strong>ro</strong>ng> 18, acquired in 1963) were<br />
obtained with a ¯uxgate magnetometer,<br />
which in 1963 measured only<br />
relative values <st<strong>ro</strong>ng>and</st<strong>ro</strong>ng> showed large<br />
drifts. Results f<strong>ro</strong>m a g<strong>ro</strong>und survey<br />
(survey 16) could be used to adjust<br />
<st<strong>ro</strong>ng>and</st<strong>ro</strong>ng> to imp<strong>ro</strong>ve the precision of these<br />
data.<br />
· The datasets available <st<strong>ro</strong>ng>for</st<strong>ro</strong>ng> Eastern<br />
Germany, Great Britain, Irel<st<strong>ro</strong>ng>and</st<strong>ro</strong>ng>,<br />
Pol<st<strong>ro</strong>ng>and</st<strong>ro</strong>ng>, <st<strong>ro</strong>ng>and</st<strong>ro</strong>ng> the <st<strong>ro</strong>ng>for</st<strong>ro</strong>ng>mer USSR (27,<br />
32±36) are already amalgamations of<br />
various surveys conducted <st<strong>ro</strong>ng>for</st<strong>ro</strong>ng> only<br />
parts of the respective country. These<br />
surveys vary in their parameters like<br />
epoch, p<strong>ro</strong>®le spacing, <st<strong>ro</strong>ng>and</st<strong>ro</strong>ng> altitude.<br />
The p<strong>ro</strong>cessing methods used <st<strong>ro</strong>ng>for</st<strong>ro</strong>ng> the<br />
compilation of these surveys are partly<br />
unknown <st<strong>ro</strong>ng>and</st<strong>ro</strong>ng> possible distortions in<br />
terms of long-wavelength anomalies<br />
cannot be eliminated.<br />
Owing to the great hete<strong>ro</strong>geneity of<br />
the datasets, not all parts of the<br />
compilation reach its aim of resolving<br />
the long-wavelength component of the<br />
magnetic ®eld. The data presented <st<strong>ro</strong>ng>for</st<strong>ro</strong>ng><br />
Austria, Finl<st<strong>ro</strong>ng>and</st<strong>ro</strong>ng>, France, Germany,<br />
Luxembourg, Norway, <st<strong>ro</strong>ng>Northern</st<strong>ro</strong>ng> Fennosc<st<strong>ro</strong>ng>and</st<strong>ro</strong>ng>ia,<br />
<st<strong>ro</strong>ng>and</st<strong>ro</strong>ng> Switzerl<st<strong>ro</strong>ng>and</st<strong>ro</strong>ng> are of best<br />
quality in terms of long wavelength<br />
<st<strong>ro</strong>ng>anomaly</st<strong>ro</strong>ng> detection. Such anomalies<br />
with amplitudes smaller than 10 nT<br />
should be detected in this area. However,<br />
distortions inherent in the datasets<br />
f<strong>ro</strong>m Belgium, the <st<strong>ro</strong>ng>for</st<strong>ro</strong>ng>mer<br />
Czechoslovakia, Hungary, The Netherl<st<strong>ro</strong>ng>and</st<strong>ro</strong>ng>s,<br />
<st<strong>ro</strong>ng>and</st<strong>ro</strong>ng> Romania lead to a<br />
decrease in data precision to 20 nT.<br />
All of the other datasets not mentioned<br />
are of medium quality.<br />
Interpretation of the magnetic<br />
anomalies<br />
The <st<strong>ro</strong>ng>map</st<strong>ro</strong>ng> contains a wealth of in<st<strong>ro</strong>ng>for</st<strong>ro</strong>ng>mation<br />
useful to <st<strong>ro</strong>ng>geo</st<strong>ro</strong>ng>scientists studying<br />
global tectonic p<strong>ro</strong>cesses <st<strong>ro</strong>ng>and</st<strong>ro</strong>ng> the deep<br />
crustal composition of major continental<br />
cratons.<br />
This compilation enables comparison<br />
between the nature of the anomalous<br />
magnetic ®eld <st<strong>ro</strong>ng>and</st<strong>ro</strong>ng> <st<strong>ro</strong>ng>geo</st<strong>ro</strong>ng>logical<br />
mega-structures. It will bene®t international<br />
p<strong>ro</strong>jects such as EURO-<br />
PROBE <st<strong>ro</strong>ng>and</st<strong>ro</strong>ng> their subp<strong>ro</strong>jects TESZ,<br />
Uralides, <st<strong>ro</strong>ng>and</st<strong>ro</strong>ng> Eu<strong>ro</strong>bridge or the<br />
Palaeozoic Amalgamation of Central<br />
Eu<strong>ro</strong>pe (PACE network), in that it<br />
may lead to a better underst<st<strong>ro</strong>ng>and</st<strong>ro</strong>ng>ing of<br />
amalgamation p<strong>ro</strong>cesses of terranes to<br />
the East Eu<strong>ro</strong>pean Craton <st<strong>ro</strong>ng>and</st<strong>ro</strong>ng> the<br />
structure <st<strong>ro</strong>ng>and</st<strong>ro</strong>ng> evolution of the Uralide<br />
o<strong>ro</strong>gen.<br />
A lot of studies have revealed the<br />
good correlation between magnetic<br />
anomalies <st<strong>ro</strong>ng>and</st<strong>ro</strong>ng> tectonic structures on<br />
a regional scale. The results of these<br />
studies are not repeated here, but the<br />
most important are:<br />
· <st<strong>ro</strong>ng>for</st<strong>ro</strong>ng> the crystalline <strong>ro</strong>cks of Sc<st<strong>ro</strong>ng>and</st<strong>ro</strong>ng>inavia:<br />
Henkel et al. (1986, 1990),<br />
Eriksson <st<strong>ro</strong>ng>and</st<strong>ro</strong>ng> Henkel (1980) <st<strong>ro</strong>ng>and</st<strong>ro</strong>ng><br />
Riddihough (1972);<br />
· <st<strong>ro</strong>ng>for</st<strong>ro</strong>ng> The East Eu<strong>ro</strong>pean Plat<st<strong>ro</strong>ng>for</st<strong>ro</strong>ng>m:<br />
Bogdanova et al. (1996), Orlyuk <st<strong>ro</strong>ng>and</st<strong>ro</strong>ng><br />
Pashkevich (1996), <st<strong>ro</strong>ng>and</st<strong>ro</strong>ng> Pashkevich<br />
et al. 1990, 1997);<br />
· <st<strong>ro</strong>ng>for</st<strong>ro</strong>ng> the Palaeozoic plat<st<strong>ro</strong>ng>for</st<strong>ro</strong>ng>m of<br />
Central Eu<strong>ro</strong>pe: Bosum <st<strong>ro</strong>ng>and</st<strong>ro</strong>ng> Wonik<br />
(1991); <st<strong>ro</strong>ng>and</st<strong>ro</strong>ng><br />
· <st<strong>ro</strong>ng>for</st<strong>ro</strong>ng> the Trans-Eu<strong>ro</strong>pean Suture<br />
Zone between the Palaeozoic plat<st<strong>ro</strong>ng>for</st<strong>ro</strong>ng>m<br />
of Central Eu<strong>ro</strong>pe <st<strong>ro</strong>ng>and</st<strong>ro</strong>ng> the Precambrian<br />
plat<st<strong>ro</strong>ng>for</st<strong>ro</strong>ng>m of Eastern Eu<strong>ro</strong>pe:<br />
Dab<strong>ro</strong>wski et al. (1984), Pashkevich<br />
3 et al. (1989), Grabowska <st<strong>ro</strong>ng>and</st<strong>ro</strong>ng> Dolnicki<br />
(1994), <st<strong>ro</strong>ng>and</st<strong>ro</strong>ng> Thybo et al. (1999).<br />
Wonik (1992) interpreted Eu<strong>ro</strong>pean<br />
magnetic anomalies by considering<br />
lateral changes of magnetization. He<br />
used an algorithm int<strong>ro</strong>duced by<br />
Hahn (1965 <st<strong>ro</strong>ng>and</st<strong>ro</strong>ng> 1985) that computes<br />
the distribution of magnetization in a<br />
horizontal plate by means of 2D<br />
Fourier analysis. He was able to<br />
predict di€erences between the Precambrian<br />
<st<strong>ro</strong>ng>and</st<strong>ro</strong>ng> Palaeozoic crust within<br />
Eu<strong>ro</strong>pe. The p<strong>ro</strong>duct `magnetization<br />
(A/m) times thickness of the crust<br />
(km)' is on average 80 kA <st<strong>ro</strong>ng>for</st<strong>ro</strong>ng> the<br />
Precambrian <st<strong>ro</strong>ng>and</st<strong>ro</strong>ng> 35 kA <st<strong>ro</strong>ng>for</st<strong>ro</strong>ng> the<br />
Palaeozoic crust.<br />
206 Ó 2001 Blackwell Science Ltd
Terra Nova, Vol 13, No. 3, 203±213<br />
Assuming that magnetic sources are<br />
only present in that part of the crust<br />
between the Moho <st<strong>ro</strong>ng>and</st<strong>ro</strong>ng> the unde<st<strong>ro</strong>ng>for</st<strong>ro</strong>ng>med<br />
sediments, we determined a<br />
mean thickness <st<strong>ro</strong>ng>and</st<strong>ro</strong>ng> magnetization<br />
<st<strong>ro</strong>ng>for</st<strong>ro</strong>ng> the Precambrian <st<strong>ro</strong>ng>and</st<strong>ro</strong>ng> Palaeozoic<br />
Eu<strong>ro</strong>pe. The results indicate a mean<br />
thickness of 40 km <st<strong>ro</strong>ng>for</st<strong>ro</strong>ng> the magnetized<br />
crust with a mean magnetization of<br />
2.0 A/m <st<strong>ro</strong>ng>for</st<strong>ro</strong>ng> the Precambrian vs.<br />
23 km <st<strong>ro</strong>ng>and</st<strong>ro</strong>ng> 1.5 A/m <st<strong>ro</strong>ng>for</st<strong>ro</strong>ng> the Palaeozoic<br />
Eu<strong>ro</strong>pe. For the Precambrian crust<br />
<strong>ro</strong>ck magnetic investigations by Krutikhovskaya<br />
et al. (1980) show a great<br />
variability in magnetization between 0<br />
<st<strong>ro</strong>ng>and</st<strong>ro</strong>ng> 4 A/m. Moho depths <st<strong>ro</strong>ng>and</st<strong>ro</strong>ng> thickness<br />
of the unde<st<strong>ro</strong>ng>for</st<strong>ro</strong>ng>med sediments are<br />
taken f<strong>ro</strong>m Hurtig et al. (1992). The<br />
difference in magnetic <st<strong>ro</strong>ng>anomaly</st<strong>ro</strong>ng> pattern<br />
between Eastern <st<strong>ro</strong>ng>and</st<strong>ro</strong>ng> Central<br />
Eu<strong>ro</strong>pe can there<st<strong>ro</strong>ng>for</st<strong>ro</strong>ng>e be explained by<br />
a variable crustal thickness <st<strong>ro</strong>ng>and</st<strong>ro</strong>ng> magnetization.<br />
T. Wonik et al. · <st<strong>ro</strong>ng>Magnetic</st<strong>ro</strong>ng> <st<strong>ro</strong>ng>anomaly</st<strong>ro</strong>ng> <st<strong>ro</strong>ng>map</st<strong>ro</strong>ng><br />
.............................................................................................................................................................<br />
Comparison of magnetic anomalies<br />
between the `low-level'<br />
compilation & MAGSAT data<br />
A number of magnetic <st<strong>ro</strong>ng>anomaly</st<strong>ro</strong>ng> <st<strong>ro</strong>ng>map</st<strong>ro</strong>ng>s<br />
<st<strong>ro</strong>ng>for</st<strong>ro</strong>ng> Eu<strong>ro</strong>pe p<strong>ro</strong>duced f<strong>ro</strong>m the MAG-<br />
SAT satellite data (c. 360±500 km<br />
altitude) were published by various<br />
investigators: Coles et al. (1982), Cain<br />
et al. (1984), De Santis et al. (1989),<br />
Wendorff (1990), Nolte <st<strong>ro</strong>ng>and</st<strong>ro</strong>ng> Hahn<br />
(1992), Arkani-Hamed et al. (1994),<br />
<st<strong>ro</strong>ng>and</st<strong>ro</strong>ng> Taylor <st<strong>ro</strong>ng>and</st<strong>ro</strong>ng> Ravat (1995). The<br />
<st<strong>ro</strong>ng>map</st<strong>ro</strong>ng>s differ slightly in the shape <st<strong>ro</strong>ng>and</st<strong>ro</strong>ng><br />
amplitude of the main Eu<strong>ro</strong>pean<br />
<st<strong>ro</strong>ng>anomaly</st<strong>ro</strong>ng> caused by the different magnetic<br />
p<strong>ro</strong>perties of the Palaeozoic <st<strong>ro</strong>ng>and</st<strong>ro</strong>ng><br />
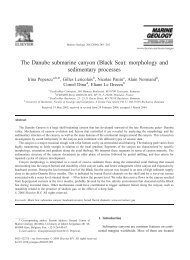
Precambrian crust. They all show a<br />
maximum <st<strong>ro</strong>ng>for</st<strong>ro</strong>ng> <st<strong>ro</strong>ng>Northern</st<strong>ro</strong>ng> Eu<strong>ro</strong>pe (Central<br />
Sweden) <st<strong>ro</strong>ng>and</st<strong>ro</strong>ng> a minimum <st<strong>ro</strong>ng>for</st<strong>ro</strong>ng><br />
Central Eu<strong>ro</strong>pe (Southern Germany).<br />
The amplitude of this <st<strong>ro</strong>ng>anomaly</st<strong>ro</strong>ng> is<br />
10±20 nT in all of the above-mentioned<br />
<st<strong>ro</strong>ng>map</st<strong>ro</strong>ng>s. As an example the <st<strong>ro</strong>ng>map</st<strong>ro</strong>ng><br />
by Nolte <st<strong>ro</strong>ng>and</st<strong>ro</strong>ng> Hahn (1992) is presented<br />
in Fig. 3.<br />
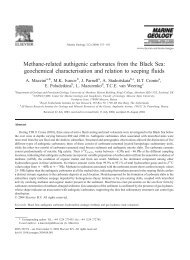
A comparison between the MAG-<br />
SAT-based <st<strong>ro</strong>ng>map</st<strong>ro</strong>ng>s <st<strong>ro</strong>ng>and</st<strong>ro</strong>ng> an earlier version<br />
of the low-level compilation<br />
presented in this paper is given by<br />
Wonik (1992). He upward-continued<br />
the 3000 m-data to 360 km using the<br />
algorithm by Grauch (1984), which<br />
accounts <st<strong>ro</strong>ng>for</st<strong>ro</strong>ng> the Earth's curvature<br />
(Fig. 4). The dimension of the ®eld<br />
sector was 2900 km in the N±S direction<br />
<st<strong>ro</strong>ng>and</st<strong>ro</strong>ng> 1720 km in the E±W direction.<br />
The shape of the Eu<strong>ro</strong>pean<br />
Fig. 3 Anomalies of total intensity in Central Eu<strong>ro</strong>pe f<strong>ro</strong>m MAGSAT data at 360 km<br />
a.m.s.l. Reference ®eld: CAIN M102089 (Cain et al., 1989), degree <st<strong>ro</strong>ng>and</st<strong>ro</strong>ng> order 1±14;<br />
epoch 1980.0. Numerical values in nT.<br />
<st<strong>ro</strong>ng>anomaly</st<strong>ro</strong>ng> caused by the di€erences of<br />
the Palaeozoic <st<strong>ro</strong>ng>and</st<strong>ro</strong>ng> Precambrian crust<br />
in both datasets coincides. However,<br />
they di€er in <st<strong>ro</strong>ng>anomaly</st<strong>ro</strong>ng> amplitude<br />
where it is 45 nT in the <st<strong>ro</strong>ng>map</st<strong>ro</strong>ng> based on<br />
low-level data. Similar observations<br />
were made by Pashkevich <st<strong>ro</strong>ng>and</st<strong>ro</strong>ng> Orlyuk<br />
(1997) <st<strong>ro</strong>ng>for</st<strong>ro</strong>ng> the Precambrian crust. Arkani-Hamed<br />
<st<strong>ro</strong>ng>and</st<strong>ro</strong>ng> Hinze (1990) who<br />
compared MAGSAT anomalies <st<strong>ro</strong>ng>and</st<strong>ro</strong>ng><br />
upward-continued ae<strong>ro</strong>magnetic anomalies<br />
f<strong>ro</strong>m North America obtained<br />
a maximal <st<strong>ro</strong>ng>anomaly</st<strong>ro</strong>ng> amplitude of<br />
23 nT f<strong>ro</strong>m the MAGSAT data <st<strong>ro</strong>ng>and</st<strong>ro</strong>ng><br />
33 nT <st<strong>ro</strong>ng>for</st<strong>ro</strong>ng> the low-level data. Furthermore,<br />
peak positions of matching anomalies<br />
did not always coincide <st<strong>ro</strong>ng>and</st<strong>ro</strong>ng><br />
many anomalies were detectable in<br />
only one of the <st<strong>ro</strong>ng>map</st<strong>ro</strong>ng>s.<br />
The di€erence in <st<strong>ro</strong>ng>anomaly</st<strong>ro</strong>ng> amplitude<br />
in Eu<strong>ro</strong>pe (10±20 nT vs. 45 nT),<br />
both at 360 km altitude, may be<br />
explained by some or all of the following:<br />
· elect<strong>ro</strong>magnetic ®elds of ionospheric<br />
currents are present at an<br />
Ó 2001 Blackwell Science Ltd 207
<st<strong>ro</strong>ng>Magnetic</st<strong>ro</strong>ng> <st<strong>ro</strong>ng>anomaly</st<strong>ro</strong>ng> <st<strong>ro</strong>ng>map</st<strong>ro</strong>ng> · T. Wonik et al. Terra Nova, Vol 13, No. 3, 203±213<br />
.............................................................................................................................................................<br />
correcting <st<strong>ro</strong>ng>for</st<strong>ro</strong>ng> the magnetic ®eld of<br />
the Earth's core (e.g. DGRF 1980,<br />
degree <st<strong>ro</strong>ng>and</st<strong>ro</strong>ng> order 1±10).<br />
These di€erences between the<br />
amplitudes of anomalies at an altitude<br />
of c. 360 km derived f<strong>ro</strong>m MAGSAT<br />
data <st<strong>ro</strong>ng>and</st<strong>ro</strong>ng> that f<strong>ro</strong>m upward-continued<br />
low-level data in Eu<strong>ro</strong>pe also have an<br />
effect on the interpretation of MAG-<br />
SAT data. Nolte <st<strong>ro</strong>ng>and</st<strong>ro</strong>ng> Hahn (1992),<br />
Taylor <st<strong>ro</strong>ng>and</st<strong>ro</strong>ng> Ravat (1995), <st<strong>ro</strong>ng>and</st<strong>ro</strong>ng> Pucher<br />
<st<strong>ro</strong>ng>and</st<strong>ro</strong>ng> Wonik (1998) computed model<br />
bodies based solely on MAGSAT<br />
anomalies. There<st<strong>ro</strong>ng>for</st<strong>ro</strong>ng>e, the computed<br />
lateral changes of magnetization or<br />
the thickness of magnetic layers are<br />
much smaller than they would if<br />
derived f<strong>ro</strong>m model calculations based<br />
on low-level data.<br />
Fig. 4 Anomalies of total intensity in Central Eu<strong>ro</strong>pe at 360 km a.m.s.l. based on the<br />
compilation of `low-level' data. The 3000-m data were upward-continued to 360 km<br />
using the algorithm by Grauch (1984). Reference ®eld: DGRF1980 (IAGA Division 1<br />
Working G<strong>ro</strong>up 1, 1985), degree <st<strong>ro</strong>ng>and</st<strong>ro</strong>ng> order: 10; epoch 1980.0. Numerical values in nT.<br />
altitude of c. 100±280 km. The<br />
effect of this on MAGSAT data<br />
quality is dif®cult to app<strong>ro</strong>ximate<br />
(Yanagisawa <st<strong>ro</strong>ng>and</st<strong>ro</strong>ng> Kono, 1985), <st<strong>ro</strong>ng>and</st<strong>ro</strong>ng><br />
so, is not considered in the abovementioned<br />
MAGSAT based <st<strong>ro</strong>ng>anomaly</st<strong>ro</strong>ng><br />
<st<strong>ro</strong>ng>map</st<strong>ro</strong>ng>s.<br />
· anomalies with wavelengths longer<br />
than the upward-continued sector<br />
(2900 ´ 1720 km) are not included in<br />
the upward-continued data, while the<br />
MAGSAT based <st<strong>ro</strong>ng>map</st<strong>ro</strong>ng>s contain this<br />
component of the magnetic ®eld.<br />
· Long-wavelength anomalies are<br />
st<strong>ro</strong>ngly e€ected by core ®eld components<br />
that have not been completely<br />
removed f<strong>ro</strong>m the Eu<strong>ro</strong>pean dataset.<br />
It should be noted, that the MAGSAT<br />
<st<strong>ro</strong>ng>anomaly</st<strong>ro</strong>ng> <st<strong>ro</strong>ng>map</st<strong>ro</strong>ng>s <st<strong>ro</strong>ng>and</st<strong>ro</strong>ng> the low-level compilation<br />
do not include anomalies with<br />
wavelengths longer than c. 4000 km,<br />
because these are eliminated while<br />
Conclusions<br />
App<strong>ro</strong>ximately 3 ´ 10 6 magnetic data<br />
<st<strong>ro</strong>ng>for</st<strong>ro</strong>ng> <st<strong>ro</strong>ng>Northern</st<strong>ro</strong>ng>, <st<strong>ro</strong>ng>Western</st<strong>ro</strong>ng>, <st<strong>ro</strong>ng>and</st<strong>ro</strong>ng> Eastern<br />
Eu<strong>ro</strong>pe were compiled <st<strong>ro</strong>ng>and</st<strong>ro</strong>ng> displayed<br />
in a 1:20 400 000 scale <st<strong>ro</strong>ng>map</st<strong>ro</strong>ng>. Detailed<br />
p<strong>ro</strong>cessing was applied to present the<br />
<st<strong>ro</strong>ng>map</st<strong>ro</strong>ng> showing magnetic anomalies of<br />
total intensity at an altitude of 3000 m<br />
a.m.s.l. Secular variations in respect<br />
to the common epoch 1980.0 were<br />
estimated by using measurements<br />
recorded at Eu<strong>ro</strong>pean <st<strong>ro</strong>ng>geo</st<strong>ro</strong>ng>magnetic<br />
observatories. The global reference<br />
®eld, DGRF 1980 was then used to<br />
eliminate the effect of the Earth's core<br />
magnetic ®eld f<strong>ro</strong>m all data.<br />
The p<strong>ro</strong>c<st<strong>ro</strong>ng>edu</st<strong>ro</strong>ng>re p<strong>ro</strong>vides the opportunity<br />
to view the longer wavelength<br />
anomalies (> 300 km) evident in the<br />
data. However, these long-wavelength<br />
anomalies are contaminated partly by<br />
the great hete<strong>ro</strong>geneity of the original<br />
data.<br />
The compiled magnetic data enable<br />
us to calculate di€erences in the magnetic<br />
p<strong>ro</strong>perties of the Precambrian<br />
<st<strong>ro</strong>ng>and</st<strong>ro</strong>ng> Palaeozoic crust within Eu<strong>ro</strong>pe.<br />
The mean thickness of the magnetized<br />
crust <st<strong>ro</strong>ng>and</st<strong>ro</strong>ng> the mean magnetization <st<strong>ro</strong>ng>for</st<strong>ro</strong>ng><br />
Precambrian <st<strong>ro</strong>ng>and</st<strong>ro</strong>ng> Palaeozoic Eu<strong>ro</strong>pe<br />
are: 40 km <st<strong>ro</strong>ng>and</st<strong>ro</strong>ng> 2.0 A/m vs. 23 km <st<strong>ro</strong>ng>and</st<strong>ro</strong>ng><br />
1.5 A/m.<br />
The compiled data were upwardcontinued<br />
to 360 km <st<strong>ro</strong>ng>and</st<strong>ro</strong>ng> compared<br />
with the MAGSAT-based <st<strong>ro</strong>ng>map</st<strong>ro</strong>ng>s <st<strong>ro</strong>ng>for</st<strong>ro</strong>ng><br />
Eu<strong>ro</strong>pe. The shape of the anomalies,<br />
especially the <st<strong>ro</strong>ng>anomaly</st<strong>ro</strong>ng> caused by the<br />
two di€erent crust types, coincides in<br />
both datasets. However, they di€er in<br />
<st<strong>ro</strong>ng>anomaly</st<strong>ro</strong>ng> amplitude by a factor of c. 3.<br />
This may be caused by interference<br />
208 Ó 2001 Blackwell Science Ltd
Terra Nova, Vol 13, No. 3, 203±213<br />
T. Wonik et al. · <st<strong>ro</strong>ng>Magnetic</st<strong>ro</strong>ng> <st<strong>ro</strong>ng>anomaly</st<strong>ro</strong>ng> <st<strong>ro</strong>ng>map</st<strong>ro</strong>ng><br />
.............................................................................................................................................................<br />
resulting f<strong>ro</strong>m elect<strong>ro</strong>magnetic ®elds<br />
induced by ionospheric ®elds not corrected<br />
in the MAGSAT data. Other<br />
factors that may account <st<strong>ro</strong>ng>for</st<strong>ro</strong>ng> this are<br />
removal of the very long wavelength<br />
component in the compilation of the<br />
low-level data. Whatever the cause,<br />
this difference in <st<strong>ro</strong>ng>anomaly</st<strong>ro</strong>ng> amplitude<br />
may lead to misinterpretation of the<br />
satellite data, suggesting that the low<br />
level data compilation is more suited<br />
<st<strong>ro</strong>ng>for</st<strong>ro</strong>ng> determining the causes of the long<br />
wavelength anomalies ac<strong>ro</strong>ss Eu<strong>ro</strong>pe.<br />
The compilation presents another<br />
piece in the jigsaw of the still incomplete<br />
magnetic <st<strong>ro</strong>ng>anomaly</st<strong>ro</strong>ng> <st<strong>ro</strong>ng>map</st<strong>ro</strong>ng> of the<br />
world. Such a <st<strong>ro</strong>ng>map</st<strong>ro</strong>ng> will help resolve<br />
uncertainties about the early histories<br />
of opening of continents <st<strong>ro</strong>ng>and</st<strong>ro</strong>ng> the<br />
p<strong>ro</strong>cesses involved in the accretion of<br />
terranes. The magnetic anomalies will<br />
help p<strong>ro</strong>vide new constraints on the<br />
pre-drift plate con®gurations <st<strong>ro</strong>ng>and</st<strong>ro</strong>ng><br />
break-up motions. The <st<strong>ro</strong>ng>geo</st<strong>ro</strong>ng>metry <st<strong>ro</strong>ng>and</st<strong>ro</strong>ng><br />
timing of these events are a key to<br />
underst<st<strong>ro</strong>ng>and</st<strong>ro</strong>ng>ing the p<strong>ro</strong>cesses that<br />
shape the passive continental margins,<br />
their sedimentary basins <st<strong>ro</strong>ng>and</st<strong>ro</strong>ng> their<br />
related economic potential.<br />
Acknowledgments<br />
We gratefully thank all institutions <st<strong>ro</strong>ng>and</st<strong>ro</strong>ng><br />
individuals listed in Table 1 who contributed<br />
data, without whose co-operation this<br />
compilation would not have been possible.<br />
Thanks also to Dr Colm Murphy, who<br />
imp<strong>ro</strong>ved the paper <st<strong>ro</strong>ng>and</st<strong>ro</strong>ng> the English considerably,<br />
<st<strong>ro</strong>ng>and</st<strong>ro</strong>ng> Dr J.D. Fairhead, an anomymous<br />
reviewer, <st<strong>ro</strong>ng>and</st<strong>ro</strong>ng> our colleagues Dr<br />
RuÈ diger Schulz <st<strong>ro</strong>ng>and</st<strong>ro</strong>ng> Dr Rudolf Pucher,<br />
who all reviewed this paper.<br />
References<br />
Arkani-Hamed, J. <st<strong>ro</strong>ng>and</st<strong>ro</strong>ng> Hinze, W.J., 1990.<br />
Limitations of the long-wavelength<br />
components of the North American<br />
magnetic <st<strong>ro</strong>ng>anomaly</st<strong>ro</strong>ng> <st<strong>ro</strong>ng>map</st<strong>ro</strong>ng>. Geophysics,<br />
55 (12), 1577±1588.<br />
Arkani-Hamed, J., Langel, R. <st<strong>ro</strong>ng>and</st<strong>ro</strong>ng> Purucker,<br />
M., 1994. Scalar magnetic <st<strong>ro</strong>ng>anomaly</st<strong>ro</strong>ng><br />
<st<strong>ro</strong>ng>map</st<strong>ro</strong>ng>s of Earth, derived f<strong>ro</strong>m POGO <st<strong>ro</strong>ng>and</st<strong>ro</strong>ng><br />
MAGSAT data. J. Geophys. Res., 99,<br />
24,075±24,090.<br />
BGR (Bundesanstalt fuÈ r Geowissenschaften<br />
und Rohsto€e), 1976. Karte der<br />
Anomalien der TotalintensitaÈt des erdmagnetischen<br />
Feldes in der Bundesrepublik<br />
Deutschl<st<strong>ro</strong>ng>and</st<strong>ro</strong>ng> 1: 500 000. BGR,<br />
Hannover.<br />
Bogdanov, A.A., Mouratov, M.V., Khaine,<br />
V.E. et al., 1973. International Tectonic<br />
Map of Eu<strong>ro</strong>pe <st<strong>ro</strong>ng>and</st<strong>ro</strong>ng> Adjacent Areas.<br />
Acad. Sci. USSR, Moscow/Unesco,<br />
Paris.<br />
Bogdanova, S.V., Pashkevich, I.K., Gorbatschev,<br />
R. <st<strong>ro</strong>ng>and</st<strong>ro</strong>ng> Orlyuk, M.I., 1996.<br />
Riphean rifting <st<strong>ro</strong>ng>and</st<strong>ro</strong>ng> major Palaeop<strong>ro</strong>te<strong>ro</strong>zoic<br />
crustal boundaries in the basement<br />
of the East Eu<strong>ro</strong>pean Craton:<br />
<st<strong>ro</strong>ng>geo</st<strong>ro</strong>ng>logy <st<strong>ro</strong>ng>and</st<strong>ro</strong>ng> <st<strong>ro</strong>ng>geo</st<strong>ro</strong>ng>physics. Tectonophysics,<br />
268, 1±21.<br />
Bolliger, J., 1967. Die P<strong>ro</strong>jektion der<br />
Schweizerischen Plan- und Kartenwerke.<br />
Druckerei Winterthur, Winterthur.<br />
Bosum, W. <st<strong>ro</strong>ng>and</st<strong>ro</strong>ng> Wonik, T., 1991. <st<strong>ro</strong>ng>Magnetic</st<strong>ro</strong>ng><br />
<st<strong>ro</strong>ng>anomaly</st<strong>ro</strong>ng> pattern of Central Eu<strong>ro</strong>pe.<br />
Tectonophysics, 195, 253±259.<br />
Cain, J.C., Schmitz, D.R. <st<strong>ro</strong>ng>and</st<strong>ro</strong>ng> Muth, L.,<br />
1984. Small-scale features in the Earth's<br />
magnetic ®eld observed by Magsat.<br />
J. Geophys. Res., 89, 1070±1076.<br />
Cain, J.C., Wang, Z., Kluth, C. <st<strong>ro</strong>ng>and</st<strong>ro</strong>ng><br />
Schmitz, D.R., 1989. Derivation of a<br />
<st<strong>ro</strong>ng>geo</st<strong>ro</strong>ng>magnetic model to n ˆ 63. Geophys.<br />
J., 97, 431±441.<br />
Coles, R.L., 1979. Some comparisons<br />
among <st<strong>ro</strong>ng>geo</st<strong>ro</strong>ng>magnetic ®eld models, observatory<br />
data <st<strong>ro</strong>ng>and</st<strong>ro</strong>ng> airborne magnetometer<br />
data: implications <st<strong>ro</strong>ng>for</st<strong>ro</strong>ng> b<strong>ro</strong>ad scale<br />
<st<strong>ro</strong>ng>anomaly</st<strong>ro</strong>ng> studies over Canada. J. Geomag.<br />
Geoelectr., 31, 459±478.<br />
Coles, R.L., Haines, G.V., Jansen van<br />
Beek, G., N<st<strong>ro</strong>ng>and</st<strong>ro</strong>ng>i, A. <st<strong>ro</strong>ng>and</st<strong>ro</strong>ng> Walker, J.K.,<br />
1982. <st<strong>ro</strong>ng>Magnetic</st<strong>ro</strong>ng> <st<strong>ro</strong>ng>anomaly</st<strong>ro</strong>ng> <st<strong>ro</strong>ng>map</st<strong>ro</strong>ng>s f<strong>ro</strong>m<br />
40°N to83°N derived f<strong>ro</strong>m Magsat<br />
satellite data. Geophys. Res. Lett., 9,<br />
281±284.<br />
Cordell, L. <st<strong>ro</strong>ng>and</st<strong>ro</strong>ng> Grauch, V.J.S., 1985.<br />
Mapping basement magnetization zones<br />
f<strong>ro</strong>m ae<strong>ro</strong>magnetic data in the San Juan<br />
Basin, New Mexico. In: The Utility of<br />
Regional Gravity <st<strong>ro</strong>ng>and</st<strong>ro</strong>ng> <st<strong>ro</strong>ng>Magnetic</st<strong>ro</strong>ng> Anomaly<br />
Maps (W. J. Hinze, ed.), pp. 181±197.<br />
Society of Exploration Geophysicists,<br />
Tulsa.<br />
Dab<strong>ro</strong>wski, A., Karaczun, K. <st<strong>ro</strong>ng>and</st<strong>ro</strong>ng><br />
Karaczun, M., 1984. The Teisseyre-<br />
Tornquist line against the backg<strong>ro</strong>und<br />
of the magnetic ®eld data in Pol<st<strong>ro</strong>ng>and</st<strong>ro</strong>ng>.<br />
Publ. Inst. Geophys. Pol. Acad. Sci.,<br />
A-13, 135±146.<br />
De Santis, A., Kerridge, D.J. <st<strong>ro</strong>ng>and</st<strong>ro</strong>ng> Barraclough,<br />
D.R., 1989. A spherical cap<br />
harmonic model of the crustal magnetic<br />
<st<strong>ro</strong>ng>anomaly</st<strong>ro</strong>ng> ®eld in Eu<strong>ro</strong>pe observed by<br />
MAGSAT. In: Geomagnetism <st<strong>ro</strong>ng>and</st<strong>ro</strong>ng> Palaeomagnetism<br />
(F. J. Lowes et al., eds),<br />
NATO ASI Series 261, pp. 1±17.<br />
Kluwer, Dordrecht.<br />
Eriksson, L. <st<strong>ro</strong>ng>and</st<strong>ro</strong>ng> Henkel, H., 1980. A<br />
preliminary discussion of fundamental<br />
deep structures in the Precambrian bed<strong>ro</strong>ck<br />
interpreted f<strong>ro</strong>m magnetic <st<strong>ro</strong>ng>and</st<strong>ro</strong>ng> gravity<br />
<st<strong>ro</strong>ng>map</st<strong>ro</strong>ng>s of Sc<st<strong>ro</strong>ng>and</st<strong>ro</strong>ng>inavia. Geofysisk<br />
Rapport 8011. Geological Survey of<br />
Sweden, Stockholm.<br />
Galdeano, A., Courtillot, V. <st<strong>ro</strong>ng>and</st<strong>ro</strong>ng> Le<br />
Mouel, J.L., 1980. La cartographie<br />
magne tique de la France au 1er juillet<br />
1978. Annales GeÂophys., 36 (1), 85±106.<br />
6 Gibert, D. <st<strong>ro</strong>ng>and</st<strong>ro</strong>ng> Galdeano, A., 1985. A<br />
computer p<strong>ro</strong>gram to per<st<strong>ro</strong>ng>for</st<strong>ro</strong>ng>m trans<st<strong>ro</strong>ng>for</st<strong>ro</strong>ng>mations<br />
of gravimetric <st<strong>ro</strong>ng>and</st<strong>ro</strong>ng> magnetic<br />
surveys. Comp. Geosci., 11, 553±588.<br />
Gilbert, D. <st<strong>ro</strong>ng>and</st<strong>ro</strong>ng> Le Mouel, J.L., 1984.<br />
Reseau magneÂtique de reÂpeÂtition de la<br />
France Campagne 1982. IPGP Observations<br />
Magne tiques 50. IPGP, Paris.<br />
Golovkov, V.P., Kolomijtzeva, G.I., Konyashchenko,<br />
L.P. <st<strong>ro</strong>ng>and</st<strong>ro</strong>ng> Semyonova,<br />
G.M., 1983. The summary of the annual<br />
mean values of magnetic elements at the<br />
world magnetic observatories: XVI.<br />
Acad. Sci. USSR, Moscow.<br />
Grabowska, T. <st<strong>ro</strong>ng>and</st<strong>ro</strong>ng> Dolnicki, J., 1994.<br />
Interpretation of <st<strong>ro</strong>ng>Magnetic</st<strong>ro</strong>ng> <st<strong>ro</strong>ng>and</st<strong>ro</strong>ng> Gravity<br />
Anomalies of the East-Eu<strong>ro</strong>pean Plat<st<strong>ro</strong>ng>for</st<strong>ro</strong>ng>m.<br />
Geophys. J., 14 (2), 159±176.<br />
Grauch, V.J.S., 1984. TAYLOR: a Fortran<br />
p<strong>ro</strong>gram using Taylor series expansion<br />
<st<strong>ro</strong>ng>for</st<strong>ro</strong>ng> level-surface or surface-level continuation<br />
of potential-®eld data. U.S.<br />
7 Geol. Surv. Open-File Rep. , 84±501.<br />
G<strong>ro</strong>ssmann, W., 1964. GeodaÈtische<br />
Rechnungen und Abbildungen in der<br />
L<st<strong>ro</strong>ng>and</st<strong>ro</strong>ng>esvermessung. Konrad Wittwer,<br />
Stuttgart.<br />
GyoÈ rgy, S., 1966. Magya<strong>ro</strong>rszaÂg<br />
FoÈldmaÂgneses TeÂrkeÂpe. A FuÈggoÈleges<br />
TeÂre<strong>ro</strong>ÈsseÂg AnomaÂliaÂi, 1:500 000.<br />
Magyar A llami EoÈ tvoÈ s Lora nd Geo-<br />
®zikai Inte zet, Geo®zikai KoÈ zleme nyek,<br />
8 XVI, 4, Budapest.<br />
Hahn, A., 1965. Two applications of Fourier's<br />
analysis <st<strong>ro</strong>ng>for</st<strong>ro</strong>ng> the interpretation of<br />
<st<strong>ro</strong>ng>geo</st<strong>ro</strong>ng>magnetic anomalies. J. Geomagn.<br />
Geol., 17, 195±225.<br />
Hahn, A., 1985. Geomagnetik. In: Angew<st<strong>ro</strong>ng>and</st<strong>ro</strong>ng>te<br />
Geowissenschaften, II, Methoden<br />
der Angew<st<strong>ro</strong>ng>and</st<strong>ro</strong>ng>ten Geophysik und Mathematische<br />
Verfahren in Den Geowissenschaften<br />
(F. Bender, ed.), pp. 84±142.<br />
Enke, Stuttgart.<br />
Hahn, A., 1986. <st<strong>ro</strong>ng>Magnetic</st<strong>ro</strong>ng> anomalies. In:<br />
Third EGT Workshop: the Central<br />
Segment (R. Freeman et al., eds),<br />
pp. 113±116. Eu<strong>ro</strong>pean Science Foundation,<br />
Strasbourg.<br />
Hartmann, O., 1963. Beh<st<strong>ro</strong>ng>and</st<strong>ro</strong>ng>lung lokaler<br />
erdmagnetischer Felder als R<st<strong>ro</strong>ng>and</st<strong>ro</strong>ng>wertaufgabe<br />
der Potentialtheorie. Abh.<br />
9 Akad. Wiss. GoÈttingen, Math.- Phys. Kl. ,<br />
Beitr. int. Geophys. Jahr, 9.<br />
Henkel, H., Arkko, V., Hult, K. et al.,<br />
1986. Ae<strong>ro</strong>magnetic interpretation <st<strong>ro</strong>ng>map</st<strong>ro</strong>ng>,<br />
<st<strong>ro</strong>ng>Northern</st<strong>ro</strong>ng> Fennosc<st<strong>ro</strong>ng>and</st<strong>ro</strong>ng>ia, 1: 1 000 000.<br />
Geological Surveys of Finl<st<strong>ro</strong>ng>and</st<strong>ro</strong>ng>, Norway,<br />
<st<strong>ro</strong>ng>and</st<strong>ro</strong>ng> Sweden.<br />
Henkel, H., Lee, M.K. <st<strong>ro</strong>ng>and</st<strong>ro</strong>ng> Lund, C.-E.,<br />
1990. An integrated <st<strong>ro</strong>ng>geo</st<strong>ro</strong>ng>physical interpretation<br />
of the 2000 km FENNOLORA<br />
section of the Baltic Shield. In: The<br />
Eu<strong>ro</strong>pean Geotraverse: Integrative Studies<br />
(R. Freeman et al., eds), pp. 1±47.<br />
Eu<strong>ro</strong>pean Science Foundation,<br />
Strasbourg.<br />
Hurtig, E., Cermak, V., HaÈ nel, R. <st<strong>ro</strong>ng>and</st<strong>ro</strong>ng> Zui,<br />
V. (eds), 1992. Geothermal Atlas of<br />
Ó 2001 Blackwell Science Ltd 209
<st<strong>ro</strong>ng>Magnetic</st<strong>ro</strong>ng> <st<strong>ro</strong>ng>anomaly</st<strong>ro</strong>ng> <st<strong>ro</strong>ng>map</st<strong>ro</strong>ng> · T. Wonik et al. Terra Nova, Vol 13, No. 3, 203±213<br />
.............................................................................................................................................................<br />
Eu<strong>ro</strong>pe. Publ. no. 1, Gotha. GeoForschungsZentrum,<br />
Potsdam.<br />
Hurwitz, L., Knapp, D.G., Nelson, J.H.<br />
<st<strong>ro</strong>ng>and</st<strong>ro</strong>ng> Watson, D.E., 1966. Mathematical<br />
model of the <st<strong>ro</strong>ng>geo</st<strong>ro</strong>ng>magnetic ®eld <st<strong>ro</strong>ng>for</st<strong>ro</strong>ng> 1965.<br />
J. Geophys. Res., 71 (9), 2373±2383.<br />
IAGA Division 1 Working G<strong>ro</strong>up 1, 1985.<br />
International Geomagnetic Reference<br />
Field revision 1985. J. Geomagn.<br />
Geoelectr., 37, 1157±1163.<br />
IPGP (Institut de Physique du Globe de<br />
Paris), 1987. Chambon-la-Fort 1986.<br />
Observations Magne tique 54. IPGP,<br />
Paris.<br />
Krutikhovskaya, Z.A., Pashkevich, I.K.<br />
<st<strong>ro</strong>ng>and</st<strong>ro</strong>ng> Silina, I.M., 1980. <st<strong>ro</strong>ng>Magnetic</st<strong>ro</strong>ng> model<br />
<st<strong>ro</strong>ng>and</st<strong>ro</strong>ng> Earth's crust structure of the<br />
10 Ukrainian Shield. National Academy<br />
of Sciences of the Ukraine, Kiev<br />
(in Russian).<br />
Langel, R.A. <st<strong>ro</strong>ng>and</st<strong>ro</strong>ng> Estes, R.H., 1985. The<br />
near-Earth magnetic ®eld at 1980 determined<br />
f<strong>ro</strong>m Magsat data. J. Geophys.<br />
Res., 90, 2495±2509.<br />
Mikkola, L., 1983. Mean height <st<strong>ro</strong>ng>map</st<strong>ro</strong>ng> of<br />
Finl<st<strong>ro</strong>ng>and</st<strong>ro</strong>ng>. Publ. Finn. Geod. Inst., 98, 3±5.<br />
Helsinki.<br />
Nolte, H.J. <st<strong>ro</strong>ng>and</st<strong>ro</strong>ng> Hahn, A., 1992. A model<br />
of the distribution of crustal magnetization<br />
in Central Eu<strong>ro</strong>pe compatible with<br />
the ®eld of magnetic anomalies d<st<strong>ro</strong>ng>edu</st<strong>ro</strong>ng>ced<br />
f<strong>ro</strong>m Magsat results. Geophys. J. Int.,<br />
111, 483±496.<br />
Orlyuk, M.I. <st<strong>ro</strong>ng>and</st<strong>ro</strong>ng> Pashkevich, I.K., 1996.<br />
<st<strong>ro</strong>ng>Magnetic</st<strong>ro</strong>ng> model of the Earth's crust<br />
<st<strong>ro</strong>ng>for</st<strong>ro</strong>ng> the South-East of the East-<br />
Eu<strong>ro</strong>pean Plat<st<strong>ro</strong>ng>for</st<strong>ro</strong>ng>m. Geophys. J., 15,<br />
839±847.<br />
Pashkevich, I.K. <st<strong>ro</strong>ng>and</st<strong>ro</strong>ng> Orlyuk, M.I., 1997.<br />
<st<strong>ro</strong>ng>Magnetic</st<strong>ro</strong>ng> model of the lithosphere <st<strong>ro</strong>ng>and</st<strong>ro</strong>ng><br />
some p<strong>ro</strong>blems of <st<strong>ro</strong>ng>geo</st<strong>ro</strong>ng>magnetic reference<br />
®eld. (Abstract). In: 8th Scienti®c<br />
Assembly of IAGA, Uppsala, 485. IAGA,<br />
Uppsala.<br />
Pashkevich, I.K., Kutovaya, A.P. <st<strong>ro</strong>ng>and</st<strong>ro</strong>ng><br />
Orlyuk, M.I., 1989. On the Question of<br />
the Southwestern Edge of the East-<br />
Eu<strong>ro</strong>pean Plat<st<strong>ro</strong>ng>for</st<strong>ro</strong>ng>m. Geophys. J., 7 (5),<br />
687±697.<br />
Pashkevich, I.K., Markovsky, V.S., Orlyuk,<br />
M.I. et al., 1990. <st<strong>ro</strong>ng>Magnetic</st<strong>ro</strong>ng> model of<br />
the lithosphere of Eu<strong>ro</strong>pe. Naukova<br />
Dumka, Kiev (in Russian).<br />
Pashkevich, I.K., Orlyuk, M.I. <st<strong>ro</strong>ng>and</st<strong>ro</strong>ng> Eliseeva,<br />
S.V., 1997. Regional magnetic anomalies:<br />
solution of fundamental <st<strong>ro</strong>ng>and</st<strong>ro</strong>ng> applied<br />
p<strong>ro</strong>blems. Geophys. J., 16, 715±738.<br />
Pilchin, A. <st<strong>ro</strong>ng>and</st<strong>ro</strong>ng> Eppelbaum, L., 1997.<br />
Determination of the lower edges of<br />
magnetised bodies by using <st<strong>ro</strong>ng>geo</st<strong>ro</strong>ng>thermal<br />
data. Geophys. J. Int., 128, 167±174.<br />
Pucher, R. <st<strong>ro</strong>ng>and</st<strong>ro</strong>ng> Wonik, T., 1998. A new<br />
interpretation of the MAGSAT anomalies<br />
of Central Eu<strong>ro</strong>pe. Phys. Chem.<br />
Earth, 23 (9±10), 981±985.<br />
Pucher, R. <st<strong>ro</strong>ng>and</st<strong>ro</strong>ng> Wonik, T., 2001. Eine karte<br />
der erdmagnetischen TotalintensitaÈ tin<br />
Deutschl<st<strong>ro</strong>ng>and</st<strong>ro</strong>ng>. Mitt. Dtsch. Geophys. Ges.,<br />
2, 22±29.<br />
Riddihough, R.P., 1972. Regional magnetic<br />
anomalies <st<strong>ro</strong>ng>and</st<strong>ro</strong>ng> <st<strong>ro</strong>ng>geo</st<strong>ro</strong>ng>logy in Fennosc<st<strong>ro</strong>ng>and</st<strong>ro</strong>ng>ia:<br />
a discussion. Can. J. Earth Sci.,<br />
9(3), 219±232.<br />
Rudman, A.J. <st<strong>ro</strong>ng>and</st<strong>ro</strong>ng> Blakely, R.F., 1975.<br />
Fortran p<strong>ro</strong>gram <st<strong>ro</strong>ng>for</st<strong>ro</strong>ng> the upward <st<strong>ro</strong>ng>and</st<strong>ro</strong>ng><br />
downward continuation <st<strong>ro</strong>ng>and</st<strong>ro</strong>ng> derivatives of<br />
potential ®elds. Geological Survey Occasional<br />
Paper 10. Department of Natural<br />
Resources, Bloomimgton, IN.<br />
Schleusener, A., 1959. Karte der mittleren<br />
HoÈ hen von Zentraleu<strong>ro</strong>pa. Ang. GeodaÈsie,<br />
B60, 3±7.<br />
Schulz, G., Beblo, M. <st<strong>ro</strong>ng>and</st<strong>ro</strong>ng> G<strong>ro</strong>pius, M.,<br />
1997. The 1982.5 <st<strong>ro</strong>ng>geo</st<strong>ro</strong>ng>magnetic normal<br />
®eld of the Federal Republic of Germany<br />
<st<strong>ro</strong>ng>and</st<strong>ro</strong>ng> the secular variation ®eld f<strong>ro</strong>m 1965<br />
to 1992. Dt. Hyd<strong>ro</strong>gr. Z., 49 (1), 5±20.<br />
Simonenko, T.N. <st<strong>ro</strong>ng>and</st<strong>ro</strong>ng> Pashkevitch, I.K.<br />
(eds), 1990. <st<strong>ro</strong>ng>Magnetic</st<strong>ro</strong>ng> <st<strong>ro</strong>ng>anomaly</st<strong>ro</strong>ng> <st<strong>ro</strong>ng>map</st<strong>ro</strong>ng> of<br />
Eu<strong>ro</strong>pe, 1: 5 000 000. Academy of Sciences<br />
of the Ukrainian SSR/ Institute<br />
of Geophysics Kiev/ Mining Institute<br />
Leningrad, Moscow.<br />
Snyder, J.P., 1987. Map p<strong>ro</strong>jections ± a<br />
working manual. P<strong>ro</strong>f. Pap. U.S. Geol.<br />
Surv., 1395, 383 pp.<br />
Taylor, P.T. <st<strong>ro</strong>ng>and</st<strong>ro</strong>ng> Ravat, D., 1995. An<br />
interpretation of the MAGSAT anomalies<br />
of Central Eu<strong>ro</strong>pe. J. Appl. Geophys.,<br />
34, 83±91.<br />
Thybo, H., Pha<strong>ro</strong>ah, T.C. <st<strong>ro</strong>ng>and</st<strong>ro</strong>ng> Guterch, A.<br />
(eds), 1999. Geophysical investigations<br />
of the Trans-Eu<strong>ro</strong>pean Suture Zone.<br />
Tectonophysics, 314, 1±350.<br />
Voppel, D. <st<strong>ro</strong>ng>and</st<strong>ro</strong>ng> Wienert, K., 1974. Die<br />
<st<strong>ro</strong>ng>geo</st<strong>ro</strong>ng>magnetische Vermessung der Bundesrepublik<br />
Deutschl<st<strong>ro</strong>ng>and</st<strong>ro</strong>ng>, Epoche<br />
1965.0. Dt. Hyd<strong>ro</strong>gr. Z., 27 (2), 49±56.<br />
Wendor€, L., 1990. Die Ermittlung des<br />
globalen erdmagnetischen Feldes inneren<br />
Ursprungs auf einem festen <st<strong>ro</strong>ng>geo</st<strong>ro</strong>ng>zentrischen<br />
Radius aus den Meûdaten des Satelliten<br />
MAGSAT. Unpubl. doctoral<br />
dissertation, University of GoÈ ttingen.<br />
Wonik, T., 1990. Experience with the use<br />
of global reference ®elds <st<strong>ro</strong>ng>for</st<strong>ro</strong>ng> compilation<br />
of ae<strong>ro</strong>magnetic data <st<strong>ro</strong>ng>for</st<strong>ro</strong>ng> Eu<strong>ro</strong>pe.<br />
J.Geomagn. Geoel., 42 (9), 1087±1097.<br />
Wonik, T., 1992. Kompilation und Interpretation<br />
der magnetischen Anomalien der<br />
TotalintensitaÈt in Zentral- und Nordeu<strong>ro</strong>pa.<br />
Unpubl. doctoral Dissertation,<br />
University of GoÈ ttingen.<br />
Wonik, T. <st<strong>ro</strong>ng>and</st<strong>ro</strong>ng> Hahn, A., 1988. Experience<br />
with the use of repeat measurements at<br />
<st<strong>ro</strong>ng>geo</st<strong>ro</strong>ng>magnetic stations <st<strong>ro</strong>ng>for</st<strong>ro</strong>ng> the compilation<br />
of ae<strong>ro</strong>magnetic data <st<strong>ro</strong>ng>for</st<strong>ro</strong>ng> <st<strong>ro</strong>ng>Western</st<strong>ro</strong>ng> Eu<strong>ro</strong>pe.<br />
Dt. Hyd<strong>ro</strong>gr. Z., 41, 187±198.<br />
Wonik, T. <st<strong>ro</strong>ng>and</st<strong>ro</strong>ng> Hahn, A., 1989. Karte der<br />
Magnetfeldanomalien AÈ F Bundesrepublik<br />
Deutschl<st<strong>ro</strong>ng>and</st<strong>ro</strong>ng>, Luxemburg, Schweiz<br />
und OÈ sterreich (westlicher Teil) 1:<br />
1 000 000. Geol. Jb., E43, 3±21.<br />
Wonik, T. <st<strong>ro</strong>ng>and</st<strong>ro</strong>ng> Hahn, A., 1990. Compilation<br />
of the Central <st<strong>ro</strong>ng>and</st<strong>ro</strong>ng> <st<strong>ro</strong>ng>Northern</st<strong>ro</strong>ng> Eu<strong>ro</strong>pean<br />
ae<strong>ro</strong>magnetic surveys: methods,<br />
diculties, <st<strong>ro</strong>ng>and</st<strong>ro</strong>ng> results. In: P<strong>ro</strong>c. Sixth<br />
Workshop Eu<strong>ro</strong>pean Geotraverse (EGT):<br />
Data Compilations <st<strong>ro</strong>ng>and</st<strong>ro</strong>ng> Synoptic Interpretation<br />
(R. Freeman <st<strong>ro</strong>ng>and</st<strong>ro</strong>ng> St. Mueller,<br />
eds), pp. 213±224. Eu<strong>ro</strong>pean Science<br />
Foundation, Strasbourg.<br />
Wonik, T. <st<strong>ro</strong>ng>and</st<strong>ro</strong>ng> Hahn, A., 1991. Preliminary<br />
<st<strong>ro</strong>ng>map</st<strong>ro</strong>ng> of ae<strong>ro</strong>magnetic anomalies <st<strong>ro</strong>ng>for</st<strong>ro</strong>ng> the<br />
EGT central segment. In: The Eu<strong>ro</strong>pean<br />
Geotraverse: Integrative Studies<br />
(R. Freeman et al., eds), pp. 147±156.<br />
Eu<strong>ro</strong>pean Science Foundation,<br />
Strasbourg.<br />
Wonik, T., Galdeano, A., Hahn, A. <st<strong>ro</strong>ng>and</st<strong>ro</strong>ng><br />
Mouge, P., 1992. <st<strong>ro</strong>ng>Magnetic</st<strong>ro</strong>ng> anomalies.<br />
In: A Continent Revealed ± the Eu<strong>ro</strong>pean<br />
Geotraverse. Atlas of Compiled Data<br />
(R. Freeman <st<strong>ro</strong>ng>and</st<strong>ro</strong>ng> St. Mueller, eds),<br />
pp. 31±34. Cambridge University Press,<br />
Cambridge.<br />
Yanagisawa, M. <st<strong>ro</strong>ng>and</st<strong>ro</strong>ng> Kono, M., 1985.<br />
Mean ionospheric ®eld corrections <st<strong>ro</strong>ng>for</st<strong>ro</strong>ng><br />
MAGSAT data. J. Geophys. Res., 90,<br />
2517±2536.<br />
Received 10 November 2000; revised version<br />
accepted 11 June 2001<br />
210 Ó 2001 Blackwell Science Ltd
Terra Nova, Vol 13, No. 3, 203±213<br />
T. Wonik et al. · <st<strong>ro</strong>ng>Magnetic</st<strong>ro</strong>ng> <st<strong>ro</strong>ng>anomaly</st<strong>ro</strong>ng> <st<strong>ro</strong>ng>map</st<strong>ro</strong>ng><br />
.............................................................................................................................................................<br />
Appendix 1 Available magnetic datasets <st<strong>ro</strong>ng>and</st<strong>ro</strong>ng> their parameters<br />
Ref.<br />
no. Survey<br />
Coordinates<br />
central<br />
meridian<br />
Height<br />
(m)<br />
a.m.s.l. Epoch<br />
P<strong>ro</strong>®le/<br />
(data)<br />
spacing (km)<br />
Grid<br />
(km)<br />
Available<br />
data<br />
<st<strong>ro</strong>ng>map</st<strong>ro</strong>ng> scale<br />
Reference<br />
®eld<br />
(height; epoch)<br />
1 <st<strong>ro</strong>ng>Western</st<strong>ro</strong>ng> Germany Gauss±KruÈ ger 9°E 700/1000/1500 1967.5 2.2 (N±S) 11.0 (E±W) 2.2 ´ 2.2 56 700 DF-values quadratic polynomial<br />
2 Harz Mountains Gauss±KruÈ ger 9°E 50 above g<strong>ro</strong>und 1983.9 0.2 (N±S) on p<strong>ro</strong>®les 195 400 DF-values IGRF 1980 (0 m;1983.9)<br />
3 Eichsfeld <st<strong>ro</strong>ng>geo</st<strong>ro</strong>ng>gr. g<strong>ro</strong>und [250] 1987.8 1.0 (N±S) 1.0 (E±W) 1000 stations F<br />
4 Tirschenreuth Gauss±KruÈ ger 9°E 50 above g<strong>ro</strong>und [615] 1977.3 0.3 (N±S) on p<strong>ro</strong>®les 84 300 DF-values IGRF 1975 (0 m;1977.3)<br />
5 Pfalz <st<strong>ro</strong>ng>geo</st<strong>ro</strong>ng>gr. g<strong>ro</strong>und [550] 1985.9 1.0 (N±S) 1.0 (E±W) 800 stations F<br />
6 <st<strong>ro</strong>ng>Western</st<strong>ro</strong>ng> Austria Gauss±KruÈ ger 12°E 3000/4000 1977.5 2.2 (N±S) 11.0 (E±W) 2.2 ´ 2.2 5500 DF-values linear polynomial<br />
7 Eastern Austria Gauss±KruÈ ger 13°20'E various 1978.0 2.0 (N±S) 2.2 ´ 2.2 19 000 F-values<br />
8 Switzerl<st<strong>ro</strong>ng>and</st<strong>ro</strong>ng> north of Alps Swiss rectangular kilometric 1829 1980.5 5.0 (N±S) 20.0 (E±W) on p<strong>ro</strong>®les 86 000 F-values<br />
8 Switzerl<st<strong>ro</strong>ng>and</st<strong>ro</strong>ng> Ticino Swiss rectangular kilometric 3000 1981.5 5.0 (N±S) 20.0 (E±W) on p<strong>ro</strong>®les 6500 F-values<br />
8 Switzerl<st<strong>ro</strong>ng>and</st<strong>ro</strong>ng> entire country Swiss rectangular kilometric 5000 1981.5 5.0 (N±S) 20.0 (E±W) on p<strong>ro</strong>®les 160 000 F-values<br />
9 Eastern France Lambert France II 3000 1964.5 10.0 (N±S) 100.0 (E±W) 1 ´ 10 33 400 DF-values quadratic polynomial<br />
10 Luxembourg Gauss±KruÈ ger 6°E 1000 1967.5 2.2 (N±S) 11.0 (E±W) 2.2 ´ 2.2 800 DF-values 1:100 000 quadratic polynomial<br />
11 Belgium <st<strong>ro</strong>ng>geo</st<strong>ro</strong>ng>gr. g<strong>ro</strong>und [200] 1960.5 irregularly distributed (6.6) 700 stations F<br />
12 Brabant Massif Gauss±KruÈ ger 6°E g<strong>ro</strong>und [20] 1979.0 irregularly distributed (2.2) 500 stations F<br />
13 The Netherl<st<strong>ro</strong>ng>and</st<strong>ro</strong>ng>s <st<strong>ro</strong>ng>geo</st<strong>ro</strong>ng>gr. g<strong>ro</strong>und [20] 1945.0 irregularly distributed (11.2) 320 stations H, Z<br />
14 Dutch North Sea <st<strong>ro</strong>ng>geo</st<strong>ro</strong>ng>gr. sea 1980.0 20.0 (N±S) on p<strong>ro</strong>®les 35 000 DF-values IGRF 1980 (0 m;1980.0)<br />
15 North Sea Gauss±KruÈ ger 9°E sea 1960.5 irregularly distributed 10 ´ 10 400 F-values 1:250 000<br />
16 Denmark <st<strong>ro</strong>ng>geo</st<strong>ro</strong>ng>gr. g<strong>ro</strong>und [20] 1975.5<br />
1980.0<br />
irregularly distributed (8.5) 600 stations F<br />
17 Denmark <st<strong>ro</strong>ng>geo</st<strong>ro</strong>ng>gr. 760 1963.0 3/6 (N±S) 6.0 (E±W) 5' ´ 6' 2200 F-values (¯uxgate<br />
magnetometer) 1:100 000<br />
18 Danish North Sea <st<strong>ro</strong>ng>geo</st<strong>ro</strong>ng>gr. 300 1963.0 3.0 (E±W) 3' ´ 5' 2800 F-values (¯uxgate<br />
magnetometer) 1:200 000<br />
19 Norway UTM 32°E various 1965.0 various 1 ´ 1 670 600 F-values DGRF 1965 (0 m;1965.0)<br />
20 Offshore Norway <st<strong>ro</strong>ng>geo</st<strong>ro</strong>ng>gr. 180 1965.0 5.0 (N±S) 50.0 (E±W) 15 ´ 15 1800 DF-values 1:1 500 000 IGRF 1965 (180m;1965.0)<br />
21 <st<strong>ro</strong>ng>Northern</st<strong>ro</strong>ng> Fennosc<st<strong>ro</strong>ng>and</st<strong>ro</strong>ng>ia Lambert 18°E various 1965.0 various 1 ´ 1 90 500 F-values DGRF 1965 (0 m;1965.0)<br />
22 Offshore southern Sweden <st<strong>ro</strong>ng>geo</st<strong>ro</strong>ng>gr. 600 1970.5 1;2;4 2' ´ 4' 3700 DF-values 1:200 000 IGRF 1965 (600m;1970.5)<br />
23 Finl<st<strong>ro</strong>ng>and</st<strong>ro</strong>ng> gauss±KruÈ ger 27°E 150 above g<strong>ro</strong>und 1965.0 0.4 (N±S) 2.5 ´ 2.5 65 700 F-values DGRF 1965 (0 m;1965.0)<br />
24 Sc<st<strong>ro</strong>ng>and</st<strong>ro</strong>ng>inavia <st<strong>ro</strong>ng>geo</st<strong>ro</strong>ng>gr. 3000 1965.0 35.0 (NW±SE) 9600 F-values<br />
25 Offshore Norway <st<strong>ro</strong>ng>geo</st<strong>ro</strong>ng>gr. 300 1965.0 18.0 (E±W) 1250 DF-values 1:5 000 000 (Hurwitz et al. 1966)<br />
26 Eastern Germany <st<strong>ro</strong>ng>geo</st<strong>ro</strong>ng>gr. g<strong>ro</strong>und [250] 1957.5 irregularly distributed (7.9) 1750 stations F<br />
27 Eastern Germany Gauss±KruÈ ger 12°E g<strong>ro</strong>und/100<br />
above g<strong>ro</strong>und<br />
various various 1 ´ 1 160 000 DF-values various<br />
28 Former Czechoslovakia <st<strong>ro</strong>ng>geo</st<strong>ro</strong>ng>gr. g<strong>ro</strong>und [700] 1958.0 irregularly distributed (20.9) 300 stations F<br />
29 Former Czechoslovakia <st<strong>ro</strong>ng>geo</st<strong>ro</strong>ng>gr. g<strong>ro</strong>und [700] 1967.5 irregularly distributed (32.6) 120 stations F<br />
30 Hungary <st<strong>ro</strong>ng>geo</st<strong>ro</strong>ng>gr. g<strong>ro</strong>und [150] 1950.0 irregularly distributed 3800 DZ±values 1:500 000 (GyoÈ rgy, 1966)<br />
31 Romania <st<strong>ro</strong>ng>geo</st<strong>ro</strong>ng>gr. g<strong>ro</strong>und [300] 1967.5 irregularly distributed 4600 DZ±values 1:1 000 000 quadratic polynomial<br />
32 Pol<st<strong>ro</strong>ng>and</st<strong>ro</strong>ng> <st<strong>ro</strong>ng>geo</st<strong>ro</strong>ng>gr. 500 above g<strong>ro</strong>und 1980.0 various 5 ´ 5 13 000 DF-values IGRF1980 (0m;1980.0)<br />
33 Offshore Irel<st<strong>ro</strong>ng>and</st<strong>ro</strong>ng> <st<strong>ro</strong>ng>geo</st<strong>ro</strong>ng>gr. 305 above g<strong>ro</strong>und 1990.0 various 2 ´ 2 35 000 DF-values IGRF1990 (0m;1990.0)<br />
34 Onshore Irel<st<strong>ro</strong>ng>and</st<strong>ro</strong>ng> <st<strong>ro</strong>ng>geo</st<strong>ro</strong>ng>gr. 305 above g<strong>ro</strong>und 1990.0 various 2 ´ 2 25 000 DF-values IGRF1990 (0m;1990.0)<br />
35 United Kingdom <st<strong>ro</strong>ng>geo</st<strong>ro</strong>ng>gr. 305 above g<strong>ro</strong>und 1990.0 0.4 ± 2.0 2 ´ 2 250 000 DF-values IGRF1990 (0m;1990.0)<br />
36 Former USSR <st<strong>ro</strong>ng>geo</st<strong>ro</strong>ng>gr. various 1965.0 various 3' ´ 3' 500 000 DF-values various<br />
Ó 2001 Blackwell Science Ltd 211
<st<strong>ro</strong>ng>Magnetic</st<strong>ro</strong>ng> <st<strong>ro</strong>ng>anomaly</st<strong>ro</strong>ng> <st<strong>ro</strong>ng>map</st<strong>ro</strong>ng> · T. Wonik et al. Terra Nova, Vol 13, No. 3, 203±213<br />
.............................................................................................................................................................<br />
References<br />
1 BGR (Bundesanstalt fuÈ r Geowissenschaften und Rohstoffe), 1976. Karte der Anomalien der TotalintensitaÈ t des erdmagnetischen Feldes in der Bundesrepublik Deutschl<st<strong>ro</strong>ng>and</st<strong>ro</strong>ng> 1:500 000. Hannover.<br />
BfB (Bundesanstalt fuÈ r Boden<st<strong>ro</strong>ng>for</st<strong>ro</strong>ng>schung) (now BGR), 1971. Bericht uÈ ber die DurchfuÈ hrung einer ae<strong>ro</strong>magnetischen Vermessung in der Bundesrepublik Deutschl<st<strong>ro</strong>ng>and</st<strong>ro</strong>ng> 1965 - 1971. Report of the company Prakla-Seismos,<br />
Ber. Arch. BGR, 8575, Hannover. [unpubl.].<br />
NLfB (NiedersaÈchsisches L<st<strong>ro</strong>ng>and</st<strong>ro</strong>ng>esamt fuÈ r Boden<st<strong>ro</strong>ng>for</st<strong>ro</strong>ng>schung), 1975. Bericht Ae<strong>ro</strong>magnetik Ost-Niedersachsen 1975 uÈ ber eine ErgaÈ nzungsbe¯iegung zur Gesamtvermessung Ae<strong>ro</strong>magnetik Bundesrepublik Deutschl<st<strong>ro</strong>ng>and</st<strong>ro</strong>ng>. Report<br />
of the company Prakla-Seismos, Ber. Arch. NLfB, 70 373, Hannover. [unpubl.].<br />
Pucher, R. <st<strong>ro</strong>ng>and</st<strong>ro</strong>ng> Hahn, A., 1983. Erstellung einer Karte der Anomalien der TotalintensitaÈt des erdmagnetischen Feldes fuÈ r das Erlaubnisfeld Velpke-Asse (Ost-Niedersachsen). Ber. Arch. NLfB, 95 740, Hannover. [unpubl.].<br />
2 BGR, Hannover (SENGPIEL, K.P.)<br />
Sengpiel, K.P., 1987. Geophysikalische Karten 1:25 000 ± Harz, Technische ErlaÈ uterungen. BGR, Hannover.<br />
3 GGA (Inst. f. Geowissenschaftliche Gemeinschaftsaufgaben), Hannover (PUCHER, R.)<br />
Plaumann, S. <st<strong>ro</strong>ng>and</st<strong>ro</strong>ng> Pucher, R., 1988. Eine bodenmagnetische Vermessung zwischen Harz und Werra. Ber. Arch. NLfB, 104 401, Hannover. [unpubl.].<br />
4 BGR, Hannover (SENGPIEL, K.P.)<br />
Sengpiel, K.P., 1981. AusruÈ stung und Erp<strong>ro</strong>bung eines Hubschraubers fuÈ r <st<strong>ro</strong>ng>geo</st<strong>ro</strong>ng>physikalische Messungen. Ber. Arch. BGR, 87 893, Hannover. [unpubl.].<br />
5 GGA, Hannover (PUCHER, R.)<br />
Pucher, R., 1986. Magnetische Vermessung am Boden in der Oberpfalz zwischen Tirschenreuth und WaldmuÈ nchen. Ber. Arch. NLfB, 100 015, Hannover. [unpubl.].<br />
6 GGA, Hannover (PUCHER, R.) <st<strong>ro</strong>ng>and</st<strong>ro</strong>ng> Institut fuÈ r Meteo<strong>ro</strong>logie und Geophysik der UniversitaÈ t Wien (GUTDEUTSCH, R. & SEIBERL, W.)<br />
Pucher, R. <st<strong>ro</strong>ng>and</st<strong>ro</strong>ng> Hahn, A., 1980. FlaÈ chenhafte Erfassung der Anomalien der TotalintensitaÈ t des erdmagnetischen Feldes im Raum Bayrische Alpen - Ti<strong>ro</strong>l - Vorarlberg; RuÈ ckschluÈ sse auf Strukturen des Untergrundes. BMFT-FB,<br />
T 80-041, Leopoldshafen.<br />
7 Institut fuÈ r Meteo<strong>ro</strong>logie und Geophysik der UniversitaÈ t Wien (GUTDEUTSCH, R. & SEIBERL, W.) <st<strong>ro</strong>ng>and</st<strong>ro</strong>ng> Geologische Bundesanstalt, Vienna (GATTINGER, T. & EICHBERGER, H.)<br />
Gutdeutsch, R. <st<strong>ro</strong>ng>and</st<strong>ro</strong>ng> Seiberl, W., 1987. Die ae<strong>ro</strong>magnetische Vermessung OÈ sterreichs. Institut fuÈ r Meteo<strong>ro</strong>logie und Geophysik UniversitaÈ t Wien, AMVOÈ -Bericht, Vienna.<br />
8 SGPK (Schweizerische Geophysikalische Kommission), Zurich (KLINGELE, E.)<br />
Klingele, E., 1986. Les leveÂs aeÂ<strong>ro</strong>magneÂtiques de la Suisse. GeodaÈtisch-<st<strong>ro</strong>ng>geo</st<strong>ro</strong>ng>physikalische Arbeiten in der Schweiz, 37, Bern.<br />
SGPK, 1982. Ae<strong>ro</strong>magnetische Karte der Schweiz. Compiled by Klingele, E., 1:500 000.<br />
SGPK, 1983. Ae<strong>ro</strong>magnetische Karte (TotalintensitaÈt) des Schweizerischen Alpenvorl<st<strong>ro</strong>ng>and</st<strong>ro</strong>ng>es und Juras, Epoche 1980,5. Compiled by Klingele, E., 1:500 000.<br />
9 Centre National de la Recherche Scienti®que <st<strong>ro</strong>ng>and</st<strong>ro</strong>ng> Institut National d'Ast<strong>ro</strong>nomie et de GeÂophysique <st<strong>ro</strong>ng>and</st<strong>ro</strong>ng> Institut de Physique du Globe de Paris (GALDEANO, A.)<br />
Le Borgne, E. <st<strong>ro</strong>ng>and</st<strong>ro</strong>ng> Le Mouel, J.L., 1966. La nouvelle carte magneÂtique de la France. Institut de Physique du Globe de Paris, Note, 15, Paris.<br />
IPGP (Institute Physique du Globe de Paris), (without year). Carte magneÂtique de France, Intensite du champ total F, au 01.07.1964, 1:1 000 000. Paris.<br />
IPGP, (without year). Carte magneÂtique de France, Anomalies du champ total, 1:1 000 000. Paris.<br />
10 Service GeÂologique Luxembourg (BINTZ, J.)<br />
Service GeÂologique Luxembourg, 1969. Bericht uÈ ber die ae<strong>ro</strong>magnetometrische Vermessung G<strong>ro</strong>ssherzogtum Luxembourg. Report of the company Prakla-Seismos. [unpubl.].<br />
11 De Vuyst, A., 1963. Les anomalies magneÂtiques de la Belgique. Institut Royal MeÂteo<strong>ro</strong>logique de Belgique, Publications, Serie A, 38.<br />
De Vuyst, A. <st<strong>ro</strong>ng>and</st<strong>ro</strong>ng> Koenigsfeld, L., 1962. La distribution du champ magneÂtique terrestre en Belgique a l'eÂpoque 1960,5. Institut Royal MeÂteo<strong>ro</strong>logique de Belgique, Publications, Serie A, 30.<br />
12 BGR, Hannover (BOSUM, W.)<br />
Bless, M.J.M., Bosum, W., Bouckaert, J., DuÈ rbaum, H.-J., Kockel, F., Pap<strong>ro</strong>th, E., Querfurth, H. <st<strong>ro</strong>ng>and</st<strong>ro</strong>ng> van Rooyen, P., 1980. Geophysikalische Untersuchungen am Ost-R<st<strong>ro</strong>ng>and</st<strong>ro</strong>ng> des Brabanter Massivs in Belgien, den Niederl<st<strong>ro</strong>ng>and</st<strong>ro</strong>ng>en<br />
und der Bundesrepublik Deutschl<st<strong>ro</strong>ng>and</st<strong>ro</strong>ng>. Mededelingen Rijks Geologische Dienst, 32-17, Haarlem.<br />
13 Veldkamp, J., 1951. The <st<strong>ro</strong>ng>geo</st<strong>ro</strong>ng>magnetic ®eld of The Netherl<st<strong>ro</strong>ng>and</st<strong>ro</strong>ng>s r<st<strong>ro</strong>ng>edu</st<strong>ro</strong>ng>ced to 1945.0. Koninklijk Nederl<st<strong>ro</strong>ng>and</st<strong>ro</strong>ng>s Mete<strong>ro</strong>logisch Instituut, 134.<br />
14 University of Utrecht (COLLETTE, B.J.)<br />
15 Deutsches Hyd<strong>ro</strong>graphisches Institut, Hamburg (VOPPEL, D.)<br />
16 Danish Meteo<strong>ro</strong>logical Institute, Copenhagen (LAURIDSEN, E.K.)<br />
Hansen, H.A., 1983. The <st<strong>ro</strong>ng>geo</st<strong>ro</strong>ng>magnetic elements in Denmark 1928±80. Det Danske Meteo<strong>ro</strong>logiske Institut, Geofysisk Afdeling, Copenhagen.<br />
17, 18 Geological Survey of Denmark, Copenhagen (DINESEN, A. & HANSEN, C.F.)<br />
19 Geological Survey of Norway, T<strong>ro</strong>ndheim (HAÊBREKKE, H.)<br />
20 AÊ m, K., 1970. Ae<strong>ro</strong>magnetic Investigations on the Continental Shelf of Norway, Stad - Lofoten (62±69°N). Norges Geologiske UndersoÈkelse, 266, 49±61, Oslo.<br />
21 Geological Survey of Norway, T<strong>ro</strong>ndheim <st<strong>ro</strong>ng>and</st<strong>ro</strong>ng> Geological Survey of Sweden, Uppsala <st<strong>ro</strong>ng>and</st<strong>ro</strong>ng> Geological Survey of Finl<st<strong>ro</strong>ng>and</st<strong>ro</strong>ng>, Espoo (KORHONEN, J.)<br />
Geological Surveys of Finl<st<strong>ro</strong>ng>and</st<strong>ro</strong>ng>, Norway <st<strong>ro</strong>ng>and</st<strong>ro</strong>ng> Sweden, 1986. Ae<strong>ro</strong>magnetic Anomaly Map <st<strong>ro</strong>ng>Northern</st<strong>ro</strong>ng> Fennosc<st<strong>ro</strong>ng>and</st<strong>ro</strong>ng>ia, Total Intensity Referred to DGRF-65, scale 1:1 000 000.<br />
22 Svenska Pet<strong>ro</strong>leum Exploration AB, Stockholm (LINDER, F. & STROÈM, R.G.)<br />
Fairey Surveys, 1971. Ae<strong>ro</strong>magnetic Survey of the Baltic Sea off the East Coast of Sweden. Operational Report. [unpubl.].<br />
212 Ó 2001 Blackwell Science Ltd
Terra Nova, Vol 13, No. 3, 203±213<br />
T. Wonik et al. · <st<strong>ro</strong>ng>Magnetic</st<strong>ro</strong>ng> <st<strong>ro</strong>ng>anomaly</st<strong>ro</strong>ng> <st<strong>ro</strong>ng>map</st<strong>ro</strong>ng><br />
.............................................................................................................................................................<br />
23 Geological Survey of Finl<st<strong>ro</strong>ng>and</st<strong>ro</strong>ng>, Espoo (KORHONEN, J. & KORPELA, K.)<br />
Korhonen, J., 1989. Ae<strong>ro</strong>magnetic Map of Finl<st<strong>ro</strong>ng>and</st<strong>ro</strong>ng>, DGRF-65 <st<strong>ro</strong>ng>anomaly</st<strong>ro</strong>ng> of total intensity. Geological Survey of Finl<st<strong>ro</strong>ng>and</st<strong>ro</strong>ng>, Geophysics Department, open ®le <st<strong>ro</strong>ng>map</st<strong>ro</strong>ng> Q22.92/89.<br />
24 Geological Survey of Sweden, Uppsala (BORG, K. & HOLDAR, B.)<br />
Eleman, F., Borg, K. <st<strong>ro</strong>ng>and</st<strong>ro</strong>ng> OÈ quist, U., 1969. The ae<strong>ro</strong>magnetic survey of Denmark, Finl<st<strong>ro</strong>ng>and</st<strong>ro</strong>ng>, Norway, Sweden 1965. Contribution to the World <st<strong>ro</strong>ng>Magnetic</st<strong>ro</strong>ng> Survey. Swedish Board of Shipping <st<strong>ro</strong>ng>and</st<strong>ro</strong>ng> Navigation, Stockholm.<br />
Geological Survey of Sweden, 1983. Ae<strong>ro</strong>magnetic <st<strong>ro</strong>ng>anomaly</st<strong>ro</strong>ng> <st<strong>ro</strong>ng>map</st<strong>ro</strong>ng> of Sc<st<strong>ro</strong>ng>and</st<strong>ro</strong>ng>inavia. Total intensity referred to IGRF-65 1:2 500 000. Cb 22/Jordmagnetiska Publikationer 22:1 coloured <st<strong>ro</strong>ng>map</st<strong>ro</strong>ng>, Uppsala.<br />
25 Avery, O.E., Burton, G.D. <st<strong>ro</strong>ng>and</st<strong>ro</strong>ng> Heirtzler, J.R., 1968. An ae<strong>ro</strong>magnetic survey of the Norwegian Sea. J. Geophys. Res., 73, 4583±4600.<br />
Simonenko, T.N. <st<strong>ro</strong>ng>and</st<strong>ro</strong>ng> Pashkevitch, I.K. (eds.), 1990. <st<strong>ro</strong>ng>Magnetic</st<strong>ro</strong>ng> <st<strong>ro</strong>ng>anomaly</st<strong>ro</strong>ng> <st<strong>ro</strong>ng>map</st<strong>ro</strong>ng> of Eu<strong>ro</strong>pe, 1:5 000 000 ± Compiled by Mochionaia, V.A., Sikan, T.A., Smirnov, I.V., Academy of Sciences of the Ukrainian SSR),<br />
Subbotin, S.I., Institute of Geophysics Kiev) <st<strong>ro</strong>ng>and</st<strong>ro</strong>ng> Plekhanov, G.V., Mining Institute Leningrad)<br />
26 Akademie der Wissenschaften der DDR, Heinrich-Hertz-Institut fuÈ r AtmosphaÈren<st<strong>ro</strong>ng>for</st<strong>ro</strong>ng>schung und Geomagnetismus, Berlin (MUNDT, W.)<br />
Bolz, H., Kautzleben, H., Mundt, W. <st<strong>ro</strong>ng>and</st<strong>ro</strong>ng> Wolter, H., 1969. Die magnetische L<st<strong>ro</strong>ng>and</st<strong>ro</strong>ng>esvermessung der Deutschen Demokratischen Republik zur Epoche 1957,5 - Ergebnisse und Auswertung.<br />
Deutsche Akademie der Wissenschaften zu Berlin, Geomagnetisches Institut Potsdam, 41, 197±219.<br />
27 Geophysik GGD Leipzig, Leipzig (SCHEIBE, R. & LINDNER, H.)<br />
28 Bouska, J., Bucha, V. <st<strong>ro</strong>ng>and</st<strong>ro</strong>ng> Koci, A., 1959. Geomagnetische Karten der Tschechoslowakischen Republik fuÈ r die Epoche 1958,0. Travaux de l'Institut GeÂophysique de l'Academie Tchechoslovaque des Sciences, 112,<br />
Geofysikalni Sbornik, NCSAV, Prag.<br />
29 Krajcovic, S. <st<strong>ro</strong>ng>and</st<strong>ro</strong>ng> Nemeth, M., 1972. Distribution of the <st<strong>ro</strong>ng>geo</st<strong>ro</strong>ng>magnetic ®eld in Slovakia <st<strong>ro</strong>ng>for</st<strong>ro</strong>ng> the epoch 1967.5. Contributions of the Geophysical Institute of the Slovak Academy of Sciences, 3, Prague.<br />
30 GyoÈ rgy, S., 1966. Magya<strong>ro</strong>rsza gFoÈ ldma gneses TeÂrkeÂpe. A FuÈ ggoÈ leges TeÂre<strong>ro</strong>È sseÂg Anoma liaÂi, 1:500 000. Magyar A llami EoÈ tvoÈ s Lora nd Geo®zikai InteÂzet, Geo®zikai KoÈ zlemeÂnyek, XVI, 4, Budapest.<br />
Airinei, S., Stoenescu, S., Velcescu, G., Romanescu, D., Visarion, M., Radan, S., Roth, M., Besutiu, L. <st<strong>ro</strong>ng>and</st<strong>ro</strong>ng> Besutiu, G., 1983. Carte de l'Anomalie MagneÂtique DZ pour le Territoire de la Roumanie. Annuaire de l'Institut de<br />
GeÂologie et de GeÂophysique, LXIII, Bukarest.<br />
Polish Geological Institute, Warsaw (WYBRANIEC, S.)<br />
K<strong>ro</strong>likowski, E. <st<strong>ro</strong>ng>and</st<strong>ro</strong>ng> Wybraniec, S., 1996. Gravity <st<strong>ro</strong>ng>and</st<strong>ro</strong>ng> magnetic <st<strong>ro</strong>ng>map</st<strong>ro</strong>ng>s of Pol<st<strong>ro</strong>ng>and</st<strong>ro</strong>ng> ± historical backg<strong>ro</strong>und <st<strong>ro</strong>ng>and</st<strong>ro</strong>ng> modern presentation. Publs. Inst. Geophys. Pol. Acad. Sci., M-18, 273, 87±92, Warsaw.<br />
33 National University of Irel<st<strong>ro</strong>ng>and</st<strong>ro</strong>ng>, Galway (MURPHY, C. & BROCK, A.) <st<strong>ro</strong>ng>and</st<strong>ro</strong>ng> Geological Survey of Canada, Dartmouth (MACNAB, R.) <st<strong>ro</strong>ng>and</st<strong>ro</strong>ng> Pet<strong>ro</strong>leum Affairs Division, Dublin (CROKER, P.)<br />
Murphy, C.A., 1993. Geophysical studies of the continental shelf offshore southern Irel<st<strong>ro</strong>ng>and</st<strong>ro</strong>ng>. Unpubl. doctoral dissertation, National University of Irel<st<strong>ro</strong>ng>and</st<strong>ro</strong>ng>, Galway, Irel<st<strong>ro</strong>ng>and</st<strong>ro</strong>ng>.<br />
B<strong>ro</strong>ck, A., Con<strong>ro</strong>y, J.J. <st<strong>ro</strong>ng>and</st<strong>ro</strong>ng> Murphy, C.A., 1996. <st<strong>ro</strong>ng>Magnetic</st<strong>ro</strong>ng> <st<strong>ro</strong>ng>and</st<strong>ro</strong>ng> gravity ®eld results f<strong>ro</strong>m the Porcupine Basin <st<strong>ro</strong>ng>and</st<strong>ro</strong>ng> Celtic Sea: the contribution of potential ®eld methods to the study of Irish continental shelf crustal structure.<br />
In: Irish Marine Science (B.F. Keegan <st<strong>ro</strong>ng>and</st<strong>ro</strong>ng> R. O'Connor, eds.), pp. 485±494. Galway University Press, Galway.<br />
34 Geological Survey of Irel<st<strong>ro</strong>ng>and</st<strong>ro</strong>ng>, Dublin (INAMDAR, D.)<br />
Max, M.D. <st<strong>ro</strong>ng>and</st<strong>ro</strong>ng> Inamdar, D.D., 1985. <st<strong>ro</strong>ng>Magnetic</st<strong>ro</strong>ng> <st<strong>ro</strong>ng>and</st<strong>ro</strong>ng> generalised <st<strong>ro</strong>ng>geo</st<strong>ro</strong>ng>logical compilation <st<strong>ro</strong>ng>map</st<strong>ro</strong>ng> of Irel<st<strong>ro</strong>ng>and</st<strong>ro</strong>ng>, 1:1 000 000. Geological Survey of Irel<st<strong>ro</strong>ng>and</st<strong>ro</strong>ng>.<br />
35 British Geological Survey, Keyworth (LEE, M. & SMITH, I.F.)<br />
British Geological Survey, 1998. Colour shaded relief magnetic <st<strong>ro</strong>ng>anomaly</st<strong>ro</strong>ng> <st<strong>ro</strong>ng>map</st<strong>ro</strong>ng> of Britain, Irel<st<strong>ro</strong>ng>and</st<strong>ro</strong>ng> <st<strong>ro</strong>ng>and</st<strong>ro</strong>ng> adjacent areas. Compiled by Royles, C.P. <st<strong>ro</strong>ng>and</st<strong>ro</strong>ng> Smith, I.F., 1:1 500 000 scale, Keyworth.<br />
36 Maka<strong>ro</strong>va, Z.A. (ed.), 1977. Map of the anomalous magnetic ®eld (DT)a of the USSR, scale 1:2 500 000, 16 sheets. Ministerstvo Geologii SSSR, Moscow (in Russian).<br />
Simonenko, T.N. <st<strong>ro</strong>ng>and</st<strong>ro</strong>ng> Pashkevitch, I.K. (eds), 1990. <st<strong>ro</strong>ng>Magnetic</st<strong>ro</strong>ng> <st<strong>ro</strong>ng>anomaly</st<strong>ro</strong>ng> <st<strong>ro</strong>ng>map</st<strong>ro</strong>ng> of Eu<strong>ro</strong>pe, 1:5 000 000. Compiled by Mochionaia, V.A., Sikan, T.A., Smirnov, I.V. (Academy of Sciences of the Ukrainian SSR), Subbotin, S.I.<br />
(Institute of Geophysics Kiev) <st<strong>ro</strong>ng>and</st<strong>ro</strong>ng> Plekhanov, G.V. (Mining Institute Leningrad).<br />
Smyslov, A.A., Dortman, N.B. <st<strong>ro</strong>ng>and</st<strong>ro</strong>ng> Sytin, Y.I., 1978. Map of the anomalous magnetic ®eld, (DT)a, of the territory of the USSR <st<strong>ro</strong>ng>and</st<strong>ro</strong>ng> some adjacent water areas, 1:10 000 000. Ministry of Geology, Leningrad.<br />
Ó 2001 Blackwell Science Ltd 213