Geological Survey of Denmark and Greenland Bulletin 26 ... - GEUS
Geological Survey of Denmark and Greenland Bulletin 26 ... - GEUS
Geological Survey of Denmark and Greenland Bulletin 26 ... - GEUS

Create successful ePaper yourself
Turn your PDF publications into a flip-book with our unique Google optimized e-Paper software.
Amp. (counts)<br />
Frequency (Hz)<br />
90<br />
50<br />
0<br />
0<br />
–50<br />
–100<br />
16<br />
14<br />
12<br />
10<br />
8<br />
6<br />
4<br />
2<br />
0<br />
Vertical component<br />
100 200 300 400 500 600 700 800 900 1000 1100 1200 1300 1400 1500 1600<br />
Time (sec.)<br />
0 100 200 300 400 500 600 700 800 900 1000 1100 1200 1300 1400 1500 1600<br />
Time (sec.)<br />
F = 16 Hz<br />
F = 14 Hz<br />
F = 12 Hz<br />
100<br />
50<br />
0<br />
100<br />
0<br />
100<br />
0<br />
F = 10 Hz 200<br />
F = 8 Hz<br />
F = 6 Hz<br />
F = 4 Hz<br />
F = 2 Hz<br />
0<br />
250<br />
0<br />
500<br />
0<br />
500<br />
0<br />
500<br />
0<br />
0 200 400 600 800 1000 1200 1400 1600<br />
Time (sec.)<br />
A<br />
B<br />
C<br />
60<br />
50<br />
40<br />
30<br />
20<br />
10<br />
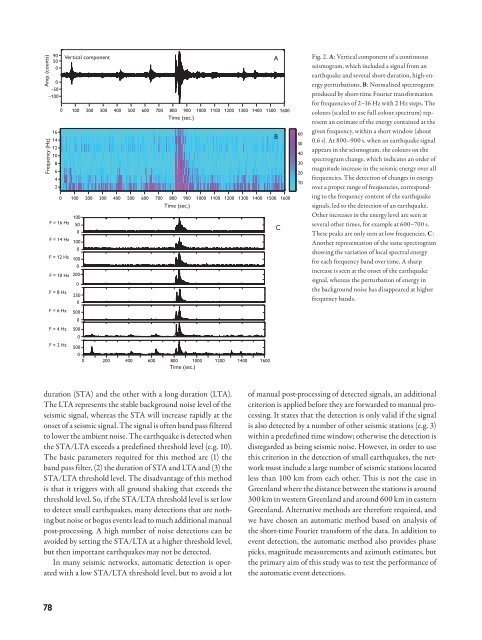
Fig. 2. A: Vertical component <strong>of</strong> a continuous<br />
seismogram, which included a signal from an<br />
earthquake <strong>and</strong> several short-duration, high-energy<br />
perturbations. B: Normalised spectrogram<br />
produced by short-time Fourier transformation<br />
for frequencies <strong>of</strong> 2–16 Hz with 2 Hz steps. The<br />
colours (scaled to use full colour spectrum) represent<br />
an estimate <strong>of</strong> the energy contained at the<br />
given frequency, within a short window (about<br />
0.6 s). At 800–900 s, when an earthquake signal<br />
appears in the seismogram, the colours on the<br />
spectrogram change, which indicates an order <strong>of</strong><br />
magnitude increase in the seismic energy over all<br />
frequencies. The detection <strong>of</strong> changes in energy<br />
over a proper range <strong>of</strong> frequencies, corresponding<br />
to the frequency content <strong>of</strong> the earthquake<br />
signals, led to the detection <strong>of</strong> an earthquake.<br />
Other increases in the energy level are seen at<br />
several other times, for example at 600–700 s.<br />
These peaks are only seen at low frequencies. C:<br />
Another representation <strong>of</strong> the same spectrogram<br />
showing the variation <strong>of</strong> local spectral energy<br />
for each frequency b<strong>and</strong> over time. A sharp<br />
increase is seen at the onset <strong>of</strong> the earthquake<br />
signal, whereas the perturbation <strong>of</strong> energy in<br />
the background noise has disappeared at higher<br />
frequency b<strong>and</strong>s.<br />
duration (STA) <strong>and</strong> the other with a long duration (LTA).<br />
The LTA represents the stable background noise level <strong>of</strong> the<br />
seismic signal, whereas the STA will increase rapidly at the<br />
onset <strong>of</strong> a seismic signal. The signal is <strong>of</strong>ten b<strong>and</strong> pass filtered<br />
to lower the ambient noise. The earthquake is detected when<br />
the STA/LTA exceeds a predefined threshold level (e.g. 10).<br />
The basic parameters required for this method are (1) the<br />
b<strong>and</strong> pass filter, (2) the duration <strong>of</strong> STA <strong>and</strong> LTA <strong>and</strong> (3) the<br />
STA/LTA threshold level. The disadvantage <strong>of</strong> this method<br />
is that it triggers with all ground shaking that exceeds the<br />
threshold level. So, if the STA/LTA threshold level is set low<br />
to detect small earthquakes, many detections that are nothing<br />
but noise or bogus events lead to much additional manual<br />
post-processing. A high number <strong>of</strong> noise detections can be<br />
avoided by setting the STA/LTA at a higher threshold level,<br />
but then important earthquakes may not be detected.<br />
In many seismic networks, automatic detection is operated<br />
with a low STA/LTA threshold level, but to avoid a lot<br />
<strong>of</strong> manual post-processing <strong>of</strong> detected signals, an additional<br />
criterion is applied before they are forwarded to manual processing.<br />
It states that the detection is only valid if the signal<br />
is also detected by a number <strong>of</strong> other seismic stations (e.g. 3)<br />
within a predefined time window; otherwise the detection is<br />
disregarded as being seismic noise. However, in order to use<br />
this criterion in the detection <strong>of</strong> small earthquakes, the network<br />
must include a large number <strong>of</strong> seismic stations located<br />
less than 100 km from each other. This is not the case in<br />
Greenl<strong>and</strong> where the distance between the stations is around<br />
300 km in western Greenl<strong>and</strong> <strong>and</strong> around 600 km in eastern<br />
Greenl<strong>and</strong>. Alternative methods are therefore required, <strong>and</strong><br />
we have chosen an automatic method based on analysis <strong>of</strong><br />
the short-time Fourier transform <strong>of</strong> the data. In addition to<br />
event detection, the automatic method also provides phase<br />
picks, magnitude measurements <strong>and</strong> azimuth estimates, but<br />
the primary aim <strong>of</strong> this study was to test the performance <strong>of</strong><br />
the automatic event detections.<br />
78