Portal Project Evaluation Report Executive Summary - University of ...
Portal Project Evaluation Report Executive Summary - University of ...
Portal Project Evaluation Report Executive Summary - University of ...

You also want an ePaper? Increase the reach of your titles
YUMPU automatically turns print PDFs into web optimized ePapers that Google loves.
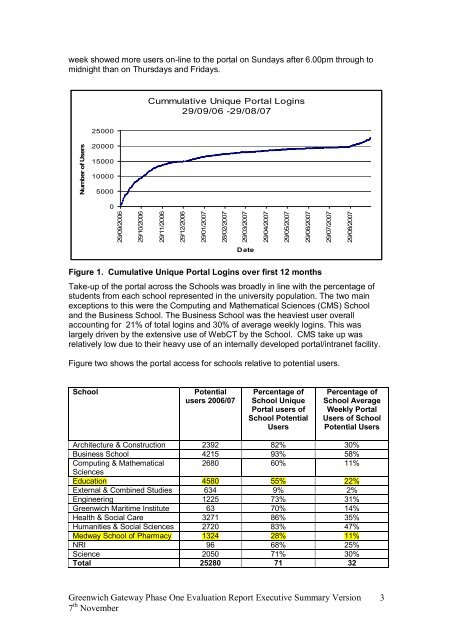
week showed more users online to the portal on Sundays after 6.00pm through to<br />
midnight than on Thursdays and Fridays.<br />
Cummulative Unique <strong>Portal</strong> Logins<br />
29/09/06 29/08/07<br />
25000<br />
Number <strong>of</strong> Users<br />
20000<br />
15000<br />
10000<br />
5000<br />
0<br />
29/09/2006<br />
29/10/2006<br />
29/11/2006<br />
29/12/2006<br />
29/01/2007<br />
28/02/2007<br />
29/03/2007<br />
29/04/2007<br />
29/05/2007<br />
29/06/2007<br />
29/07/2007<br />
29/08/2007<br />
Date<br />
Figure 1. Cumulative Unique <strong>Portal</strong> Logins over first 12 months<br />
Takeup <strong>of</strong> the portal across the Schools was broadly in line with the percentage <strong>of</strong><br />
students from each school represented in the university population. The two main<br />
exceptions to this were the Computing and Mathematical Sciences (CMS) School<br />
and the Business School. The Business School was the heaviest user overall<br />
accounting for 21% <strong>of</strong> total logins and 30% <strong>of</strong> average weekly logins. This was<br />
largely driven by the extensive use <strong>of</strong> WebCT by the School. CMS take up was<br />
relatively low due to their heavy use <strong>of</strong> an internally developed portal/intranet facility.<br />
Figure two shows the portal access for schools relative to potential users.<br />
School<br />
Potential<br />
users 2006/07<br />
Percentage <strong>of</strong><br />
School Unique<br />
<strong>Portal</strong> users <strong>of</strong><br />
School Potential<br />
Users<br />
Percentage <strong>of</strong><br />
School Average<br />
Weekly <strong>Portal</strong><br />
Users <strong>of</strong> School<br />
Potential Users<br />
Architecture & Construction 2392 82% 30%<br />
Business School 4215 93% 58%<br />
Computing & Mathematical 2680 60% 11%<br />
Sciences<br />
Education 4580 55% 22%<br />
External & Combined Studies 634 9% 2%<br />
Engineering 1225 73% 31%<br />
Greenwich Maritime Institute 63 70% 14%<br />
Health & Social Care 3271 86% 35%<br />
Humanities & Social Sciences 2720 83% 47%<br />
Medway School <strong>of</strong> Pharmacy 1324 28% 11%<br />
NRI 96 68% 25%<br />
Science 2050 71% 30%<br />
Total 25280 71 32<br />
Greenwich Gateway Phase One <strong>Evaluation</strong> <strong>Report</strong> <strong>Executive</strong> <strong>Summary</strong> Version<br />
7 th November<br />
3