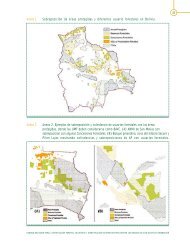
Assessment of approaches to identify areas with special importance ...
Assessment of approaches to identify areas with special importance ...
Assessment of approaches to identify areas with special importance ...

Create successful ePaper yourself
Turn your PDF publications into a flip-book with our unique Google optimized e-Paper software.
School <strong>of</strong> Forest Science and Resource Management<br />
Technische Universität München<br />
Master <strong>of</strong> Science in Sustainable Resource Management<br />
Winter Semester 2009/2010<br />
<strong>Assessment</strong> <strong>of</strong> <strong>approaches</strong> <strong>to</strong> <strong>identify</strong> <strong>areas</strong> <strong>with</strong><br />
<strong>special</strong> <strong>importance</strong> for biodiversity conservation<br />
in comparison <strong>to</strong> the HCV concept<br />
A Master's thesis in cooperation <strong>with</strong> the Deutsche Gesellschaft für Technische<br />
Zusammenarbeit (GTZ) GmbH – Programme Office for Social and Ecological<br />
Standards<br />
Elaborated by: Katrina Bayer<br />
Elaborated in: Munich, Germany<br />
Submitted on: 30.03.2010<br />
First Pr<strong>of</strong>essor in charge <strong>of</strong> Master’s thesis:<br />
Dipl. Geogr. Sandra Fohlmeister<br />
Second Pr<strong>of</strong>essor in charge <strong>of</strong> Master’s thesis: Dr. Wolfgang Zehlius-Eckert
Table <strong>of</strong> Contents<br />
Abstract .......................................................................................................................... vi<br />
Acknowledgements ....................................................................................................... vii<br />
List <strong>of</strong> Figures ............................................................................................................... viii<br />
List <strong>of</strong> Tables .................................................................................................................. ix<br />
Abbreviations .................................................................................................................. x<br />
1. Introduction .................................................................................................................. 1<br />
1.1 Background ............................................................................................................. 1<br />
1.2 Problem Statement and Research Gaps ................................................................. 2<br />
1.3 Objectives <strong>of</strong> Thesis ................................................................................................ 3<br />
2. Methodology ................................................................................................................. 4<br />
2.1 Overview <strong>of</strong> Methodology ........................................................................................ 4<br />
2.2 Description <strong>of</strong> Methodological Steps ....................................................................... 5<br />
2.2.1 First Literature Research .................................................................................. 5<br />
2.2.1.1 Development <strong>of</strong> Key Questions and Criteria ................................................. 5<br />
2.2.1.2 Choice <strong>of</strong> Approaches for <strong>Assessment</strong> ......................................................... 6<br />
2.2.2 Set <strong>of</strong> Key Questions and Criteria .................................................................... 6<br />
2.2.3 Second Literature Research ............................................................................. 9<br />
2.2.4 Semi-Structured Interviews .............................................................................. 9<br />
2.2.5 Design <strong>of</strong> <strong>Assessment</strong> Methodology .............................................................. 10<br />
2.2.6 Strength-Weakness Analysis.......................................................................... 11<br />
2.2.7 Additional Criteria ........................................................................................... 15<br />
3. Case Study Selection ................................................................................................. 17<br />
3.1 Possible and Selected Approaches ....................................................................... 17<br />
3.2 Rationale behind Approach Selection .................................................................... 18<br />
3.3 Case Study Approach Pr<strong>of</strong>iles ............................................................................... 19<br />
3.3.1 High Conservation Value (HCV) Concept ....................................................... 19<br />
3.3.2 Key Biodiversity Areas (KBA) Approach ......................................................... 20<br />
3.3.3 Ecoregion-Based Conservation (ERBC) Approach ......................................... 21<br />
3.3.4 Focal Species Approach (FSA) ...................................................................... 22<br />
3.3.5 Rapid Ecological <strong>Assessment</strong> (REA).............................................................. 23
3.4 Interim Discussion ................................................................................................. 24<br />
4. Results ........................................................................................................................ 28<br />
4.1 Pre-<strong>Assessment</strong> – Comparison <strong>of</strong> Site Identification Criteria ................................. 28<br />
4.1.1 Site Identification Criteria and their Characteristics ........................................ 28<br />
4.1.1.1 Species Specific Criteria ............................................................................. 29<br />
4.1.1.2 Ecosystem Specific Criteria ........................................................................ 30<br />
4.1.1.3 Site Specific Criteria ................................................................................... 32<br />
4.1.2 Explana<strong>to</strong>ry Notes <strong>to</strong> Approach Criteria Comparison ..................................... 34<br />
4.1.2.1 High Conservation Value (HCV) Concept ................................................... 34<br />
4.1.2.2 Key Biodiversity Areas (KBA) Approach ..................................................... 34<br />
4.1.2.3 Ecoregion-Based Conservation (ERBC) Approach ..................................... 35<br />
4.1.2.4 Focal Species Approach (FSA)................................................................... 36<br />
4.1.2.5 Rapid Ecological <strong>Assessment</strong> (REA) .......................................................... 38<br />
4.1.3 Interim Summary I .......................................................................................... 39<br />
4.2 Strength-Weakness Analysis (SWA) ..................................................................... 41<br />
4.2.1 Overview: Strength-Weakness Analysis Criteria <strong>Assessment</strong> Results ............ 43<br />
4.2.2 Strength-Weakness Pr<strong>of</strong>iles <strong>of</strong> Selected Approaches .................................... 46<br />
4.2.2.1 Pr<strong>of</strong>ile <strong>of</strong> High Conservation Value (HCV) Concept .................................... 47<br />
4.2.2.2 Pr<strong>of</strong>ile <strong>of</strong> Key Biodiversity Areas (KBA) Approach ...................................... 49<br />
4.2.2.3 Pr<strong>of</strong>ile <strong>of</strong> Ecoregion-Based Conservation (ERBC) Approach ...................... 52<br />
4.2.2.4 Pr<strong>of</strong>ile <strong>of</strong> Focal Species Approach (FSA).................................................... 55<br />
4.2.2.5 Pr<strong>of</strong>ile <strong>of</strong> Rapid Ecological <strong>Assessment</strong> (REA) ........................................... 57<br />
4.2.3 Interim Summary II ......................................................................................... 59<br />
4.3 Additional Criteria Analysis .................................................................................... 60<br />
4.3.1 Methods for Site Choice ................................................................................. 62<br />
4.3.1.1 High Conservation Value (HCV) Concept ................................................... 65<br />
4.3.1.2 Key Biodiversity Areas (KBA) Approach ..................................................... 66<br />
4.3.1.3 Ecoregion-Based Conservation (ERBC) Approach ..................................... 67<br />
4.3.1.4 Focal Species Approach (FSA)................................................................... 68<br />
4.3.1.5 Rapid Ecological <strong>Assessment</strong> (REA) .......................................................... 69<br />
4.3.2 Required Resources ...................................................................................... 71<br />
4.3.2.1 High Conservation Value (HCV) Concept ................................................... 72<br />
4.3.2.2 Key Biodiversity Areas (KBA) Approach ..................................................... 73<br />
4.3.2.3 Ecoregion-Based Conservation (ERBC) Approach ..................................... 74<br />
4.3.2.4 Focal Species Approach (FSA)................................................................... 74
4.3.2.5 Rapid Ecological <strong>Assessment</strong> (REA) .......................................................... 74<br />
4.3.3 Data Requirements ........................................................................................ 75<br />
4.3.3.1 Use <strong>of</strong> Existing Data ................................................................................... 76<br />
4.3.3.2 Data Acquisition .......................................................................................... 79<br />
4.3.3.3 Data Validation ........................................................................................... 81<br />
4.3.3.4 Use <strong>of</strong> Remote Sensing .............................................................................. 83<br />
4.3.4 Interim Summary III ........................................................................................ 85<br />
4.4 Summary ............................................................................................................... 90<br />
5. Discussion .................................................................................................................. 94<br />
6. Conclusion ................................................................................................................ 101<br />
7. General Terms .......................................................................................................... 105<br />
References ................................................................................................................. 113<br />
Appendices ............................................................................................................... 123<br />
A1 Explanations <strong>to</strong> Key Questions, Criteria and Sub-Criteria ........................................... 123<br />
A2 Semi-structured Interview Guideline ........................................................................... 128<br />
A3 List <strong>of</strong> Interview Partners ............................................................................................ 131<br />
A4 Interview Reports ....................................................................................................... 132<br />
A5 Strength-Weakness Analyses: Detailed <strong>Assessment</strong> Results ..................................... 187<br />
A6 Methods for Site Choice: Detailed <strong>Assessment</strong> Results ............................................. 201<br />
A7 Required Resources: Detailed <strong>Assessment</strong> Results ................................................... 206<br />
A8 Data Requirements: Detailed <strong>Assessment</strong> Results ..................................................... 210
ABSTRACT<br />
Abstract<br />
This thesis has assessed a range <strong>of</strong> local and regional conservation <strong>approaches</strong> used <strong>to</strong><br />
<strong>identify</strong> <strong>areas</strong> important for biodiversity conservation. The selected <strong>approaches</strong>, namely the<br />
Key Biodiversity Approach (KBA) approach, the Ecoregion-Based Conservation (ERBC)<br />
approach, the Focal Species Approach (FSA) and the Rapid Ecological <strong>Assessment</strong> (REA)<br />
were compared <strong>to</strong> the High Conservation Value (HCV) concept by detecting strengths and<br />
weaknesses, establishing similarities and differences and <strong>identify</strong>ing their input requirements,<br />
<strong>with</strong> the ultimate goal <strong>of</strong> determining their efficiency. To draw the final conclusions presented<br />
in this thesis, a three-step analysis was undertaken. First, the <strong>approaches</strong> were described<br />
and compared based on their criteria for site identification, the scale they address and their<br />
objectives. Second, strength-weakness pr<strong>of</strong>iles for the <strong>approaches</strong>, based on a set <strong>of</strong> key<br />
questions and criteria were established. Third, the <strong>approaches</strong> were ranked according <strong>to</strong><br />
their input requirements.<br />
In line <strong>with</strong> contemporary literature and expert opinion, this thesis concluded that the HCV<br />
concept is a flexible, versatile approach, receiving the second strongest strength-weakness<br />
pr<strong>of</strong>ile and requiring the least amount <strong>of</strong> resources. In comparison, the results obtained for<br />
the KBA approach were in contradiction <strong>to</strong> its popularity amongst leading international<br />
organisations, as it obtained an outcome showing deficiencies in the strength-weakness<br />
analysis and its input requirements. The ERBC approach received excellent results, albeit<br />
<strong>with</strong> the highest input requirements, both aspects being in agreement <strong>with</strong> expert opinion.<br />
The assessment <strong>of</strong> the FSA concurred <strong>with</strong> existing literature, although this was rather due <strong>to</strong><br />
its shortcomings reflected in the weak results obtained. This approach does, however, have<br />
low resource requirements. Finally, the REA showed an extremely comprehensive, yet<br />
successful, assessment performance, reflected in its input requirements and coinciding <strong>with</strong><br />
expert opinion. Overall and considering their differing objectives, the HCV concept, the<br />
ERBC approach and the REA received the best results for this assessment.<br />
The lack <strong>of</strong> accessible data on effectiveness prevented an assessment <strong>of</strong> the efficiency <strong>of</strong><br />
the <strong>approaches</strong> <strong>to</strong> be fulfilled. Future research in this direction would firstly provide a better<br />
understanding <strong>of</strong> the <strong>approaches</strong> and secondly, and perhaps more importantly, give an<br />
indication <strong>of</strong> the cost-benefit <strong>of</strong> the <strong>approaches</strong>. Therefore, implementation success could be<br />
increased by more easily convincing decision makers <strong>of</strong> their individual worth.<br />
vi
ACKNOWLEDGEMENTS<br />
Acknowledgements<br />
First <strong>of</strong> all, I would like <strong>to</strong> express my gratitude <strong>to</strong> the Deutsche Gesellschaft für Technische<br />
Zusammenarbeit (GTZ) GmbH – Programme Office for Social and Ecological Standards for<br />
the initial idea and permission <strong>to</strong> carry out this research, in particular Ms Rosemarie Metz<br />
and Ms Laura Meissner.<br />
Furthermore, I am indebted <strong>to</strong> all interview partners who kindly provided me <strong>with</strong> valuable<br />
information, <strong>with</strong>out which this thesis would not have been possible.<br />
A <strong>special</strong> thanks goes <strong>to</strong> Dr. Chris<strong>to</strong>pher Stewart and Mr. Edward Pollard for their additional<br />
insights and advice, as well as <strong>to</strong> Dr. Klaus Wagner for his recommendations on semistructured<br />
interviews.<br />
Finally, I would like <strong>to</strong> express my great appreciation <strong>to</strong> my advisors, Dipl. Geogr. Sandra<br />
Fohlmeister and Dr. Wolfgang Zehlius-Eckert for their dedicated support and guidance.<br />
vii
LIST OF FIGURES<br />
List <strong>of</strong> Figures<br />
Figure 1: Research methodology ........................................................................................... 4<br />
Figure 2: Overview <strong>of</strong> groups based on pressure-state-response system .............................. 6<br />
Figure 3: Overview <strong>of</strong> assessment methodology ................................................................. 10<br />
Figure 4: Spatial scales addressed by <strong>approaches</strong> .............................................................. 26<br />
Figure 5: Overview <strong>of</strong> criteria used for site identification ...................................................... 28<br />
Figure 6: Overview <strong>of</strong> criteria adopted for site identification ................................................. 39<br />
Figure 7: Overview <strong>of</strong> criteria assessment: focus on strength-weakness analysis ............... 42<br />
Figure 8: Example <strong>of</strong> strength-weakness pr<strong>of</strong>ile scheme ..................................................... 46<br />
Figure 9: HCV strength-weakness pr<strong>of</strong>ile ............................................................................ 47<br />
Figure 10: KBA strength-weakness pr<strong>of</strong>ile ........................................................................... 49<br />
Figure 11: ERBC strength-weakness pr<strong>of</strong>ile ........................................................................ 52<br />
Figure 12: FSA strength-weakness pr<strong>of</strong>ile ........................................................................... 55<br />
Figure 13: REA strength-weakness pr<strong>of</strong>ile .......................................................................... 57<br />
Figure 14: Overview <strong>of</strong> all strength-weakness pr<strong>of</strong>iles ......................................................... 59<br />
Figure 15: Overview <strong>of</strong> criteria assessment: focus on ranking ............................................. 60<br />
Figure 16: Overview <strong>of</strong> additional criteria ............................................................................. 61<br />
Figure 17: Overview <strong>of</strong> methods employed for site choice ................................................... 62<br />
Figure 18: Methods employed for site identification ............................................................. 63<br />
Figure 19: Overview <strong>of</strong> sub-criteria for data requirements ................................................... 75<br />
Figure 20: Overview <strong>of</strong> existing data sources ...................................................................... 76<br />
Figure 21: Examples <strong>of</strong> existing data sources ..................................................................... 77<br />
Figure 22: Overview <strong>of</strong> methods employed for data acquisition ........................................... 79<br />
Figure 23: Overview <strong>of</strong> validation <strong>to</strong>ols ................................................................................ 81<br />
Figure 24: Overview <strong>of</strong> employed remote sensing technology ............................................. 83<br />
Figure 25: Overview <strong>of</strong> results: strength-weakness pr<strong>of</strong>iles ................................................. 92<br />
Figure 26: Overview <strong>of</strong> results: additional criteria ................................................................ 92<br />
viii
LIST OF TABLES<br />
List <strong>of</strong> Tables<br />
Table 1: Overview <strong>of</strong> key questions, criteria and sub-criteria ................................................. 7<br />
Table 2: Defined classification values for key questions and criteria .................................... 12<br />
Table 3: Ordinal ranking system for additional criteria and sub-criteria ................................ 16<br />
Table 4: List <strong>of</strong> possible <strong>approaches</strong> ................................................................................... 17<br />
Table 5: Approach objectives .............................................................................................. 24<br />
Table 6: Comparison <strong>of</strong> <strong>approaches</strong> concerning species specific criteria ............................ 29<br />
Table 7: Comparison <strong>of</strong> <strong>approaches</strong> concerning ecosystem specific criteria ....................... 30<br />
Table 8: Comparison <strong>of</strong> <strong>approaches</strong> concerning site specific criteria ................................... 32<br />
Table 9: Overview: <strong>approaches</strong> according <strong>to</strong> SWA criteria assessment .............................. 44<br />
Table 10: Overview <strong>of</strong> required resources ........................................................................... 71<br />
Table 11: Approach ranking according <strong>to</strong> their methods for site choice ............................... 86<br />
Table 12: Approach ranking according <strong>to</strong> their required resources ...................................... 87<br />
Table 13: Approach ranking according <strong>to</strong> their data sources ............................................... 89<br />
Table 14: Overview <strong>of</strong> classification <strong>of</strong> criteria for strength-weakness analysis .................... 90<br />
Table 15: Ranking overview for Group III criteria and sub-criteria ........................................ 93<br />
Table 16: List <strong>of</strong> all interview partners and their organisations/ companies ........................ 131<br />
Table 17: Overview <strong>of</strong> data obtained for HCV strength-weakness pr<strong>of</strong>ile .......................... 187<br />
Table 18: Overview <strong>of</strong> data obtained for the KBA strength-weakness pr<strong>of</strong>ile ..................... 190<br />
Table 19: Overview <strong>of</strong> data obtained for ERBC strength-weakness pr<strong>of</strong>ile ........................ 193<br />
Table 20: Overview <strong>of</strong> data obtained for the FSA strength-weakness pr<strong>of</strong>ile ..................... 196<br />
Table 21: Overview <strong>of</strong> data obtained for REA strength-weakness pr<strong>of</strong>ile ........................... 199<br />
Table 22: Overview <strong>of</strong> methods employed by the HCV concept for site choice .................. 201<br />
Table 23: Overview <strong>of</strong> methods employed by the KBA approach for site choice ................ 202<br />
Table 24: Overview <strong>of</strong> methods employed by the ERBC approach for site choice ............. 203<br />
Table 25: Overview <strong>of</strong> methods employed by the FSA for site choice................................ 204<br />
Table 26: Overview <strong>of</strong> methods employed by the REA for site choice ............................... 205<br />
Table 27: Overview <strong>of</strong> resources required for the HCV concept ........................................ 206<br />
Table 28: Overview <strong>of</strong> resources required for the KBA and ERBC approach ..................... 208<br />
Table 29: Overview <strong>of</strong> resources required for the FSA and REA ....................................... 209<br />
Table 30: List <strong>of</strong> data required by the HCV concept ........................................................... 210<br />
Table 31: List <strong>of</strong> data required by the KBA approach ......................................................... 211<br />
Table 32: List <strong>of</strong> data required by the ERBC approach ...................................................... 212<br />
Table 33: List <strong>of</strong> data required by the FSA ........................................................................ 213<br />
Table 34: List <strong>of</strong> data required by the REA ........................................................................ 214<br />
ix
ABBREVIATIONS<br />
Abbreviations<br />
AZE<br />
CBD<br />
CI<br />
CITES<br />
CPD<br />
ERBC<br />
FSA<br />
FSC<br />
GTZ<br />
ha<br />
HCV<br />
HCVs<br />
IBA<br />
IPA<br />
IUCN<br />
KBA<br />
N.A.<br />
n.d.<br />
PA<br />
REA<br />
REAs<br />
SWA<br />
TNC<br />
WWF<br />
Alliance for Zero Extinction<br />
Convention on Biological Diversity<br />
Conservation International<br />
Convention on International Trade <strong>of</strong> Endangered Species<br />
Centres <strong>of</strong> Plant Diversity<br />
Ecoregion-based Conservation<br />
Focal Species Approach<br />
Forest Stewardship Council<br />
Deutsche Gesellschaft für Technische Zusammenarbeit GmbH<br />
hectares<br />
High Conservation Value<br />
High Conservation Values<br />
Important Bird Areas<br />
Important Plant Areas<br />
International Union for the Conservation <strong>of</strong> Nature<br />
Key Biodiversity Areas<br />
not applicable<br />
not determined<br />
Protected Area<br />
Rapid Ecological <strong>Assessment</strong><br />
Rapid Ecological <strong>Assessment</strong>s<br />
Strength-Weakness Analysis<br />
The Nature Conservancy<br />
World Wide Fund For Nature<br />
x
1. INTRODUCTION<br />
1. Introduction<br />
1.1 Background<br />
Global biodiversity has been drastically decreasing over the last two centuries as a direct<br />
and indirect consequence <strong>of</strong> human population growth, unsustainable consumption <strong>of</strong><br />
resources and associated environmental changes (Millennium Ecosystem <strong>Assessment</strong><br />
2005b, 96). It is agreed that immediate action is needed <strong>to</strong> defend irreplaceable genes,<br />
species and ecosystems, e<strong>special</strong>ly considering that human welfare development is at risk<br />
under the given circumstances (The World Resources Institute 2010).<br />
There are two main ways <strong>of</strong> protecting these threatened, living resources. The first and more<br />
traditional is <strong>to</strong> protect representative samples <strong>of</strong> habitats and their constituents, in a network<br />
<strong>of</strong> protected <strong>areas</strong>. The second is <strong>to</strong> conserve biodiversity in non-protected <strong>areas</strong> (i.e. mixed<br />
use or production <strong>areas</strong>) (Interview Partner A).<br />
Protected <strong>areas</strong> are essential means for saving biodiversity (Dudley 2008, 2). However, in<br />
the past, the planning and establishment <strong>of</strong> new protected <strong>areas</strong> has, in general, been<br />
neither systematic nor strategic. It has generally been designated in an ad hoc fashion, <strong>of</strong>ten<br />
based on fac<strong>to</strong>rs such as opportunity (i.e. not valuable for land use), scenery, recreation,<br />
<strong>to</strong>urist potential, the influence <strong>of</strong> lobby groups and protection for use such as hunting or<br />
water supply (Pressey 1994, 662). Hence, this route does not ensure that the sites <strong>with</strong> the<br />
most important contributions <strong>to</strong> global biodiversity are adequately protected, but instead<br />
protects less biodiverse regions <strong>with</strong> low human pressure (Pressey et al. 1996, 318, 320).<br />
Furthermore, it also <strong>of</strong>ten fails <strong>to</strong> include the wide range <strong>of</strong> stakeholders required for the long<br />
term success <strong>of</strong> conservation (Langhammer et al. 2007, 8). It has now been widely accepted<br />
that conservation activities should be targeted systematically and strategically (Langhammer<br />
et al. 2007, xi; Margules and Pressey 2000, 243; Warman and Sinclair 2000, 141) in order <strong>to</strong><br />
ensure the persistence <strong>of</strong> biodiversity over time.<br />
Even though protected <strong>areas</strong> are essential for biodiversity conservation, sufficient<br />
conservation efforts will not be achieved through the establishment <strong>of</strong> these alone (Interview<br />
Partner E). The primary threat <strong>to</strong> biodiversity is habitat destruction and degradation, driven<br />
largely by agriculture and forestry (Baillie et al. 2004, 86). These high levels <strong>of</strong> conversion <strong>of</strong><br />
natural habitat are due <strong>to</strong> land use requirements <strong>of</strong> a large and still growing human<br />
population. Moreover, the negative implications for biodiversity are greatly exacerbated in<br />
1
1. INTRODUCTION<br />
<strong>areas</strong> <strong>with</strong> high rates <strong>of</strong> land conversion, coinciding <strong>with</strong> high species richness or endemism<br />
(Millennium Ecosystem <strong>Assessment</strong> 2005b, 96). Therefore, an increasingly important part <strong>of</strong><br />
modern conservation planning is the protection <strong>of</strong> production landscapes. The elements <strong>of</strong><br />
biodiversity can further be safeguarded in production landscapes by either setting up<br />
additional protected <strong>areas</strong>, for instance in a voluntary manner, or finding ways <strong>of</strong> sustainably<br />
managing these regions (Interview Partner D).<br />
Due <strong>to</strong> the rapid loss <strong>of</strong> biodiversity and the limited resources available <strong>to</strong> protect it, priorities<br />
need <strong>to</strong> be identified. Not all elements <strong>of</strong> biodiversity have the same conservation needs, nor<br />
do they provide the same contribution <strong>to</strong> the safeguarding <strong>of</strong> global biodiversity. Prioritisation<br />
is about deciding which elements require immediate attention (Pressey et al. 1993, 124).<br />
Biodiversity and its threats are not evenly distributed, some <strong>areas</strong> are far richer in<br />
biodiversity and e<strong>special</strong>ly in endemism, and since these <strong>areas</strong> are <strong>of</strong>ten also under the<br />
most threat, prioritising conservation efforts in these <strong>areas</strong> will achieve maximum impact,<br />
making a greater contribution <strong>to</strong>wards global biodiversity preservation (Mittermeier et al.<br />
1998, 516).<br />
1.2 Problem Statement and Research Gaps<br />
Many prioritisation <strong>approaches</strong> for the conservation <strong>of</strong> biodiversity, at a global, regional and<br />
local scale, have been developed and employed <strong>to</strong> assist in the effective allocation <strong>of</strong> limited<br />
resources (Brooks et al. 2006, 58; Knight et al. 2007, 256). The variety in concepts has<br />
evolved due <strong>to</strong> biodiversity conservation organisations requiring powerful and cost-effective<br />
<strong>approaches</strong> <strong>to</strong> market as their own, and thereby, improve fundraising (Interview Partner G).<br />
Even though this diversity in <strong>approaches</strong> contributes usefully <strong>to</strong> an ongoing debate about<br />
their appropriateness (Margules and Pressey 2000, 251), it does however, also lead <strong>to</strong><br />
criticism that there is a duplication <strong>of</strong> effort and a lack <strong>of</strong> clarity between the different<br />
<strong>approaches</strong> at all levels (Mace 2000, 393; da Fonseca 2000, 394). So far, few attempts have<br />
been made <strong>to</strong> summarize and compare global prioritisation <strong>approaches</strong> (Redford et al. 2003,<br />
118; Brooks et al. 2006, 58). More importantly, purely regional and local scale prioritisation<br />
<strong>approaches</strong>, being important for the identification <strong>of</strong> more precise and most urgent<br />
conservation targets (Langhammer et al. 2007, 6), have seemingly not been compared in an<br />
adequate manner. The criteria required by and the efficiency <strong>of</strong> these <strong>approaches</strong> are until<br />
now not that well unders<strong>to</strong>od (Interview Partner I). Hence, the need for gaining an overview<br />
<strong>of</strong> contemporary methods used for the identification <strong>of</strong> biodiversity relevant <strong>areas</strong> has arisen.<br />
2
1. INTRODUCTION<br />
The High Conservation Value (HCV) concept, a local prioritisation approach, is commonly<br />
used by the Deutsche Gesellschaft für Technische Zusammenarbeit (GTZ) GmbH and other<br />
international organisations, such as the Rainforest Alliance (The Rainforest Alliance, 2005),<br />
The Nature Conservancy (TNC) and the World Wide Fund for Nature (WWF) (High<br />
Conservation Value Resource Network, 2005 - 07). Thus, the GTZ - Programme Office for<br />
Social and Ecological Standards has requested research <strong>to</strong> be carried out <strong>to</strong> <strong>identify</strong> other<br />
local and regional conservation <strong>approaches</strong>, <strong>to</strong> provide a deeper understanding and<br />
determine the efficiency <strong>of</strong> contemporary <strong>approaches</strong> in comparison <strong>to</strong> the HCV concept.<br />
Realising advantages, disadvantages and divergences <strong>of</strong> such approach identification<br />
phases shall help conservation practitioners make more precise decisions on the choice <strong>of</strong><br />
the approach <strong>to</strong> be employed (Interview Partner A).<br />
1.3 Objectives <strong>of</strong> Thesis<br />
This thesis intends <strong>to</strong> assess a range <strong>of</strong> regional and local conservation <strong>approaches</strong> used <strong>to</strong><br />
<strong>identify</strong> <strong>areas</strong> <strong>with</strong> <strong>special</strong> <strong>importance</strong> for biodiversity conservation in comparison <strong>to</strong> the HCV<br />
concept. Hereby a detailed overview <strong>of</strong> selected <strong>approaches</strong>, <strong>with</strong> regard <strong>to</strong> their similarities,<br />
differences, strengths and weaknesses shall be produced, embarking on the task <strong>of</strong><br />
attempting <strong>to</strong> evaluate their efficiency.<br />
The aim <strong>of</strong> this work is <strong>to</strong> provide answers for the <strong>approaches</strong>’ identification stage <strong>to</strong> the<br />
following research questions:<br />
1. Which local and regional conservation <strong>approaches</strong> exist beyond the HCV concept?<br />
2. What are their differences and similarities?<br />
3. What are their strengths and weaknesses?<br />
4. What input do they require?<br />
5. How effective are they?<br />
Thus, a contribution <strong>to</strong> determine the approach efficiency shall be made – and a thorough<br />
overview <strong>of</strong> contemporary <strong>approaches</strong> used for the identification <strong>of</strong> biodiversity relevant sites<br />
shall be provided.<br />
3
2. METHODOLOGY<br />
2. Methodology<br />
2.1 Overview <strong>of</strong> Methodology<br />
In order <strong>to</strong> compare the HCV concept <strong>to</strong> other contemporary <strong>approaches</strong> used <strong>to</strong> <strong>identify</strong><br />
biodiversity relevant sites, the strength-weakness analysis method was selected as the core<br />
methodology <strong>to</strong> be employed for this thesis. The subsequent steps leading up <strong>to</strong> the strengthweakness<br />
analysis and final results are shown in Figure 1.<br />
Figure 1: Research methodology<br />
2.2.1 First Literature Research<br />
2.2.1.1 Development <strong>of</strong><br />
Key Questions and Criteria<br />
2.2.1.2 Choice <strong>of</strong><br />
Approaches for <strong>Assessment</strong><br />
2.2.2 Set <strong>of</strong> Key Questions and Criteria<br />
2.2.3 Second Literature<br />
Research<br />
2.2.4 Semi-Structured<br />
Interviews<br />
2.2.5. Design <strong>of</strong> <strong>Assessment</strong> Methodology<br />
2.2.6 Strength-Weakness<br />
Analysis<br />
2.2.7 Additional Criteria<br />
Results<br />
Source: Own design<br />
The following chapters are dedicated <strong>to</strong> the detailed description <strong>of</strong> these methodological steps.<br />
4
2. METHODOLOGY<br />
2.2 Description <strong>of</strong> Methodological Steps<br />
2.2.1 First Literature Research<br />
In order <strong>to</strong> compare contemporary <strong>approaches</strong> <strong>to</strong> the HCV concept, a set <strong>of</strong> indica<strong>to</strong>rs, in the<br />
form <strong>of</strong> key questions and criteria, required development. Simultaneously, suitable <strong>approaches</strong><br />
for the assessment needed <strong>to</strong> be identified. Thus, a detailed literature review was undertaken.<br />
All literature research was limited <strong>to</strong> books, journal articles and web sites sourced through online<br />
databases, generalized search engines, library research or by tracking back through citations 1 .<br />
2.2.1.1 Development <strong>of</strong> Key Questions and Criteria<br />
For the performance <strong>of</strong> the strength-weakness analysis, an elaborated set <strong>of</strong> key questions,<br />
criteria and sub-criteria 2 was formulated. Therefore, a thorough comparison <strong>of</strong> the HCV<br />
concept <strong>with</strong> the other contemporary <strong>approaches</strong> would be possible. Furthermore, this<br />
diverse set <strong>of</strong> indica<strong>to</strong>rs was divided in<strong>to</strong> 5 thematic groups: I. Ecology; II. Implementation;<br />
III. Input; IV. Supplementary; and V. Effectiveness.<br />
The integration <strong>of</strong> the key questions in<strong>to</strong> these groups was mainly based on the pressurestate-response<br />
(PSR) system and also undertaken <strong>with</strong> the intention <strong>of</strong> providing a clear<br />
orientation <strong>to</strong> the reader concerning the <strong>approaches</strong> inherent qualities.<br />
Group I (Ecology) was formulated <strong>to</strong> determine whether an approach addresses ecological<br />
aspects <strong>of</strong> biodiversity. Hence, it represents state in the PSR system.<br />
Group II (Implementation) should determine how an approach moves from state <strong>to</strong><br />
response, in terms <strong>of</strong> who (Criteria F and D), where (Criterion C) and how (Criterion E).<br />
The response aspect is represented by Group III (Input) and Group V (Effectiveness).<br />
Group III represents the expenditure <strong>of</strong> a conservation project, whereas Group V should<br />
show which approach protects the largest number <strong>of</strong> species and results in the highest<br />
percentage <strong>of</strong> a set-aside area.<br />
Lastly, Group IV (Supplementary) represents additional criteria that should detect an<br />
approach’s ability <strong>to</strong> firstly detect the pressures influence on state (Criterion K) and secondly<br />
detect the response’s influence on pressure (Criteria J, L and M).<br />
The pressure aspect in itself was not addressed during this thesis, as it was assumed that<br />
this would be more or less the same for all <strong>approaches</strong>, namely the loss <strong>of</strong> biodiversity due<br />
<strong>to</strong> human activity.<br />
1 All references can be found at the end <strong>of</strong> the thesis in the References section.<br />
2 An overview <strong>of</strong> the key questions and criteria can be seen in Chapter, 2.2.2.<br />
5
2. METHODOLOGY<br />
Figure 2 provides an overview <strong>of</strong> the thematic groups based on the PSR system.<br />
Figure 2: Overview <strong>of</strong> groups based on pressure-stateresponse<br />
system<br />
Group IV<br />
Supplementary<br />
Criterion K<br />
Group II<br />
Implementation<br />
PRESSURE<br />
STATE<br />
RESPONSE<br />
Group I<br />
Ecology<br />
Group V<br />
Effectiveness<br />
Group IV<br />
Supplementary<br />
Criterion J, L,M<br />
Group III<br />
Input<br />
Source: (OECD 1993, 5)<br />
Own design based on and modified from OECD 1993<br />
2.2.1.2 Choice <strong>of</strong> Approaches for <strong>Assessment</strong><br />
The selection <strong>of</strong> <strong>approaches</strong> was subject <strong>to</strong> a systematic concept. All <strong>approaches</strong><br />
needed <strong>to</strong> be comparable <strong>to</strong> the HCV concept, collectively covering a broad range <strong>of</strong><br />
conservation targets and providing sufficient case studies for reviewing. For practical purposes,<br />
the number <strong>of</strong> assessed <strong>approaches</strong> should lie between 5 and 10 3 .<br />
2.2.2 Set <strong>of</strong> Key Questions and Criteria<br />
An overview <strong>of</strong> the key questions, criteria and sub-criteria divided in<strong>to</strong> their thematic groups<br />
is provided in Table 1 (see next page). In order <strong>to</strong> set up a comparison <strong>of</strong> the contemporary<br />
<strong>approaches</strong> on these key questions and criteria, these were specifically explained and<br />
clearly defined based on argumentative reasoning 4 .<br />
3 Please refer <strong>to</strong> chapter 3.2, Rationale behind Approach Selection, for an explanation <strong>to</strong> the choice <strong>of</strong><br />
<strong>approaches</strong>.<br />
4 Please refer <strong>to</strong> Appendix A1, for the detailed definitions <strong>of</strong> the key questions and criteria.<br />
6
2. METHODOLOGY<br />
Table 1: Overview <strong>of</strong> key questions, criteria and sub-criteria<br />
Group Key Questions Criteria Sub-criteria 5<br />
genetic diversity (C1)<br />
A. Are all levels <strong>of</strong> biodiversity addressed? Addressed biodiversity levels<br />
species diversity (C2)<br />
I. Ecology<br />
ecosystem diversity (C3)<br />
B. Are all ecosystem types addressed? Addressed ecosystem types<br />
terrestrial (C4)<br />
aquatic (C5)<br />
local (C6)<br />
C. At which geographic scale is the approach applicable? Geographic scale <strong>of</strong> applicability<br />
regional (C7)<br />
global (C8)<br />
D. At which level has the method been implemented? Level <strong>of</strong> approach<br />
II. Implementation<br />
E. Which style <strong>of</strong> implementation does the approach apply? Implementation style<br />
private sec<strong>to</strong>r level (C9)<br />
public sec<strong>to</strong>r level (C10)<br />
<strong>to</strong>p-down (C11)<br />
bot<strong>to</strong>m-up (C12)<br />
international experts (C13)<br />
F. For whom is the approach suitable? Suitability for different users<br />
national experts (C14)<br />
local user groups (C15)<br />
site visits (C16)<br />
III. Input G. Which methods were employed for site choice? Methods for site choice<br />
surveys (C17)<br />
additional methods (C18)<br />
5 For definitions <strong>of</strong> the sub-criteria, please refer <strong>to</strong> chapter 7, General Terms.<br />
7
2. METHODOLOGY<br />
Group Key Questions Criteria Sub-criteria<br />
Required resources<br />
H. Which resources are required for identification?<br />
financial resources (C19)<br />
human resources (C20)<br />
III. Input<br />
Continued<br />
I. Which data are required for the identification <strong>of</strong> important<br />
<strong>areas</strong>?<br />
Data requirements<br />
required time (C21)<br />
use <strong>of</strong> existing data (C22)<br />
data acquisition (C23)<br />
data validation (C24)<br />
remote sensing (C25)<br />
J. Is a scoping assessment possible?<br />
Possibility <strong>of</strong> scoping<br />
assessment<br />
required resources (C26)<br />
required time (C27)<br />
IV. Supplementary K. Which threats are considered? What is their severity? Consideration <strong>of</strong> threats<br />
internal (C28)<br />
external (C29)<br />
L. Is guidance for appropriate moni<strong>to</strong>ring steps provided? Moni<strong>to</strong>ring recommendations moni<strong>to</strong>ring recommendations (C30)<br />
M. Is guidance for appropriate management steps provided? Management recommendations management recommendations (C31)<br />
amount (C32)<br />
N. How many different species are conserved?<br />
What is their status?<br />
Conserved species<br />
threat status (C33)<br />
irreplaceability (C34)<br />
V. Effectiveness<br />
sensitivity/ <strong>to</strong>lerance <strong>to</strong>wards threat (C35)<br />
size (C36)<br />
O. How large is the protected area (PA)? Is this area<br />
connected <strong>to</strong> other Protected <strong>areas</strong> (PAs)?<br />
Protected area<br />
state/ naturalness (C37)<br />
connection <strong>with</strong> other PAs (C38)<br />
Source: Own design<br />
representativeness (C39)<br />
8
2. METHODOLOGY<br />
2.2.3 Second Literature Research<br />
A second literature research was performed. Firstly <strong>to</strong> gain some general insight in<strong>to</strong> the<br />
selected <strong>approaches</strong> 6 was thereby gained which enabled a comparison <strong>of</strong> the <strong>approaches</strong>’<br />
scale and objectives, as well as the criteria they employ for site identification. Secondly,<br />
data <strong>with</strong> regard <strong>to</strong> the key questions and criteria was gathered for the individual<br />
<strong>approaches</strong>. During this research it became apparent that not all key questions and criteria<br />
could be answered through literature research alone 7 . Thus, the semi-structured interviews,<br />
which at first were solely designed <strong>to</strong> validate the data obtained from the review, were<br />
redesigned <strong>to</strong> allow for data acquisition as well.<br />
2.2.4 Semi-Structured Interviews<br />
Since this thesis required qualitative, descriptive information, semi-structured interviews<br />
were chosen as method for additional data acquisition and overall data validation. This style<br />
<strong>of</strong> interviewing lends itself well <strong>to</strong> gathering qualitative information, <strong>of</strong>ten based on the<br />
interviewee’s in depth opinion and perspective (USAID 1996, 1). To obtain some background<br />
knowledge on performing semi-structured interviews, a <strong>special</strong>ist <strong>of</strong> the Technical University<br />
<strong>of</strong> Munich was consulted and literature reviewed (Mieg et al. 2005, 1-26; USAID 1996, 1-4).<br />
This enabled an outline and questions for the interviews <strong>to</strong> be formulated 8 .<br />
Furthermore, a list <strong>of</strong> possible interview candidates was established <strong>with</strong> the help <strong>of</strong> a<br />
preliminary stakeholder network analysis and support from the GTZ-Programme Office for<br />
Social and Ecological Standards.<br />
A <strong>to</strong>tal <strong>of</strong> 34 possible candidates were contacted <strong>with</strong> 14 expert interviews (41%) being held<br />
between 21.09.2009 and 02.11.2009. Each interview <strong>to</strong>ok between half an hour and one and<br />
a half hours. Since the majority <strong>of</strong> interviewees 9 were based outside <strong>of</strong> Germany, the<br />
interviews were held via telephone or internet. The interviews were recorded and then<br />
transcribed in<strong>to</strong> a report. All recordings were subsequently erased. Permission from all<br />
interviewees <strong>to</strong> include the interview reports anonymously in this thesis was obtained 10 .<br />
6 An overview <strong>of</strong> each approach is provided in chapter 3.3, Case Study Approach Pr<strong>of</strong>iles.<br />
7 For further detail, please refer <strong>to</strong> chapter 2.2.5, Design <strong>of</strong> <strong>Assessment</strong> Methodology.<br />
8 Please refer <strong>to</strong> Appendix A2 for the interview outline design.<br />
9 Please refer <strong>to</strong> Appendix A3 for a list <strong>of</strong> all interviewees.<br />
10 Please refer <strong>to</strong> Appendix A4 for all interview reports.<br />
9
2. METHODOLOGY<br />
2.2.5 Design <strong>of</strong> <strong>Assessment</strong> Methodology<br />
During the literature reviews and interviews it became apparent that the Group III (Input) and<br />
Group V (Effectiveness) key questions and criteria could not be assessed by a strengthweakness<br />
analysis, due <strong>to</strong> either the complexity or lack <strong>of</strong> available data. Thus, additional<br />
assessment methodology was chosen.<br />
Figure 3 shows the resulting assessment methodology used <strong>to</strong> analyse the selected<br />
<strong>approaches</strong>.<br />
Figure 3: Overview <strong>of</strong> assessment methodology<br />
Strength-Weakness Analysis Ranking No <strong>Assessment</strong> Possible<br />
Group Criteria Group Criteria<br />
Group<br />
Criteria<br />
I. Ecology<br />
A. Addressed<br />
Biodiversity Levels<br />
B. Addressed<br />
Ecosystem Types<br />
III. Input<br />
G. Methods for<br />
Site Choice<br />
H. Required<br />
Resources<br />
I. Data<br />
Requirements<br />
V. Effectiveness<br />
N. Conserved<br />
Species<br />
O. Protected<br />
Area<br />
C. Geographic<br />
Scale <strong>of</strong> Applicability<br />
D. Level <strong>of</strong> Approach<br />
II. Implementation<br />
E. Implementation<br />
Style<br />
F. Suitability for<br />
Different Users<br />
IV. Supplementary<br />
Source: Own Design<br />
J. Possibility <strong>of</strong><br />
Scoping <strong>Assessment</strong><br />
K. Consideration <strong>of</strong><br />
Threats/ Risks<br />
L. Moni<strong>to</strong>ring<br />
Rec ommendations<br />
M. Management<br />
Recommendations<br />
10
2. METHODOLOGY<br />
Criteria A-B (Group I Ecology), criteria C-F (Group II Implementation) and criteria J-M<br />
(Group IV Supplementary) were assessed in the strength-weakness analysis 11 . Enough<br />
data was obtained <strong>to</strong> classify the <strong>approaches</strong> and <strong>to</strong> display the results in strength-weakness<br />
pr<strong>of</strong>iles.<br />
Criteria G-I (Group III Input) were not included in the strength-weakness analysis, but<br />
instead were addressed separately. These criteria are more complex, <strong>of</strong>ten also<br />
interdependent and therefore could not be classified according <strong>to</strong> “strong” and “weak”. Thus,<br />
this thesis provides a ranked estimation <strong>of</strong> the <strong>approaches</strong> based on an ordinal ranking<br />
system 12 .<br />
Criteria N-O (Group V Effectiveness) were not assessed in this thesis, as both literature<br />
reviews and interviews did not provide any data on these criteria.<br />
Consequently, a detailed comparison was undertaken for the selected contemporary<br />
<strong>approaches</strong> used <strong>to</strong> <strong>identify</strong> biodiversity relevant <strong>areas</strong>. This was based on a strengthweakness<br />
analysis for the Groups I (Ecology), II (Implementation) and IV (Supplementary)<br />
and an ordinal ranking system for the Group III (Input).<br />
2.2.6 Strength-Weakness Analysis<br />
The second literature review and the semi-structured interviews provided sufficient data on<br />
strengths and weaknesses for all <strong>approaches</strong>. Strengths and weaknesses could be identified<br />
for the key questions and criteria in Group I (Ecology), Group II (Implementation) and Group<br />
IV (Supplementary). Supported by argumentative reasoning 13 the <strong>approaches</strong> were classified<br />
according <strong>to</strong> very weak (--), weak (-), average (O), strong (+) and very strong (++) for each<br />
key question <strong>with</strong>in the respective groups. The argumentative reasoning was summarised in<br />
tabular form <strong>to</strong> provide specific guidelines in order <strong>to</strong> allocate measures for each key<br />
question and criteria as shown in Table 2. Hence, a strength-weakness pr<strong>of</strong>ile could be<br />
determined for each approach for the key questions and criteria <strong>of</strong> Groups I, II and IV.<br />
11 Please refer <strong>to</strong> chapter 2.2.6, Strength-Weakness Analysis, for the methodological description.<br />
12 Please refer <strong>to</strong> chapter 2.2.7, Additional Criteria, for the methodological description.<br />
13 Please refer <strong>to</strong> Appendix A1 for the argumentation on which the classification is based.<br />
11
2. METHODOLOGY<br />
Table 2: Defined classification values for key questions and criteria<br />
Group Criteria 14 Sub-criteria -- - 0 + ++<br />
I. Ecology<br />
II.<br />
Implementation<br />
A. Addressed<br />
biodiversity levels<br />
B. Addressed<br />
ecosystem types<br />
C. Geographic<br />
scale <strong>of</strong><br />
applicability<br />
genetic diversity<br />
(C1)<br />
species diversity<br />
(C2)<br />
ecosystem<br />
diversity (C3) 15<br />
terrestrial (C4)<br />
aquatic (C5)<br />
local (C6)<br />
regional (C7)<br />
global (C8)<br />
EITHER C1, C2,<br />
C3 not<br />
addressed<br />
OR<br />
one sub-criterion<br />
addressed<br />
partially/<br />
indirectly and<br />
the other two not<br />
addressed<br />
C4 and C5 not<br />
addressed<br />
C6, C7, C8 not<br />
addressed<br />
EITHER C1, C2<br />
C3 addressed<br />
partially/<br />
indirectly<br />
OR<br />
one subcriterion<br />
addressed fully<br />
and the other<br />
two not<br />
addressed<br />
EITHER C4<br />
partially<br />
addressed and<br />
C5 not<br />
addressed<br />
OR<br />
vice versa<br />
C6, C7, C8<br />
addressed<br />
partially<br />
EITHER C2 fully<br />
addressed; C1<br />
partially/<br />
indirectly and C3<br />
not addressed<br />
OR<br />
C3 fully<br />
addressed; C1<br />
and C2 partially<br />
EITHER<br />
C4 and C5<br />
partially<br />
addressed<br />
OR<br />
one sub-criterion<br />
addressed fully<br />
and the second<br />
not at all<br />
One sub-criterion<br />
addressed fully<br />
(either C6, C7 or<br />
C8) and the<br />
other two<br />
addressed<br />
partially (either<br />
C6 & C7 or C7 &<br />
C8 or C6 & C8)<br />
C2 and C3 fully<br />
addressed and<br />
C1 not<br />
addressed<br />
EITHER<br />
C4 fully<br />
addressed and<br />
C5 partially<br />
OR<br />
vice versa<br />
EITHER<br />
C6 and C7<br />
OR<br />
C6 and C8 fully<br />
addressed<br />
AND<br />
C8 OR C7<br />
indirectly OR not<br />
addressed<br />
C1, C2, C3 fully<br />
addressed<br />
Or<br />
C2 and C3 fully<br />
addressed and<br />
C1 indirectly/<br />
partially<br />
C4 and C5 fully<br />
addressed<br />
C6, C7, C8 fully<br />
addressed<br />
or<br />
C7 and C8 fully<br />
addressed and<br />
C6 indirectly<br />
14 The criteria are defined as being met fully, if the approach has actually been implemented at the specific level and not, if it could theoretically be<br />
implemented.<br />
15 It should be noted that ecosystem diversity refers <strong>to</strong> the number <strong>of</strong> different ecosystems. Due <strong>to</strong> the scope <strong>of</strong> this thesis a more in depth analysis <strong>of</strong> the<br />
various levels <strong>of</strong> biodiversity, by including ecosystem functioning, was not possible.<br />
12
2. METHODOLOGY<br />
Group Criteria Sub-criteria -- - 0 + ++<br />
D. Level <strong>of</strong><br />
approach<br />
private sec<strong>to</strong>r<br />
level (C9)<br />
public sec<strong>to</strong>r<br />
level (C10)<br />
C9 and C10 not<br />
addressed<br />
One subcriterion<br />
addressed<br />
partially; the<br />
other one not at<br />
all<br />
EITHER<br />
C9 addressed<br />
fully and C10 not<br />
addressed<br />
OR<br />
C10 addressed<br />
fully and C9 not<br />
addressed<br />
One subcriterion<br />
addressed fully;<br />
the other one<br />
addressed<br />
partially<br />
C9 and C10 fully<br />
addressed<br />
II.<br />
Implementation<br />
(continued)<br />
E. Implementation<br />
style<br />
F. Suitability for<br />
intended users<br />
<strong>to</strong>p-down (C11)<br />
bot<strong>to</strong>m-up (C12)<br />
international<br />
experts (C13)<br />
national experts<br />
(C14)<br />
local user groups<br />
(C15)<br />
C11 and C12<br />
not addressed<br />
C15 and/ or C13<br />
addressed fully;<br />
C14 not<br />
addressed<br />
One subcriterion<br />
addressed<br />
partially; the<br />
other one not at<br />
all<br />
C14 addressed;<br />
C13 and C15<br />
not addressed<br />
EITHER C11<br />
addressed fully<br />
and C12 not<br />
addressed<br />
OR<br />
vice versa<br />
OR both<br />
addressed<br />
partially<br />
C14 fully<br />
addressed and<br />
EITHER<br />
C13 and C15<br />
partially<br />
addressed<br />
One subcriterion<br />
addressed fully;<br />
the other one<br />
addressed<br />
partially<br />
EITHER<br />
C13 and C14<br />
addressed fully<br />
and C15 not or<br />
partially<br />
addressed<br />
OR<br />
C14 and C15<br />
addressed fully<br />
and C13 not or<br />
partially<br />
addressed<br />
C11 and C12<br />
fully addressed<br />
all sub-criteria<br />
are addressed<br />
fully<br />
13
2. METHODOLOGY<br />
Group Criteria Sub-criteria -- - 0 + ++<br />
IV.<br />
Supplementary<br />
J. Possibility <strong>of</strong><br />
scoping<br />
assessment<br />
K. Consideration<br />
<strong>of</strong> threats<br />
required<br />
resources (C26)<br />
required time<br />
(C27)<br />
internal (C28)<br />
external (C29)<br />
C26 and C27<br />
not addressed<br />
C28 and C29<br />
not addressed<br />
EITHER<br />
C26 partially<br />
addressed and<br />
C27 not<br />
addressed<br />
OR<br />
vice versa<br />
OR<br />
C26 and C27<br />
not<br />
determinable<br />
<strong>with</strong> an inherent<br />
weakness<br />
EITHER<br />
C26 fully<br />
addressed;<br />
C27 not<br />
addressed<br />
OR<br />
vice versa<br />
OR<br />
C26 and C27 not<br />
determinable<br />
N.A. C28 and C29<br />
partially<br />
addressed<br />
C26 partially and<br />
C27 fully<br />
addressed<br />
C26 and C27<br />
fully addressed<br />
N.A. C28 and C29<br />
fully addressed<br />
L. Moni<strong>to</strong>ring<br />
recommendations<br />
M. Management<br />
recommendations<br />
Key: N.A. = not applicable<br />
Source: Own design<br />
moni<strong>to</strong>ring<br />
recommendations<br />
(C30)<br />
management<br />
recommendations<br />
(C31)<br />
C30 not<br />
addressed<br />
C31 not<br />
addressed<br />
N.A. C30 is partially<br />
addressed<br />
N.A. C31 is partially<br />
addressed<br />
N.A. C30 is fully<br />
addressed<br />
N.A. C31 is fully<br />
addressed<br />
14
2. METHODOLOGY<br />
2.2.7 Additional Criteria<br />
The assessment <strong>of</strong> Group III (Input) criterion G (methods for site choice), criterion H<br />
(required resources) and criterion I (data requirements) was based on literature research<br />
and expert interviews. For this purpose the detailed measures <strong>of</strong> the strength-weakness<br />
analysis were reduced <strong>to</strong> a sequence <strong>of</strong> ordinal numbers or rankings which enabled the<br />
complex information, obtained for the Group III criteria, <strong>to</strong> be evaluated.<br />
The ordinal ranking system was established individually for each criterion.<br />
Criterion G (methods for site choice), in general, based this ranking on the number <strong>of</strong><br />
different methods an approach may implement <strong>to</strong> <strong>identify</strong> sites important for biodiversity<br />
conservation. However, any identified weaknesses or shortcomings were also taken in<strong>to</strong><br />
consideration when ranking the <strong>approaches</strong>.<br />
Criterion H (required resources) based this ranking on the amount <strong>of</strong> resources (financial,<br />
human and time) an approach requires. The lower the required resources, the higher the<br />
approach will be ranked. For this criterion, each sub-criterion was assigned an individual<br />
ranking.<br />
Criterion I (data requirements) based this ranking on the amount <strong>of</strong> different information<br />
sources an approach may make use <strong>of</strong>.<br />
Table 3 shows the divisions behind the ranking system (see next page).<br />
15
2. METHODOLOGY<br />
Table 3: Ordinal ranking system for additional criteria and sub-criteria<br />
Criteria Sub-criteria 1 2 3<br />
Group<br />
III<br />
Input<br />
G. Methods for<br />
Site Choice<br />
H. Required<br />
resources<br />
I. Data<br />
requirements<br />
Site visits (C16)<br />
Survey (C17)<br />
Additional methods<br />
(C18)<br />
Financial resources<br />
(C19)<br />
Human resources<br />
(C20)<br />
Time required<br />
(C21)<br />
Use <strong>of</strong> existing data<br />
(C22)<br />
Data acquisition<br />
(C23)<br />
Data validation<br />
(C24)<br />
Use <strong>of</strong> remote<br />
sensing (C25)<br />
9-11 Methods 6-8 Methods 3-5 Methods<br />
No ranking possible since the range <strong>of</strong> data<br />
obtained was not wide enough 16<br />
Least<br />
intensive<br />
(1-2 people)<br />
Shortest time<br />
(1-12 months)<br />
13-15 data<br />
sources<br />
Key: 1=first place; 2=second place; 3=third place;<br />
Source: Own design<br />
Average<br />
intensive<br />
(3-4 people)<br />
Average<br />
time (1-2,5<br />
years)<br />
10-12 data<br />
sources<br />
Highest<br />
intensive<br />
(≥ 5 people)<br />
Longest time<br />
(≥ 3 years)<br />
7-9 data<br />
sources<br />
This ordinal system enabled a ranking <strong>of</strong> the <strong>approaches</strong> <strong>to</strong> be undertaken for the criteria<br />
and sub-criteria <strong>of</strong> Group III. The <strong>approaches</strong> were ranked according <strong>to</strong> first, second and<br />
third place.<br />
16 Please refer <strong>to</strong> chapter 4.3.4, Interim Summary III, for more detail.<br />
16
3. CASE STUDIES<br />
3. Case Study Selection<br />
3.1 Possible and Selected Approaches<br />
During the first stage <strong>of</strong> research a desk <strong>to</strong>p study was undertaken <strong>to</strong> determine all possible<br />
<strong>approaches</strong> that <strong>identify</strong> <strong>areas</strong> important for biodiversity conservation (see Table 4).<br />
However, the majority <strong>of</strong> these were discovered <strong>to</strong> be unsuitable for the assessment 17 .<br />
Table 4: List <strong>of</strong> possible <strong>approaches</strong><br />
Possible Approaches <strong>to</strong> <strong>identify</strong> biodiversity<br />
relevant sites 18<br />
High Conservation Value (HCV)<br />
Biodiversity <strong>Assessment</strong> and Mapping Methodology<br />
(BAMM)<br />
Biodiversity Hotspots<br />
Centres for Plant Diversity (CPD)<br />
Endemic Bird Areas (EBA)<br />
Ecoregion-Based Conservation (ERBC)<br />
Ecosystem Risk-Representativeness Approach<br />
Focal Species Approach (FSA)<br />
Global 200 Ecoregions<br />
Important Bird Areas (IBA)<br />
Key Biodiversity Areas (KBA)<br />
Major Tropical Wilderness Areas<br />
Rapid Ecological <strong>Assessment</strong> (REA)<br />
Source: Own design<br />
Main Characteristics supporting selection<br />
Stipulated by the GTZ<br />
Multiple criteria<br />
Implementation in production landscapes<br />
Case studies limited <strong>to</strong> Australia<br />
Macro-level approach<br />
Macro-level approach<br />
Macro-level approach<br />
Global application<br />
Ecosystem specific criteria<br />
Numerous case studies<br />
Ecosystem specific criteria<br />
Only one case studies found in literature<br />
Global application<br />
Taxon based surrogate scheme<br />
Implementation in production landscapes<br />
Macro-level approach<br />
Part <strong>of</strong> the KBA process<br />
Global application<br />
Multiple taxon specific criteria<br />
Numerous case studies<br />
Macro-level approach<br />
Global application<br />
Tool used for biodiversity assessments<br />
Numerous case studies<br />
17 Please refer <strong>to</strong> chapter 3.2, Rationale behind Approach Selection, for a detailed explanation.<br />
18 Approaches selected for the assessment are shown in bold.<br />
17
3. CASE STUDIES<br />
3.2 Rationale behind Approach Selection<br />
Many global biodiversity prioritisation conservation <strong>approaches</strong> (macro-level <strong>approaches</strong>)<br />
have been developed over the years (Brooks et al. 2006, 58). Although these <strong>approaches</strong>,<br />
such as Centres for Plant Diversity (WWF and IUCN 1994-97), the Global 200 Ecoregions<br />
(Olson and Dinerstein 1998), Biodiversity Hotspots (Myers et al. 2000) and Endemic Bird<br />
Areas (Stattersfield et al. 1998), have been highly influential in directing conservation<br />
resources on a global scale (Brooks et al. 2006, 61), they have had little success in<br />
<strong>identify</strong>ing regional and local conservation targets (Mace 2000, 393, Sanderson et al. 2002,<br />
902).<br />
Thus, these global <strong>approaches</strong> require subsequent prioritisation at a finer resolution <strong>with</strong>in<br />
the identified <strong>areas</strong> (Pr<strong>of</strong>orest 2005-07). Many national and international organisations have<br />
consequently developed a range <strong>of</strong> regional and local scale prioritisation conservation<br />
assessment schemes (micro-scale <strong>approaches</strong>) <strong>to</strong> <strong>identify</strong> biodiversity at the respective<br />
scales and <strong>to</strong> assist in the effective allocation <strong>of</strong> limited resources (Knight et al. 2007, 256).<br />
Among these is the High Conservation Value (HCV) concept which has, over the years,<br />
increasingly gained wide spread application from many international organisations. Since<br />
this approach is <strong>of</strong> major interest <strong>to</strong> the GTZ - Programme Office for Social and Ecological<br />
Standards and since it is a micro-level approach (i.e. <strong>identify</strong>ing regional and/ or local<br />
conservation targets) (Interview Partner E), the other <strong>approaches</strong> used for this assessment<br />
should also be micro-level <strong>approaches</strong>, in order <strong>to</strong> possess the necessary comparative<br />
character for this research. Another determining fac<strong>to</strong>r for the selection <strong>of</strong> <strong>approaches</strong> was<br />
their global application and <strong>with</strong> this, the number <strong>of</strong> case studies available for the intended<br />
review. Furthermore, this thesis attempted <strong>to</strong> choose a sample <strong>of</strong> <strong>approaches</strong> that<br />
collectively address the full range <strong>of</strong> conservation targets. For instance, the Key Biodiversity<br />
Areas (KBA) approach relies on multiple taxon specific criteria and the Ecoregion-Based<br />
Conservation (ERBC) approach uses ecosystem specific criteria. In contrast, the HCV<br />
concept relies on multiple criteria <strong>identify</strong>ing a broad range <strong>of</strong> conservation targets <strong>with</strong>in<br />
biodiversity relevant sites. The Focal Species Approach (FSA) is implemented in production<br />
landscapes, and was added <strong>to</strong> the set <strong>of</strong> selected <strong>approaches</strong> as a direct comparison <strong>to</strong> the<br />
HCV concept which was also first designed for implementation in this context. Contrasting all<br />
four above mentioned <strong>approaches</strong>, the Rapid Ecological <strong>Assessment</strong> (REA) was finally<br />
added. This approach is a biodiversity characterisation <strong>to</strong>ol based on scientific methodology.<br />
A <strong>to</strong>tal number <strong>of</strong> five was thought <strong>to</strong> be an adequate size for a comparison <strong>with</strong>in the limited<br />
research scope <strong>of</strong> a Master’s thesis, yet guaranteeing the pr<strong>of</strong>iciency <strong>of</strong> research <strong>to</strong> draw<br />
18
3. CASE STUDIES<br />
pr<strong>of</strong>ound conclusions. Thus, the sample assessed in this thesis is made up <strong>of</strong> five extremely<br />
different, but reasonably representative <strong>approaches</strong>, in terms <strong>of</strong> collectively addressing a<br />
wide range <strong>of</strong> conservation targets. However, this sample is far from being exhaustive and<br />
the reader should consider that other sets <strong>of</strong> <strong>approaches</strong> could have been conceivable.<br />
To summarise, the selected <strong>approaches</strong> were: the High Conservation Value (HCV) concept,<br />
the Key Biodiversity Areas (KBA) approach, the Ecoregion-Based Conservation (ERBC)<br />
approach, the Focal Species Approach (FSA) and the Rapid Ecological <strong>Assessment</strong> (REA).<br />
3.3 Case Study Approach Pr<strong>of</strong>iles<br />
3.3.1 High Conservation Value (HCV) Concept<br />
The HCV concept was originally developed by the Forest Stewardship Council (FSC) for<br />
sustainable forest practices in the context <strong>of</strong> forest certification in 1999 (High Conservation<br />
Value Forests or HCVF). The aim was <strong>to</strong> <strong>identify</strong> forest <strong>areas</strong> <strong>of</strong> outstanding significance or<br />
critical <strong>importance</strong> (HCV Resource Network 2005-07) <strong>with</strong> the general phrase ‘Value’<br />
emerging, as the method expanded <strong>to</strong> all kinds <strong>of</strong> ecosystems, habitats and alternative forms<br />
<strong>of</strong> land-usage (Interview Partner A). Since this framework integrates ecological, social and<br />
economic aspects, it has been implemented in a variety <strong>of</strong> <strong>areas</strong>, including land-use<br />
planning, conservation advocacy and designing responsible investment policies (HCV<br />
Resource Network 2005-07).<br />
The foundation <strong>of</strong> this concept is the identification <strong>of</strong> up <strong>to</strong> six High Conservation Values<br />
(HCVs) 19 based on either biological, ecological, social or cultural components which are<br />
deemed exceptional or critically important at a local, regional or global level. The HCV is the<br />
area where the value is situated and which needs <strong>to</strong> be appropriately managed <strong>to</strong> either<br />
maintain or enhance it (HCV Resource Network 2005-07). Hence, the HCV concept is a<br />
management orientated process that helps land managers and owners find ways <strong>to</strong><br />
sustainably manage their land (Interview Partner G). In addition, moni<strong>to</strong>ring establishes the<br />
effectiveness and success <strong>of</strong> this management. The process’ success, <strong>to</strong> date, has been<br />
accredited <strong>to</strong> its flexibility, wide ranging stakeholder participation and transparency (HCV<br />
Resource Network 2005-7).<br />
19 Please refer <strong>to</strong> chapter 4.1.2.1 for further detail on the HCV criteria.<br />
19
3. CASE STUDIES<br />
3.3.2 Key Biodiversity Areas (KBA) Approach<br />
Since the dominant threat for most terrestrial and freshwater species is the destruction <strong>of</strong><br />
their habitats (Baillie et al. 2004, xxii), it has become clear that the establishment <strong>of</strong><br />
protected <strong>areas</strong> is an effective <strong>to</strong>ol for biodiversity conservation (Brunner et al. 2001, 126).<br />
The objective <strong>of</strong> the Key Biodiversity Areas (KBA) approach is <strong>to</strong> provide guidelines for<br />
<strong>identify</strong>ing priorities for both expanding and strengthening the global protected area system,<br />
<strong>to</strong> ensure its representativeness, comprehensiveness and long-term effectiveness<br />
(Langhammer et al. 2007, xiv, 6). KBA are globally significant sites for biodiversity which are<br />
large enough and sufficiently interconnected <strong>to</strong> support viable populations <strong>of</strong> species<br />
(Langhammer et al. 2007, 5).<br />
They are identified using globally-set, simple, standard criteria and thresholds 20 based on<br />
their <strong>importance</strong> in maintaining populations <strong>of</strong> species (Eken et al. 2004, 1111). These<br />
globally set, quantitative criteria are based on the concepts <strong>of</strong> vulnerability and<br />
irreplaceability (Langhammer et al. 2007, 7). This consistent methodology identifies and<br />
maps biologically significant sites <strong>of</strong> the size <strong>of</strong> a practical management unit, such as<br />
protected <strong>areas</strong>, concessions and properties. Thus, conservation targets and gaps can be<br />
identified (Conservation International 2008, 1). The identification <strong>of</strong> KBA, at a national or<br />
regional scale, may be the starting point for landscape level conservation planning, as these<br />
priority sites provide the building blocks for maintaining ecological networks (Langhammer et<br />
al. 2007, 6).<br />
The approach builds on and is supported by previous initiatives, such as the IUCN’s Red List<br />
<strong>of</strong> Threatened Species, BirdLife International’s Important Bird Areas (IBA), PlantLife<br />
International’s Important Plant Areas (IPA) and sites identified by the Alliance for Zero<br />
Extinction (AZE), as well as Conservation International (CI). Thus, all taxonomic groups, for<br />
which data is available, are considered (Langhammer et al. 2007, 5). Additionally, this<br />
iterative process allows for the immediate identification <strong>of</strong> important sites using existing data,<br />
while allowing for continuous refinement as new information becomes available<br />
(Conservation International 2008, 2).<br />
20 Please refer <strong>to</strong> chapter 4.1.2.2 for further detail on the KBA criteria and thresholds.<br />
20
3. CASE STUDIES<br />
3.3.3 Ecoregion-Based Conservation (ERBC) Approach<br />
In 1998 the Global 200 <strong>Assessment</strong> presented a valuable method for <strong>identify</strong>ing terrestrial,<br />
freshwater, and marine ecoregions containing significant biodiversity values. In addition, this<br />
analysis performed conservation status assessments on the world’s terrestrial ecoregions.<br />
This provided an estimate <strong>of</strong> the current and future ability <strong>of</strong> an ecoregion <strong>to</strong> maintain viable<br />
species populations, <strong>to</strong> sustain ecological processes and <strong>to</strong> be responsive <strong>to</strong> short and long<br />
term environmental changes. The ecoregions were classified according <strong>to</strong> three categories:<br />
(i) critical / endangered, (ii) vulnerable or (iii) relatively stable / relatively intact. Preliminary<br />
assessments for marine and freshwater ecoregions have also been performed (Ohlson and<br />
Dinerstein 1998, 512). The rationale behind this work is <strong>to</strong> conserve a comprehensive<br />
representation <strong>of</strong> the world’s habitats and ecosystem types, therefore also safeguarding the<br />
broadest range <strong>of</strong> the world’s species and the ecological processes that maintain life<br />
(Dinerstein et al. 2000, 6). This macro-level approach lays the foundation for more fine scale<br />
conservation <strong>approaches</strong>, such as the Ecoregion-Based Conservation (ERBC) approach, <strong>to</strong><br />
<strong>identify</strong> and conserve important targets <strong>with</strong>in these ecoregions (Ohlson and Dinerstein<br />
1998, 512, Dinerstein et al. 2000, 6).<br />
The ERBC approach was originally developed by the World Wide Fund for Nature (WWF)<br />
(Dinerstein et al. 2000; Groves et al. 2004). It arose, in part, from the need <strong>to</strong> find ways <strong>to</strong><br />
operate at a scale (i.e. the ecoregion) large enough <strong>to</strong> achieve conservation results that are<br />
ecologically viable and <strong>to</strong> conserve networks <strong>of</strong> key sites, migration corridors, and the<br />
ecological processes that maintain healthy ecosystems. Hereby it attains full representation<br />
<strong>with</strong>in an ecoregion. Since the scale <strong>of</strong> the ecoregion is <strong>of</strong>ten <strong>to</strong>o large for a detailed analysis<br />
that is required for guidance on specific land management options, ERBC identifies, at the<br />
scale <strong>of</strong> the landscape, priority <strong>areas</strong> as operational units for implementation. This allows for<br />
the development <strong>of</strong> more specific recommendations and involvement <strong>of</strong> local stakeholders<br />
and land managers (Groves et al. 2004, 2).<br />
The foundation <strong>of</strong> the ERBC approach could be considered <strong>to</strong> be the “biodiversity vision<br />
plan” which aims <strong>to</strong> conserve and, where necessary, res<strong>to</strong>re the full expression <strong>of</strong><br />
biodiversity in the long-run. In order <strong>to</strong> achieve this ambitious goal, the approach addresses<br />
not only different spatial, but also different temporal scales (Dinerstein et al. 2000, 16;<br />
Marshall et al. 2004, 17). The goals and strategies identified as part <strong>of</strong> the biodiversity vision<br />
plan are set <strong>with</strong>in a short, medium and long term time frame. Site identification is based on<br />
five explicit conservation criteria 21 , resulting in protected <strong>areas</strong> as core conservation targets<br />
21 Please refer <strong>to</strong> chapter 4.1.2.3 for further detail on the ERBC criteria.<br />
21
3. CASE STUDIES<br />
<strong>with</strong> the establishment <strong>of</strong> a network representing all habitats and ecosystems. The concept<br />
addresses minimal area requirements necessary <strong>to</strong> maintain viable populations and critical<br />
processes (Dinerstein et al. 2000, 19). Thus, it tries <strong>to</strong> capture and maximise the different<br />
scales and conservation targets <strong>of</strong> biodiversity, making it exceptionally comprehensive and<br />
representative (Interview Partner I).<br />
3.3.4 Focal Species Approach (FSA)<br />
Due <strong>to</strong> the threat <strong>of</strong> habitat destruction and degradation (Baillie et al. 2004, 86), and since<br />
data on biodiversity is extremely limited and more <strong>of</strong>ten than not riddled <strong>with</strong> gaps and<br />
biases (The Royal Society 2003, 6; Langhammer et al. 2007, 9), the need <strong>to</strong> act quickly <strong>with</strong><br />
incomplete information has emerged. Therefore, short-cuts relying on the identification <strong>of</strong> a<br />
few key species that could be concentrated on during conservation planning have been<br />
developed (Hess and King 2002, 25). More precisely, <strong>to</strong> halt the loss <strong>of</strong> species from<br />
production landscapes, such as agriculture, forestry and grazing <strong>areas</strong>, it is necessary <strong>to</strong><br />
<strong>identify</strong> the composition, quantity, and structure <strong>of</strong> landscape elements that are required <strong>to</strong><br />
meet the needs <strong>of</strong> the species present (Lambeck 1997, 850).<br />
The Focal Species Approach (FSA) is a multi-species approach used <strong>to</strong> define the<br />
landscape features and the management strategies essential for the survival <strong>of</strong> biota <strong>with</strong>in a<br />
fragmented landscape. It identifies a set <strong>of</strong> focal species, each <strong>of</strong> which is used <strong>to</strong> determine<br />
the exact attributes required by all other species for their survival (Lambeck 1997, 851). All<br />
species considered at risk are grouped according <strong>to</strong> the processes that threaten their<br />
survival 22 . Within each group, the most sensitive species <strong>to</strong> that particular threat is termed<br />
the focal species and is used <strong>to</strong> define the minimum threshold at which the threat can occur<br />
<strong>with</strong>out causing the destruction <strong>of</strong> that particular species (Lambeck 1997, 852). Since the<br />
landscape is designed, managed and, where needed, res<strong>to</strong>red <strong>to</strong> meet the needs <strong>of</strong> the<br />
most demanding species, it is presumed that all other needs will be covered by the<br />
approach, thus, effectively leading <strong>to</strong> the conservation <strong>of</strong> all biota present in the area <strong>of</strong><br />
interest (Lambeck 1997, 851; Lindenmeyer et al. 2002, 338).<br />
This approach provides an efficient and strategic means <strong>of</strong> enhancing the conservation value<br />
<strong>of</strong> a landscape. However, it does not provide a method for achieving a viable landscape (i.e.<br />
one that will retain its biota over time), since it does not <strong>identify</strong> the area over which the<br />
solution must be applied. In the future, this shortcoming may be resolved if further<br />
investigations reveal that landscapes ensuring population viability for the focal species also<br />
22 Please refer <strong>to</strong> chapter 4.1.2.4, for a detailed description <strong>of</strong> the FSA threat groups.<br />
22
3. CASE STUDIES<br />
provide the requirements <strong>to</strong> support viable populations <strong>of</strong> all other species (Lambeck 1997,<br />
855).<br />
3.3.5 Rapid Ecological <strong>Assessment</strong> (REA)<br />
Considering the relatively superficial knowledge <strong>of</strong> biodiversity and the substantial threat<br />
<strong>to</strong>wards it, a need for comprehensive, reliable information about biodiversity resources has<br />
arisen, in order <strong>to</strong> protect this natural heritage. Given the urgency <strong>of</strong> the situation and the<br />
limited financial resources available, the Rapid Ecological <strong>Assessment</strong> (REA) was born by<br />
The Nature Conservancy (TNC) in 1991. This methodology is a scientifically sound survey <strong>of</strong><br />
vegetation types and species (Sayre et al. 2000, 2). Its objective is <strong>to</strong> characterise the<br />
landscape and species level <strong>of</strong> biodiversity <strong>of</strong> large unknown <strong>areas</strong> (Interview Partner I;<br />
Sayre et al. 2000, 33, 81).<br />
The REA utilizes a combination <strong>of</strong> remote sensed imagery, reconnaissance overflights, field<br />
data collection, and spatial information visualization <strong>to</strong> generate useful data for conservation<br />
planning (Sayre et al. 2000, 6). Essentially, the basic REA methodology has remained<br />
relatively unchanged since its original inception. It continues <strong>to</strong> focus on landscape level<br />
conservation, however, adopting a coarse filter-fine filter emphasis <strong>with</strong> the goal <strong>of</strong><br />
conserving landscapes (coarse filter) and subsequently resulting in the conservation <strong>of</strong><br />
species (fine filter) contained <strong>with</strong>in them. The rapid development <strong>of</strong> spatial information<br />
technologies has revolutionized the methodology <strong>of</strong> a REA at the coarse scale. Thus,<br />
refinement <strong>of</strong> and focusing-in <strong>to</strong> more detailed complementary information from the field (fine<br />
scale) is enabled (Sayre et al. 2000, 6).<br />
The REA has not only resulted in the selection <strong>of</strong> priority conservation <strong>areas</strong>, but also in the<br />
establishment <strong>of</strong> protected <strong>areas</strong>, development <strong>of</strong> management plans, design <strong>of</strong> corridors,<br />
and identification <strong>of</strong> future research needs. Furthermore, the resulting mapped and<br />
documented characterisation <strong>of</strong> biodiversity has improved scientific knowledge (Sayre et al.<br />
2000, 7) and has been used for numerous activities, such as providing information for the<br />
identification <strong>of</strong> important ecological sites or <strong>special</strong> conservation <strong>areas</strong> and defining<br />
ecologically based boundaries, amongst several other activities (Sayre et al. 2000, 34).<br />
Overall, the selected <strong>approaches</strong> are not only varied in their origin and objectives, but also in<br />
the conservation targets and scales they address.<br />
23
3. CASE STUDIES<br />
3.4 Interim Discussion<br />
Due <strong>to</strong> the predetermined set <strong>of</strong> key questions, criteria and sub-criteria, certain aspects <strong>of</strong><br />
the <strong>approaches</strong>, dealing <strong>with</strong> strengths, weaknesses and differences in their objectives and<br />
the scale they address would not be included in the actual comparison. In order <strong>to</strong> produce<br />
an overall picture <strong>of</strong> the <strong>approaches</strong>, these issues were briefly addressed.<br />
Through their different origins the majority <strong>of</strong> the assessed <strong>approaches</strong> also have different<br />
objectives, as can be seen in Table 5. The desired outcome <strong>of</strong> any project plays an<br />
important role in which approach should ultimately be implemented for various biodiversity<br />
aspects (Interview partner A). Thus, <strong>to</strong> produce an overall picture <strong>of</strong> the individual<br />
<strong>approaches</strong>, their objectives should also be considered (Interview Partner D).<br />
Table 5: Approach objectives<br />
Approach<br />
HCV concept<br />
KBA approach<br />
ERBC approach<br />
FSA<br />
REA<br />
Source: Own design<br />
Objectives<br />
Management Plans in Production Landscapes<br />
(<strong>identify</strong>ing social and biodiversity values)<br />
Strengthening Protected Area System<br />
Conserve Full Range <strong>of</strong> Biodiversity<br />
Management Plans in Production Landscapes<br />
(halting the further loss <strong>of</strong> species)<br />
Characterisation <strong>of</strong> Biodiversity<br />
The HCV concept focuses on biodiversity and social values <strong>of</strong> outstanding significance or<br />
critical <strong>importance</strong> in production landscapes (Interview Partner D). It is a managemen<strong>to</strong>riented<br />
process which produces management plans and recommendations <strong>to</strong> either<br />
maintain or enhance the identified values at the site scale (Interview Partner D, E and G).<br />
The KBA approach’s objective is <strong>to</strong> provide guidelines for strengthening and expanding the<br />
global protected area system, in order <strong>to</strong> ensure its representativeness, comprehensiveness<br />
and long-term effectiveness (Langhammer et al. 2007, xiv, 6). It not only informs national<br />
conservation planning, but also development planning (Langhammer et al. 2007, xi),<br />
indicating a recipe for implementation success. Biodiversity conservation will have higher<br />
chances <strong>of</strong> success, if strategies are reflected in the national development or poverty<br />
reduction strategies. Simultaneously, development plans can be more effective, if they take<br />
24
3. CASE STUDIES<br />
in<strong>to</strong> account existing plans and priorities for the conservation and sustainable use <strong>of</strong><br />
biodiversity (Millennium Ecosystem <strong>Assessment</strong> 2005a, 14).<br />
In general, the aim <strong>of</strong> the ERBC approach is <strong>to</strong> conserve the full range <strong>of</strong> species, natural<br />
communities, habitats and ecological processes (Dinerstein et al. 2000, 24), <strong>with</strong> the<br />
development <strong>of</strong> strategies for short- (<strong>with</strong>in 1 year), medium- (1-10 years) and long-term<br />
goals (up <strong>to</strong> 100 years) (Dinerstein et al. 2000, 29). Therefore, these objectives allow for a<br />
more comprehensive and integrated analysis. It is the most suited approach for capturing<br />
ecological processes and entire ecosystems (Interview Partner I).<br />
The objective <strong>of</strong> the FSA is <strong>to</strong> prevent any further loss <strong>of</strong> species in production landscapes.<br />
To achieve this, it is necessary <strong>to</strong> determine the composition, quantity and configuration <strong>of</strong><br />
the landscape, <strong>to</strong> meet the needs <strong>of</strong> any species present (Lambeck 1997, 849). Even though<br />
it does not ensure the persistence <strong>of</strong> viable populations over time, it provides an efficient and<br />
strategic <strong>to</strong>ol for enhancing the conservation value <strong>of</strong> the production landscape (Lambeck<br />
1997, 854).<br />
In general, the REA aims <strong>to</strong> characterise the distribution <strong>of</strong> vegetation and specific taxa,<br />
producing baseline biophysical information required for a number <strong>of</strong> different actions. It is an<br />
extremely flexible, iterative methodology that can be employed for a variety <strong>of</strong> different uses<br />
and is exceptionally well suited for information-poor regions <strong>of</strong> the world (Sayre et al. 2000,<br />
11).<br />
In general, the <strong>approaches</strong>’ objectives all differ and careful consideration should be taken<br />
when choosing an approach for <strong>identify</strong>ing <strong>areas</strong> important for biodiversity conservation.<br />
The spatial scale <strong>of</strong> conservation actions required for halting the loss <strong>of</strong> biodiversity is an<br />
ongoing and rigorous debate. However, a wide-spread consensus is that by addressing a<br />
multitude <strong>of</strong> scales, such as the site, landscape and ecoregional scale 23 , the success <strong>of</strong> any<br />
biodiversity conservation approach will be enhanced (Boyd et al. 2008, 42), as this will<br />
ensure the persistence <strong>of</strong> broad scale ecological processes and biodiversity in the long term<br />
(Langhammer et al. 2007, 6; Interview Partner M).<br />
23 Please refer <strong>to</strong> chapter 7, General Terms, for precise definitions.<br />
25
3. CASE STUDIES<br />
Figure 4 provides an overview <strong>of</strong> the different spatial scales the <strong>approaches</strong> address.<br />
Figure 4: Spatial scales addressed by <strong>approaches</strong><br />
Different<br />
Spatial Scales<br />
Site scale<br />
HCV<br />
KBA<br />
ERBC<br />
REA<br />
Landscape scale<br />
HCV<br />
ERBC<br />
FSA<br />
REA<br />
Ecoregional<br />
scale<br />
ERBC<br />
Source: Own design<br />
Since the HCV concept is an approach used for the identification <strong>of</strong> values in a land<br />
management unit (i.e. the site scale) and since work has begun at the landscape level in<br />
order <strong>to</strong> incorporate the wider context (Interview Partner D), this approach successfully<br />
merges two conservation scales, thereby increasing its efficacy 24 .<br />
In contrast, the KBA approach is employed solely at the site scale for the identification <strong>of</strong><br />
global biodiversity priorities. Even though working at this scale alone will prevent the long<br />
term persistence <strong>of</strong> biodiversity (Boyd et al. 2008, 42; Dinerstein et al. 2000, 15; Knight et al.<br />
2007, 258), it forms a solid foundation and encourages additional conservation <strong>approaches</strong><br />
at different scales <strong>to</strong> compliment it (Langhammer et al. 2007, 6; Interview Partner M).<br />
The ERBC approach successfully merges three conservation scales 25 , thereby increasing<br />
its efficacy. Even though the development <strong>of</strong> strategies, at the scale <strong>of</strong> an ecoregion enables<br />
a more comprehensive and integrated approach <strong>to</strong> be undertaken, it also increases the<br />
complexity <strong>of</strong> the process, posing a number <strong>of</strong> challenges for conservation planning (Young<br />
and Fowkes 2003, 16). The ecoregion, as a unit, is useful for understanding environmental<br />
issues and threats that transcend individual agencies and administrative boundaries<br />
24 Please refer <strong>to</strong> chapter 4.3.1.1, Methods for Site Choice, for a more detailed description here<strong>of</strong>.<br />
25 Please refer <strong>to</strong> chapter 4.3.1.3, Methods for Site Choice, for a more detailed description here<strong>of</strong>.<br />
26
3. CASE STUDIES<br />
(Marshall et al. 2004, 4). Hence, conservation practitioners are obliged <strong>to</strong> work in a complex<br />
political, legal and socio-economic environment, adding <strong>to</strong> the complexity <strong>of</strong> the task (Young<br />
and Fowkes 2003, 16). Since this scale is <strong>of</strong>ten <strong>to</strong>o large for specific land management<br />
options and recommendations and for <strong>identify</strong>ing conservation targets at the species level,<br />
landscape and site scale planning <strong>with</strong>in an ERBC approach’s conservation strategy has<br />
rapidly emerged (Dinerstein et al. 2000, 13, 39; Groves et al. 2004, viii, 2). Thus, this<br />
approach is the most comprehensive and representative in terms <strong>of</strong> trying <strong>to</strong> capture and<br />
maximise the different scales <strong>of</strong> biodiversity (Interview Partner I).<br />
The FSA has been designed <strong>to</strong> target conservation issues at the landscape scale (Lambeck<br />
1997, 851), e<strong>special</strong>ly heavily fragmented agricultural or urbanised landscapes (Hugget<br />
2007, 1; Hess and King 2002, 26). Although it does not <strong>identify</strong> the requirements for a viable<br />
landscape in the long term (Lambeck 1997, 855; Hess 2006, 363), it is a start in the right<br />
direction in regions where strong economic pressure makes implementation <strong>of</strong> any<br />
conservation action extremely difficult (Hess and King 2002, 37).<br />
The REA can be implemented at the site and landscape scale. The information on<br />
biodiversity distribution, obtained during the REA, is used <strong>to</strong> design regional conservation<br />
strategies, thereby conserving representative examples <strong>of</strong> biodiversity. This approach places<br />
less emphasis on the understanding <strong>of</strong> ecological processes, but rather characterises the<br />
distribution <strong>of</strong> biota (Sayre et al. 2000, 13). Therefore, it combines two conservation scales.<br />
In conclusion, the long term persistence <strong>of</strong> biodiversity, as well as <strong>identify</strong>ing land<br />
management options and species specific concerns can only be accounted for when<br />
conservation actions are targeted at an ecoregion, landscape and site. Thus, the ERBC<br />
approach best achieves this, followed by the HCV concept and REA. The KBA approach and<br />
FSA are not designed <strong>to</strong> address more than one approach. However, the KBA approach was<br />
designed <strong>to</strong> compliment other initiatives addressing scales other than the site. This is not the<br />
case for the FSA.<br />
In terms <strong>of</strong> <strong>identify</strong>ing and conserving biodiversity, the <strong>approaches</strong> <strong>with</strong> this exact objective<br />
and those combining multiple scales tend <strong>to</strong> be more successful. Therefore, the ERBC<br />
approach was found <strong>to</strong> be the most successful, followed closely by the HCV concept and the<br />
REA. Both the KBA approach and the FSA are - judged from the perspective mentioned<br />
above - the least successful <strong>approaches</strong> for ensuring the long-term persistence <strong>of</strong><br />
biodiversity.<br />
27
4. RESULTS<br />
4. Results<br />
4.1 Pre-<strong>Assessment</strong> – Comparison <strong>of</strong> Site Identification Criteria<br />
4.1.1 Site Identification Criteria and their Characteristics<br />
The five <strong>approaches</strong> all apply criteria for the identification <strong>of</strong> biodiversity relevant <strong>areas</strong>.<br />
This section provides an overview <strong>of</strong> these criteria, showing similarities and differences in<br />
the <strong>approaches</strong>’ identification processes. The criteria herein have been divided and<br />
clustered in<strong>to</strong> three groups: species specific, ecosystem specific and site specific criteria<br />
(see Figure 5).<br />
Figure 5: Overview <strong>of</strong> criteria used for site identification<br />
Approach’s Site<br />
Identification Criteria<br />
Species specific<br />
criteria<br />
4.1.1.1<br />
Site specific<br />
criteria<br />
4.1.1.3<br />
Ecosystem<br />
specific criteria<br />
4.1.1.2<br />
Source: Own design<br />
28
4. RESULTS<br />
4.1.1.1 Species Specific Criteria<br />
Table 6 lists all species specific criteria identified <strong>with</strong>in this thesis and shows<br />
which <strong>approaches</strong> apply these. While species based conservation is <strong>of</strong>ten the most available<br />
proxy for biodiversity conservation, it cannot and should not replace efforts <strong>to</strong> conserve<br />
genetic diversity and ecosystem diversity and functioning (Baillie et al. 2004, 2).<br />
Table 6: Comparison <strong>of</strong> <strong>approaches</strong> concerning species specific criteria<br />
Species Specific Criteria<br />
Approaches<br />
HCV KBA ERBC FSA REA<br />
A. Threatened X X X X O<br />
B. Endemic X X X – O<br />
C. Congregations X X X – –<br />
D. Keys<strong>to</strong>ne species O – X O O<br />
Key: X = addressed fully – = not addressed O = addressed partially<br />
Source: Own design<br />
In this thesis criterion A (threatened) is based on the definition by the IUCN red list which<br />
describes species vulnerability <strong>to</strong>wards extinction (Baillie et al. 2004, 2).<br />
Criterion B (endemic) refers <strong>to</strong> any species confined <strong>to</strong> a given area (Encyclopaedia<br />
Britannica 2009). A common assumption, shared by both national and global prioritisation<br />
initiatives for determining priority <strong>areas</strong> for conservation based on the occurrence <strong>of</strong><br />
threatened and/ or endemic species, is that these <strong>areas</strong> also prove <strong>to</strong> be effective in<br />
safeguarding most <strong>of</strong> the other species (Bonn et al. 2002, 733).<br />
Criterion C (congregation) refers <strong>to</strong> congregations <strong>of</strong> species during any time <strong>of</strong> their life<br />
cycle and species <strong>with</strong> highly clumped distributions <strong>with</strong>in large ranges (Langhammer et al.<br />
2007, 15). This criterion includes habitats or sites that may not be particularly distinctive in<br />
terms <strong>of</strong> biodiversity, but may still act as critical habitats for either long distance, seasonal or<br />
trans-ecoregional migra<strong>to</strong>ry species (Dinerstein et al. 2000, 18), thus, providing suitable<br />
safeguards for their persistence.<br />
The last criterion in this category, criterion D (keys<strong>to</strong>ne species) refers <strong>to</strong> any species that<br />
exerts a powerful influence on biodiversity in neighbouring habitats and across entire<br />
ecosystems (Dinerstein et al. 2000, 18). Keys<strong>to</strong>ne species have been implied <strong>to</strong> be<br />
29
4. RESULTS<br />
responsible for the type <strong>of</strong> an ecosystem, since their disappearance will cause a change in<br />
the ecosystem type (Khanina 1998, 1). Thus, keys<strong>to</strong>ne species should be specific<br />
conservation targets in order <strong>to</strong> maintain the integrity <strong>of</strong> the communities in which they<br />
reside.<br />
However, since species distribution data is extremely limited <strong>to</strong> a handful <strong>of</strong> well known taxa,<br />
in particular vertebrates and vascular plants and these data sets are frequently riddled <strong>with</strong><br />
large gaps or biases due <strong>to</strong> sampling (The Royal Society 2003, 6; Lombard et al. 2003, 56),<br />
this would suggest that other criteria would be more suited for the identification <strong>of</strong><br />
conservation targets (Brooks et al. 2004, 616). With the improvement <strong>of</strong> remote sensing<br />
technology, maps <strong>of</strong> abiotic information, ecosystems and vegetation classes are being<br />
produced at an increasingly finer resolution (Turner et al. 2003, 306), thus making<br />
ecosystem specific criteria important for the identification <strong>of</strong> conservation targets (Pressey<br />
2004, 1677).<br />
4.1.1.2 Ecosystem Specific Criteria<br />
Table 7 provides an overview <strong>of</strong> the ecosystem specific criteria used by the<br />
<strong>approaches</strong> for site identification and delineation.<br />
Table 7: Comparison <strong>of</strong> <strong>approaches</strong> concerning ecosystem specific criteria<br />
Ecosystem Specific<br />
Criteria<br />
E. Large expanses <strong>of</strong><br />
intact habitat<br />
Approaches<br />
HVC KBA ERBC FSA REA<br />
X – X – –<br />
F. Distinctive ecosystems X – X – X<br />
Key: X = addressed fully – = not addressed<br />
Source: Own design<br />
Empirical research has shown that large <strong>areas</strong> <strong>of</strong> intact natural habitat are extremely<br />
successful in conserving the full range <strong>of</strong> species, habitats, and natural processes. However,<br />
large intact habitats are becoming increasingly rare (Dinerstein et al. 2000, 17). These <strong>areas</strong><br />
contain viable populations <strong>of</strong> most, if not all, naturally occurring species and have been<br />
known <strong>to</strong> contain important sub-populations <strong>of</strong> extremely wide ranging species (HCV<br />
Resource Network 2005-07). These species are exceptionally vulnerable and are<br />
30
4. RESULTS<br />
disappearing rapidly, mainly due <strong>to</strong> habitat destruction (Dinerstein et al. 2000, 18). In<br />
general, habitat destruction and degradation are implicated in the decline <strong>of</strong> over 85% <strong>of</strong> the<br />
world’s mammals, birds and amphibians (Baillie et al. 2004, 86). Hence, the <strong>importance</strong> <strong>of</strong><br />
conserving large expanses <strong>of</strong> habitat has widely been recognised (Bryant et al. 1997, pg 8;<br />
Mittermeier et al. 1998, 516; Sanderson et al. 2002, 893). Even though these <strong>areas</strong> <strong>of</strong>ten do<br />
not support high levels <strong>of</strong> biodiversity (Mittermeier et al. 2003, 10309), they are important for<br />
essential ecosystem services and for supporting ecological and evolutionary processes key<br />
<strong>to</strong> the long term persistence <strong>of</strong> biodiversity (Boakes et al. 2009, 1). Thus, criterion E (large<br />
expanses <strong>of</strong> intact habitat) is an extremely important aspect <strong>of</strong> ecosystem specific criteria<br />
used for site identification <strong>of</strong> biodiversity relevant <strong>areas</strong>.<br />
Criterion F (distinctive ecosystems) refers <strong>to</strong> a functional system that includes an ecological<br />
community <strong>of</strong> organisms <strong>to</strong>gether <strong>with</strong> the physical environment, interacting as a<br />
characteristic unit (The Free Dictionary 2009). Since the term biodiversity describes the<br />
whole expression <strong>of</strong> life from genes <strong>to</strong> species <strong>to</strong> ecological interactions and entire<br />
ecosystems, conservation requirements should include the full range <strong>of</strong> biodiversity. Thus,<br />
<strong>identify</strong>ing complete ecosystems should be an integral part <strong>of</strong> conservation planning<br />
strategies and should ensure a better representation <strong>of</strong> global ecosystems (Dinerstein et al.<br />
2000, 17).<br />
However, the sole use <strong>of</strong> ecosystem specific criteria has resulted in the exclusion <strong>of</strong><br />
conservation targets, <strong>of</strong>ten most in need <strong>of</strong> safeguarding (Araújo et al. 2001, 103; Lombard<br />
et al. 2003, 58). Furthermore, these criteria are normally based on percentage targets<br />
(Brooks et al. 2004, 616) which fail <strong>to</strong> recognise that <strong>areas</strong> <strong>of</strong> higher species richness and<br />
endemism may require higher representation targets (Rodriquez et al. 2003, 1095). Thus,<br />
ideally a mixture <strong>of</strong> both species and ecosystem criteria should be implemented in the<br />
identification phase <strong>to</strong> produce an overall better picture (Pressey 2004, 1677).<br />
Ecosystem and species specific criteria cover the biotic components <strong>of</strong> biodiversity. For<br />
many assessment purposes, it is also extremely important <strong>to</strong> gather data on the socioeconomic<br />
and cultural components <strong>of</strong> biodiversity (CBD 2005, 14).<br />
31
4. RESULTS<br />
4.1.1.3 Site Specific Criteria<br />
Therefore, additional criteria for site identification have been implemented by some <strong>of</strong><br />
the <strong>approaches</strong>. Even though these site specific criteria do not play a direct role in<br />
biodiversity conservation (HCV Resource Network 2005-07), they have been mentioned in<br />
this thesis <strong>to</strong> show that some <strong>approaches</strong> do apply a more general and holistic approach <strong>to</strong><br />
<strong>identify</strong>ing biodiversity rich <strong>areas</strong>. These have been listed under the heading, “site specific<br />
criteria” in Table 8.<br />
Table 8: Comparison <strong>of</strong> <strong>approaches</strong> concerning site specific criteria<br />
Approaches<br />
Site specific Criteria<br />
HVC KBA ERBC FSA REA<br />
G. Provision <strong>of</strong><br />
ecosystem services<br />
H. Provision <strong>of</strong> basic<br />
needs<br />
X – X – –<br />
X – – – –<br />
I. Provision <strong>of</strong> traditional<br />
cultural identity<br />
Key: X = addressed fully – = not addressed<br />
Source: Own design<br />
X – – – –<br />
Criterion G (provision <strong>of</strong> ecosystem services) provides benefits <strong>to</strong> human well being<br />
(Millennium Ecosystem <strong>Assessment</strong> 2005a, 2) and therefore, should be maintained,<br />
enhanced or res<strong>to</strong>red (HCV Resource Network 2005-07). Biodiversity plays an important role<br />
in underpinning ecosystem services (Millennium Ecosystem <strong>Assessment</strong> 2005a, ii).<br />
Consequently, the deterioration <strong>of</strong> ecosystems, due <strong>to</strong> an overexploitation <strong>of</strong> ecosystem<br />
services, results in the loss <strong>of</strong> biodiversity (Baillie et al. 2004, xxii) and furthermore, in the<br />
deterioration <strong>of</strong> human well-being (Millennium Ecosystem <strong>Assessment</strong> 2005a, 2). Thus, by<br />
<strong>identify</strong>ing priority <strong>areas</strong> providing ecosystem services, a first step <strong>to</strong>wards conserving<br />
biodiversity is taken.<br />
Criterion H (provision <strong>of</strong> basic needs) recognises that some <strong>areas</strong> are essential for human<br />
well-being by providing food, income or other benefits. By meeting this criterion, the basic<br />
subsistence and security <strong>of</strong> local communities <strong>with</strong>in and surrounding any given area will be<br />
protected (HCV Resource Network 2005-07). Hence, by <strong>identify</strong>ing and delineating any area<br />
meeting this criterion, <strong>with</strong> sustainable management <strong>of</strong> the benefit, the well-being <strong>of</strong> the local<br />
communities, as well as the intactness <strong>of</strong> the area, shall be maintained (Millennium<br />
Ecosystem <strong>Assessment</strong> 2005a, 10). Therefore, biodiversity will indirectly be conserved.<br />
32
4. RESULTS<br />
Criterion I (provision <strong>of</strong> traditional cultural identity) acknowledges that <strong>areas</strong> can be critical<br />
for the cultural identity <strong>of</strong> societies and communities. Thus, <strong>identify</strong>ing and delineating these<br />
<strong>areas</strong> is the first step <strong>to</strong>wards protecting the traditional culture <strong>of</strong> local communities and<br />
thereby maintaining cultural integrity (HCV Resource Network 2005-07).<br />
These three site specific criteria address additional aspects <strong>of</strong> conservation, including socioeconomic<br />
features. By applying a more holistic approach <strong>to</strong> the identification process, it is<br />
hoped for a more successful outcome <strong>of</strong> implementation (Interview Partner K).<br />
None <strong>of</strong> the <strong>approaches</strong> utilizes genetic specific criteria. Despite the well-established theory<br />
regarding genetic structure <strong>of</strong> populations, empirical data is mostly limited <strong>to</strong> a small set <strong>of</strong><br />
species, most commonly related <strong>to</strong> agriculture. Furthermore, continuing assessments over<br />
time and space, which would allow for long term and large scale trends <strong>to</strong> be determined,<br />
are still lacking (Millennium Ecosystem <strong>Assessment</strong> 2005b, 95). Resources for improving our<br />
knowledge <strong>of</strong> species’ genetics will have a huge impact on the future <strong>of</strong> conservation, but<br />
should not be taken from the already scarce resources for management (Gebremedhin et al.<br />
2009, 108). The lack <strong>of</strong> resources is a major reason why large scale databases on genetic<br />
variation are unlikely <strong>to</strong> be established in the foreseeable future. Since conservation planning<br />
requires variables that are easily measured and reliable, genetic specific criteria will<br />
according <strong>to</strong> contemporary scientific research not be included in a conservation approach<br />
any time soon (Lindenmayer and Burgman 2005, 30).<br />
Overall, implementing a mixture <strong>of</strong> species, ecosystem and site specific criteria should<br />
ensure firstly more accurate identification <strong>of</strong> biodiversity relevant sites and secondly greater<br />
implementation success (Pressey 2004, 1677; Interview Partner K).<br />
33
4. RESULTS<br />
4.1.2 Explana<strong>to</strong>ry Notes <strong>to</strong> Approach Criteria Comparison<br />
In order for an area <strong>to</strong> be identified and delineated, all <strong>of</strong> the <strong>approaches</strong> require at least one <strong>of</strong><br />
their approach specific criteria <strong>to</strong> be fulfilled. The <strong>approaches</strong>’ criteria used for the identification <strong>of</strong><br />
biodiversity relevant sites have been described (see below). Even though some <strong>of</strong> the<br />
<strong>approaches</strong> address a broader spectrum <strong>of</strong> criteria (i.e. social values, protection values, etc),<br />
these have only been mentioned in the following chapters and will not be discussed any further.<br />
4.1.2.1 High Conservation Value (HCV) Concept<br />
The key <strong>to</strong> using the HCV concept is the identification <strong>of</strong> six High Conservation<br />
Values (HCVs) which are: HCV1 - Areas containing globally, regionally or nationally<br />
significant concentrations <strong>of</strong> biodiversity values (e.g. endemism, endangered species,<br />
refugia); HCV2 - Globally, regionally or nationally significant large landscape-level <strong>areas</strong>,<br />
where viable populations <strong>of</strong> most, if not all, naturally occurring species exist in natural<br />
patterns <strong>of</strong> distribution and abundance; HCV3 - Areas that are in, or contain, rare, threatened<br />
or endangered ecosystems; HCV4 - Areas that provide basic ecosystem services in critical<br />
situations (e.g. watershed protection, erosion control); HCV5 - Areas fundamental <strong>to</strong> meeting<br />
basic needs <strong>of</strong> local communities (e.g. subsistence, health) and HCV6 - Areas critical <strong>to</strong> local<br />
communities’ traditional cultural identity (<strong>areas</strong> <strong>of</strong> cultural, ecological, economic or religious<br />
significance identified in cooperation <strong>with</strong> such local communities) (HCV Resource Network<br />
2005-07).<br />
The species specific criterion, HCV1, addresses criteria A (threatened), B (endemic) and C<br />
(congregations). In addition HCV1 can partially address criterion D (keys<strong>to</strong>ne species), if the<br />
identified species is on the IUCN red list. For instance, the African elephant, jaguar and<br />
prairie dog are all keys<strong>to</strong>ne species that have been included in the IUCN red list (IUCN<br />
2009). Both ecosystem criteria, E (large intact habitats) and F (distinctive ecosystems), are<br />
met by HCV2 and HCV3, respectively and the site specific criteria G (ecosystem services), H<br />
(basic needs) and F (cultural identity) are captured by HCV4, 5 and 6, respectively.<br />
4.1.2.2 Key Biodiversity Areas (KBA) Approach<br />
The KBA approach bases its site identification and prioritisation on the concepts <strong>of</strong><br />
vulnerability and irreplaceability. KBA are selected <strong>with</strong> regard <strong>to</strong> specific species that<br />
require site specific conservation efforts.<br />
Any area will meet the vulnerability criterion if it contains globally significant numbers <strong>of</strong><br />
threatened species according <strong>to</strong> the IUCN red list (Langhammer et al. 2007, 15). Hence,<br />
34
4. RESULTS<br />
criterion A (threatened) is captured. The irreplaceability criterion will be met if an area<br />
contains a globally significant concentration <strong>of</strong> a species <strong>to</strong>tal population at some point in<br />
that species’ lifecycle. This addresses several aspects <strong>of</strong> irreplaceability, which is divided<br />
in<strong>to</strong> the sub-criteria: restricted range species; species <strong>with</strong> a large, but clumped distribution;<br />
globally significant congregations and source populations; and bioregionally restricted<br />
assemblages (Eken et al. 2004, 1111; Langhammer et al. 2007, 15). Thus, the criteria B<br />
(endemic and C (congregations) are fulfilled.<br />
For each irreplaceability criterion and sub-criterion, thresholds have been established <strong>to</strong><br />
ensure repeatability in the criteria globally, throughout time and <strong>with</strong> implementation by<br />
different practitioners. However, these designated thresholds are part <strong>of</strong> an iterative process,<br />
accounting for temporal changes (Eken et al. 2004, 1112). E<strong>special</strong>ly, thresholds for marine<br />
and freshwater sites require further testing and refinement (Langhammer et al. 2007, 16).<br />
Based on these measures <strong>of</strong> vulnerability and irreplaceability, any area holding species<br />
meeting the defined criteria will be delineated at a size that is or could be potentially<br />
managed for biodiversity conservation. Thus, KBA status is assigned (Langhammer et al.<br />
2007, 15). Although KBA delineation is done through a biological assessment, the need for a<br />
subsequent socio-economic analysis is crucial for establishing effective <strong>to</strong>ols for biodiversity<br />
conservation (Eken et al. 2004, 1117).<br />
4.1.2.3 Ecoregion-Based Conservation (ERBC) Approach<br />
The ERBC approach bases its site identification and prioritisation on five specific<br />
conservation targets. Throughout implementation, emphasis is placed on representation <strong>with</strong><br />
the concept <strong>of</strong> complementarity adding further rigour <strong>to</strong> the selection process. These five<br />
conservation targets are the minimum that should be aimed for under the ERBC approach.<br />
The first target is ‘distinct communities, habitats and assemblages’. Thus, representative<br />
examples <strong>of</strong> all distinct habitat types and species assemblages over their full natural ranges<br />
<strong>of</strong> variation should be identified as priority conservation targets. These will include <strong>areas</strong> <strong>of</strong><br />
exceptional richness, endemism, higher taxonomic uniqueness, or unusual ecological or<br />
evolutionary phenomena (Dinerstein et al. 2000, 18, 19). Here, the ERBC approach<br />
addresses criteria B (endemic) and G (ecosystem services).<br />
The second target is ‘large intact habitats and intact biotas’, addressing criterion E (large<br />
intact habitats) fully (Dinerstein et al. 2000, 18). Here an example would be <strong>to</strong> establish large<br />
protected <strong>areas</strong> that can support and maintain all viable populations, including wide-ranging<br />
species and <strong>to</strong> link the core <strong>areas</strong> via corridors <strong>of</strong> natural habitats <strong>to</strong> create extensive<br />
35
4. RESULTS<br />
networks (Dinerstein et al. 2000, 20). Additionally, this will conserve genetic variation<br />
(Lindenmayer and Burgman 2005, 31).<br />
The third conservation target is ‘keys<strong>to</strong>ne ecosystems, habitats, species and phenomena’,<br />
since certain habitats may influence biodiversity in neighbouring habitats and across entire<br />
ecosystems. Thus, their persistence and intact ecological functioning may be critical for<br />
species and ecological processes in the surrounding <strong>areas</strong> (Dinerstein et al. 2000, 18).<br />
Examples include riparian habitats for flood and erosion control (criterion G – ecosystem<br />
services), species such as elephant or beaver (criterion D – keys<strong>to</strong>ne species) and<br />
phenomena such as natural fires (Dinerstein et al. 2000, 18, 19, 20). Here, criterion E and G<br />
are fully addressed.<br />
The fourth target is ‘distinct large-scale ecological phenomena’ which refers <strong>to</strong> important<br />
targets extending beyond the ecoregion. Examples include <strong>areas</strong> essential <strong>to</strong> either long<br />
distance, seasonal or trans-ecoregional migration <strong>of</strong> species. These sites are not necessarily<br />
<strong>of</strong> high distinctiveness, but their intactness will provide stepping s<strong>to</strong>nes for migra<strong>to</strong>ry species<br />
(Dinerstein et al. 2000, 18), such as birds, bats and monarch butterflies (Dinerstein et al.<br />
2001, x, 35, 37). Thus, criterion C (congregations) is captured.<br />
The fifth and final conservation target <strong>of</strong> the ERBC approach is ‘species <strong>of</strong> <strong>special</strong> concern’<br />
which may include species heavily hunted, depleted in numbers or <strong>special</strong>ised in their<br />
habitat requirements. Conservation plans must take in<strong>to</strong> account strict protection <strong>of</strong> these<br />
populations which may include rare, threatened or endemic species (Dinerstein et al. 2000,<br />
18, 19, 20). Thus, criteria A (threatened) and B (endemic) have been fully captured.<br />
Even though an ERBC approach does not in itself address social and cultural issues, it does<br />
emphasise the need for a subsequent socio-economic analysis (Dinerstein et al. 2000, 11)<br />
ERBC is exceptionally comprehensive and representative in terms <strong>of</strong> trying <strong>to</strong> capture and<br />
maximise the different scales and different conservation targets <strong>of</strong> biodiversity. It is a<br />
representative approach as it addresses several scales: species level, natural communities<br />
and biophysical level. It is, therefore, extremely successful in delineating important ecological<br />
processes and whole ecosystems (Interview Partner I).<br />
4.1.2.4 Focal Species Approach (FSA)<br />
The FSA is not based on either ecosystem or site specific criteria. It is a taxon<br />
based surrogate scheme where a suite <strong>of</strong> focal species is presumed <strong>to</strong> act collectively for<br />
other elements <strong>of</strong> biota (Lindenmayer et al. 2002, 338). The identification <strong>of</strong> the set <strong>of</strong> focal<br />
species and the subsequent site identification rely on an entirely different methodology.<br />
Firstly, all species considered at risk are identified and then distinguished between species<br />
requiring res<strong>to</strong>ration activities and those requiring changes in management strategies.<br />
36
4. RESULTS<br />
Species requiring the reconstruction <strong>of</strong> the landscape will either be resource-limited,<br />
dispersal-limited or area-limited. These species are at least locally, if not regionally or<br />
globally threatened and thus, capture criterion A (threatened).<br />
For resource-limited species, the number <strong>of</strong> individuals the area can support is determined<br />
by the carrying capacity at the time <strong>of</strong> lowest resource availability. Therefore, any res<strong>to</strong>ration<br />
activity should aim <strong>to</strong> increase the local carrying capacity. Patches sustaining small<br />
populations, but which are separated so that no movement <strong>of</strong> these populations is permitted,<br />
contain dispersal-limited species. To ensure their persistence, such species will require<br />
habitat patch connectivity or reduction <strong>of</strong> the threat between patches, thereby enabling<br />
movement (Lambeck 1997, 852).<br />
Area-limited species are those for which habitat patches are <strong>to</strong>o small <strong>to</strong> either support a<br />
breeding pair or a functional social group. This group <strong>of</strong> species can further be subdivided<br />
in<strong>to</strong> the major habitat groups that exist <strong>with</strong>in the area <strong>of</strong> interest.<br />
In contrast, species requiring changes in management strategies will vary, depending on the<br />
area, as the threats and their relative <strong>importance</strong> will also differ. These species have been<br />
termed process-limited (Lambeck 1997, 852).<br />
Each species considered at risk is allocated <strong>to</strong> at least one <strong>of</strong> the four main threat<br />
categories, resource-limited, dispersal-limited, area-limited and process-limited, as described<br />
above. The species in each threat category are then ranked according <strong>to</strong> their vulnerability<br />
<strong>to</strong>wards that threat. The species most sensitive <strong>to</strong>, or most dependent upon, a given process<br />
is termed the focal species, in order <strong>to</strong> determine the intensity, rate or frequency at which<br />
that process should be managed. This will result in a list <strong>of</strong> species, the focal community that<br />
can be used <strong>to</strong> determine different attributes required for the persistence <strong>of</strong> all biota <strong>with</strong>in<br />
the landscape (Lambeck 1997, 853).<br />
This focal community defines the minimum area <strong>of</strong> each patch type, the minimum width,<br />
length and structure <strong>of</strong> connecting vegetation, the appropriate levels <strong>of</strong> critically limiting<br />
resources and the minimum rate or intensity <strong>of</strong> each potentially threatening process. The<br />
needs <strong>of</strong> the set <strong>of</strong> focal species can be used <strong>to</strong> determine the minimum requirements or<br />
thresholds that must be exceeded if the needs <strong>of</strong> all biota are <strong>to</strong> be met (Lambeck 1997,<br />
853). Some keys<strong>to</strong>ne species might be included <strong>with</strong>in one <strong>of</strong> the four groups, whereas<br />
others might not (Noss et al. 1997, 119). Thus, criterion D has partially been captured by the<br />
FSA.<br />
37
4. RESULTS<br />
4.1.2.5 Rapid Ecological <strong>Assessment</strong> (REA)<br />
The main objective <strong>of</strong> a REA is <strong>to</strong> efficiently characterize the landscape and<br />
species level biodiversity <strong>of</strong> large <strong>areas</strong> for which relatively little is known (Interview Partner<br />
I; Sayre et al. 2000, 33, 81). Therefore, the need for a REA depends on the amount <strong>of</strong><br />
available data for the area under consideration and the urgency <strong>of</strong> obtaining new information<br />
for <strong>areas</strong>, habitats and species distributions. Marginally surveyed or un-surveyed <strong>areas</strong>, such<br />
as large, poorly unders<strong>to</strong>od and highly threatened <strong>areas</strong>, are best suited for this application,<br />
e<strong>special</strong>ly when the lack <strong>of</strong> data prevents sound conservation planning (Sayre et al. 2000,<br />
33, 34). Biological information obtained during a REA has, in the past, been used for<br />
numerous activities, such as the identification <strong>of</strong> important ecological sites or <strong>special</strong><br />
conservation <strong>areas</strong> and defining ecologically based boundaries, amongst several other<br />
schemes (Sayre et al. 2000, 34).<br />
The REA normally adopts a coarse filter-fine filter approach, <strong>with</strong> the coarse filter<br />
concentrating on vegetation types and the fine filter on the conservation <strong>of</strong> species (Sayre et<br />
al. 2000, 6). The vegetation fieldwork prioritises the sampling <strong>of</strong> rare and complex vegetation<br />
types based on endemism, representativeness and degree <strong>of</strong> fragmentation (Sayre et al.<br />
2000, 82). Since the unit <strong>of</strong> an ecosystem can be characterised by species composition<br />
(Millennium Ecosystem <strong>Assessment</strong> 2005b, 82), <strong>identify</strong>ing rare vegetation types as<br />
priorities is taken as meeting criterion F (distinctive ecosystem).<br />
Even though species specific criteria do not directly steer a REA, species that are rare,<br />
threatened, endangered or endemic, as well as keys<strong>to</strong>ne species can also be identified as<br />
part <strong>of</strong> this assessment (Sayre et al. 2000, 89, 97). Thus, criterion A (threatened), B<br />
(endemic) and D (keys<strong>to</strong>ne species) are partially captured, as they may form part <strong>of</strong><br />
<strong>identify</strong>ing conservation targets (Sayre et al. 2000, 97). The information obtained during the<br />
fine filter flora and fauna surveys can be used <strong>to</strong> prioritise sites and inform conservation<br />
based management planning (Sayre et al. 2000, 89). The remaining REA does not rely on<br />
any <strong>of</strong> the other approach criteria listed above in Tables 7 and 8.<br />
38
4. RESULTS<br />
4.1.3 Interim Summary I<br />
It is now widely accepted that different biodiversity surrogates (i.e. different approach criteria)<br />
have different advantages and disadvantages. Thus, <strong>with</strong> this knowledge, divergent courses<br />
can be taken (Pressey 2004, 1677). Some conservation planners rely on species specific<br />
criteria, whilst others prefer ecosystem specific criteria (Pressey 2004, 1677) and still others<br />
have taken again a different course, relying on a mixture <strong>of</strong> criteria for identification<br />
purposes (HCV Resource Network 2005-07; Dinerstein et al. 2000, 17, 18). All surrogates<br />
are limited in their outline <strong>of</strong> biodiversity processes and patterns, therefore a more<br />
comprehensive array <strong>of</strong> criteria produces a better picture (Pressey 2004, 1677).<br />
The comparison <strong>of</strong> the <strong>approaches</strong>’ site identification criteria showed that some <strong>of</strong> the<br />
selected <strong>approaches</strong> employ a range <strong>of</strong> criteria for site identification, as can be seen in<br />
Figure 6.<br />
Figure 6: Overview <strong>of</strong> criteria adopted for site identification 26<br />
Approach’s Site<br />
Identification<br />
Criteria<br />
Species specific<br />
criteria<br />
All <strong>approaches</strong><br />
Ecosystem<br />
specific criteria<br />
HCV<br />
ERBC<br />
(REA)<br />
Site specific<br />
criteria<br />
HCV<br />
(ERBC)<br />
Source: Own design<br />
26 Brackets indicate that the grouped criteria were only partially addressed.<br />
39
4. RESULTS<br />
Species specific criteria are most commonly adopted for the identification <strong>of</strong> sites important<br />
for biodiversity conservation. All <strong>approaches</strong> implement the majority <strong>of</strong> criteria grouped under<br />
this heading. One advantage <strong>of</strong> using species specific criteria is that the success <strong>of</strong> the<br />
conservation effort is easier <strong>to</strong> measure (Mace et al. 2006, 18). Species data, either through<br />
direct counts <strong>of</strong> indica<strong>to</strong>r species (Balmford et al. 2005, 212) or through assessments <strong>of</strong><br />
threat (Butchart et al. 2004, 2), provide easier moni<strong>to</strong>ring systems for measuring<br />
effectiveness 27 . In practice, conservation <strong>approaches</strong> <strong>of</strong>ten direct conservation action<br />
<strong>to</strong>wards species and communities, as these are firstly manageable and comprehensible<br />
components <strong>of</strong> biodiversity and secondly, <strong>of</strong>ten hold more appeal <strong>with</strong> the general public<br />
(Mace et al. 2006, 18).<br />
Ecosystem specific criteria are employed by the HCV concept and the ERBC approach. The<br />
REA was added in brackets as it only employs criterion F (distinctive ecosystems). On the<br />
one hand, these criteria tend <strong>to</strong> loose precision. On the other hand, data is more readily<br />
available and consistent than species specific data. Furthermore, ecosystem specific criteria<br />
are able <strong>to</strong> integrate ecological processes and thus contribute <strong>to</strong> the maintenance <strong>of</strong><br />
ecosystem functioning (Margules and Pressey 2000, 245).<br />
The HCV concept is the only one that implements all three criteria listed in the site specific<br />
criteria group. The ERBC approach only implements criterion H (provision <strong>of</strong> ecosystem<br />
services) and thus, has only been added in brackets in Figure 6. For successful<br />
implementation, biological priorities must also be integrated <strong>with</strong> socio-economic<br />
considerations (CBD 2005, 14; Mace et al. 2000, 393), however, these evaluations, as part<br />
<strong>of</strong> a biological assessment, are still in their “infancy stages” (Mace 2000, 393).<br />
Although <strong>approaches</strong> based purely on ecosystem specific criteria are critical for<br />
conservation, they are not a replacement for <strong>approaches</strong> based on species specific criteria<br />
and vice versa (Millennium Ecosystem <strong>Assessment</strong> 2005a, 11). There is no best surrogate.<br />
The choice <strong>of</strong> criteria should depend on data and resource availability. In the majority <strong>of</strong><br />
situations a combination <strong>of</strong> criteria is most practical (Margules and Pressey 2000, 246;<br />
Pressey 2004, 1677).<br />
Judging from the approach criteria used for site identification, the HCV concept is the most<br />
extensive in terms <strong>of</strong> the broad variety it employs. This is followed closely by the ERBC<br />
approach, the REA and then the KBA approach. The FSA must be viewed separately, as it<br />
relies on a completely different set <strong>of</strong> criteria, all <strong>of</strong> which are species based.<br />
27 Please refer <strong>to</strong> chapter 7, General Terms, for a detailed explanation.<br />
40
4. RESULTS<br />
4.2 Strength-Weakness Analysis (SWA)<br />
In order <strong>to</strong> assess the selected <strong>approaches</strong> 28 used <strong>to</strong> <strong>identify</strong> biodiversity relevant <strong>areas</strong> a<br />
strength-weakness analysis was performed based on a predetermined set <strong>of</strong> key questions,<br />
criteria and sub-criteria 29 . These indica<strong>to</strong>rs were divided in<strong>to</strong> thematic groups 30 <strong>to</strong> provide a<br />
clear orientation <strong>to</strong> the reader concerning the <strong>approaches</strong>’ inherent qualities.<br />
The selected <strong>approaches</strong> are the High Conservation Value (HCV) concept, the Key<br />
Biodiversity Areas (KBA) approach, the Ecoregion-Based Conservation (ERBC) approach,<br />
the Focal Species Approach (FSA) and the Rapid Ecological <strong>Assessment</strong> (REA).<br />
For the strength-weakness analysis 31 the Groups I (Ecology), II (Implementation) and IV<br />
(Supplementary) were assessed. This entails criteria A-F and J-M 32 , as shown in Figure 7<br />
(see next page).<br />
Supported by argumentative reasoning 33 the <strong>approaches</strong> were classified according <strong>to</strong> very<br />
weak (--), weak (-), average (O), strong (+) and very strong (++) for each key question <strong>with</strong>in<br />
the respective groups. Hence, a strength-weakness pr<strong>of</strong>ile could be determined for each<br />
approach based on the Groups I, II and IV.<br />
28 Please refer <strong>to</strong> chapter 3.2, Rational behind Approach Selection, for more detail.<br />
29 Please refer <strong>to</strong> the chapter 2.2.2 for an overview <strong>of</strong> all key questions, criteria and sub-criteria.<br />
30 Please refer <strong>to</strong> chapter 2.2.1.1 for an explanation <strong>to</strong> the thematic group divisions.<br />
31 Please refer <strong>to</strong> chapter 2.2.6, Strength-Weakness Analysis, for the exact methodological<br />
description.<br />
32 Please refer chapter 2.2.2, Design <strong>of</strong> <strong>Assessment</strong> Methodology, for an explanation.<br />
33 Please refer <strong>to</strong> Appendix A1 for the argumentative reasoning which enabled a classification <strong>of</strong> the<br />
results.<br />
41
4. RESULTS<br />
Figure 7: Overview <strong>of</strong> criteria assessment: focus on strength-weakness analysis<br />
Strength-Weakness Analysis Ranking No <strong>Assessment</strong> Possible<br />
Group Criteria Group Criteria<br />
Group<br />
Criteria<br />
I. Ecology<br />
A. Addressed<br />
Biodiversity Levels<br />
B. Addressed<br />
Ecosystem Types<br />
III. Input<br />
G. Methods for<br />
Site Choice<br />
H. Required<br />
Res ources<br />
I. Data<br />
Requirements<br />
V. Effectiveness<br />
N. Conserved<br />
Species<br />
O. Protected<br />
Area<br />
C. Geographic<br />
Scale <strong>of</strong> Applicability<br />
D. Level <strong>of</strong> Approach<br />
II. Implementation<br />
E. Implementation<br />
Style<br />
F. Suitability for<br />
Different Users<br />
IV. Supplementary<br />
J. Possibility <strong>of</strong><br />
Scoping <strong>Assessment</strong><br />
K. Consideration <strong>of</strong><br />
Threats/ Ris ks<br />
L. Moni<strong>to</strong>ring<br />
Rec ommendations<br />
M. Management<br />
Recommendations<br />
Source: Own design<br />
42
4. RESULTS<br />
4.2.1 Overview: Strength-Weakness Analysis Criteria <strong>Assessment</strong> Results<br />
The argumentative reasoning and subsequent summary in<strong>to</strong> tabular form enabled the<br />
<strong>approaches</strong> <strong>to</strong> be classified according <strong>to</strong> a more differentiated scale expressed in five<br />
different degrees <strong>of</strong> strong and weak (very weak (--), weak (-), average (0), strong (+) and<br />
very strong (++)) 34 .<br />
Table 9 (see next page) provides an overview <strong>of</strong> these detailed results 35 . The classification <strong>of</strong><br />
the <strong>approaches</strong> is shown individually for each key question, therefore enabling a direct<br />
comparison between them. The overview indicates a clear differentiation <strong>of</strong> the key<br />
questions in Group I (Ecology) and II (Implementation), whereas the outcome for the key<br />
questions in Group IV (Supplementary) shows much less variation. Therefore Group I and II<br />
enable a clear division <strong>of</strong> the <strong>approaches</strong>.<br />
34 Please refer <strong>to</strong> chapter 2.2.6 for a detailed explanation and Appendix A1 for the argumentative<br />
reasoning.<br />
35 Please refer <strong>to</strong> chapter 4.2.2 for the individual strength-weakness pr<strong>of</strong>iles and Appendix A5 for the<br />
detailed assessment results. Furthermore, an overall summary <strong>of</strong> the strength-weakness analysis<br />
results is also provided in chapter 4.4.<br />
43
4. RESULTS<br />
Table 9: Overview: <strong>approaches</strong> according <strong>to</strong> SWA criteria assessment 36<br />
Group Criteria Sub-criteria HCV KBA ERBC FSA REA<br />
I. Ecology<br />
II.<br />
Implementation<br />
A. Addressed<br />
biodiversity levels<br />
B. Addressed<br />
ecosystem types<br />
C. Geographic<br />
scale <strong>of</strong><br />
applicability<br />
D. Level <strong>of</strong><br />
approach<br />
genetic diversity (C1)<br />
species diversity (C2)<br />
ecosystem diversity<br />
(C3) 37<br />
terrestrial (C4)<br />
aquatic (C5)<br />
local (C6)<br />
regional (C7)<br />
global (C8)<br />
private sec<strong>to</strong>r level<br />
(C9)<br />
public sec<strong>to</strong>r level<br />
(C10)<br />
++<br />
C2 and C3<br />
fully<br />
addressed and<br />
C1 indirectly<br />
addressed<br />
-<br />
C4 is partially<br />
addressed and<br />
C5 not<br />
addressed<br />
+<br />
C6 and C8<br />
addressed<br />
fully; C7<br />
partially<br />
addressed<br />
+<br />
C9 addressed<br />
fully; C10<br />
addressed<br />
partially<br />
0<br />
C2 fully<br />
addressed; C1<br />
addressed<br />
indirectly and<br />
C3 not<br />
addressed<br />
+<br />
C4 fully<br />
addressed and<br />
C5 indirectly<br />
0<br />
C6 and C7 fully<br />
partially; C8<br />
addressed fully<br />
+<br />
C9 addressed<br />
partially and<br />
C10 addressed<br />
fully<br />
++<br />
C2 and C3 fully<br />
addressed and<br />
C1 partially<br />
addressed<br />
++<br />
C4 and C5 fully<br />
addressed<br />
++<br />
C7 and C8 fully<br />
addressed and<br />
C6 indirectly<br />
+<br />
C9 addressed<br />
partially; C10<br />
addressed fully<br />
-<br />
C2 addressed;<br />
C2 and C3 not<br />
addressed<br />
0<br />
C4 is fully<br />
addressed and<br />
C5 not<br />
addressed<br />
+<br />
C6, C8 fully<br />
and C7 not<br />
addressed<br />
++<br />
C9 and C10<br />
both fully<br />
addressed<br />
+<br />
C2 and C3 fully<br />
addressed; C1<br />
not addressed<br />
++<br />
C4 and C5 fully<br />
addressed<br />
++<br />
C6, C7 and C8<br />
fully addressed<br />
++<br />
C9 and C10<br />
both fully<br />
addressed<br />
36 Approaches were defined as very weak (--), weak (-), average (0), strong (+) or very strong (++) for each key question and criteria.<br />
37 It should be noted that ecosystem diversity refers <strong>to</strong> the number <strong>of</strong> different ecosystems. Due <strong>to</strong> the scope <strong>of</strong> this thesis a more in depth analysis <strong>of</strong> the<br />
various levels <strong>of</strong> biodiversity, by including ecosystem functioning, was not possible.<br />
44
4. RESULTS<br />
Group Criteria Sub-criteria HCV KBA ERBC FSA REA<br />
II.<br />
Implementation<br />
(continued)<br />
IV.<br />
Supplementary<br />
Source: Own design<br />
E. Implementation<br />
style<br />
F. Suitability for<br />
intended users<br />
J. Scoping<br />
assessment<br />
K. Consideration<br />
<strong>of</strong> threats<br />
L. Moni<strong>to</strong>ring<br />
recommendations<br />
M. Management<br />
recommendations<br />
<strong>to</strong>p-down (C11)<br />
bot<strong>to</strong>m-up (C12)<br />
international experts<br />
(C13)<br />
national experts (C14)<br />
local user groups<br />
(C15)<br />
required resources<br />
(C26)<br />
required time (C27)<br />
internal (C28)<br />
external (C29)<br />
moni<strong>to</strong>ring<br />
recommendations<br />
(C30)<br />
management<br />
recommendations<br />
(C31)<br />
++<br />
C11 and C12<br />
fully<br />
addressed<br />
++<br />
C13, C14 and<br />
C15 are<br />
addressed<br />
fully<br />
++<br />
C26 and C27<br />
fully<br />
addressed<br />
++<br />
C28 and C29<br />
fully<br />
addressed<br />
++<br />
C30 is fully<br />
addressed<br />
++<br />
C31 is fully<br />
addressed<br />
0<br />
C11 and C12<br />
addressed<br />
partially<br />
+<br />
C13 and C14<br />
fully addressed;<br />
C15 partially<br />
addressed<br />
-<br />
C26 and C27<br />
not<br />
determinable,<br />
<strong>with</strong> an inherent<br />
weakness<br />
++<br />
C28 and C29<br />
fully addressed<br />
++<br />
C30 is fully<br />
addressed<br />
++<br />
C31 is fully<br />
addressed<br />
++<br />
C11 and C12<br />
fully addressed<br />
++<br />
C13, C14 and<br />
C15 are<br />
addressed fully<br />
++<br />
C26 and C27<br />
fully addressed<br />
++<br />
C28 and C29<br />
fully addressed<br />
++<br />
C30 is fully<br />
addressed<br />
++<br />
C31 is fully<br />
addressed<br />
++<br />
C11 and C12<br />
addressed<br />
fully<br />
-<br />
C14<br />
addressed<br />
fully; C13 and<br />
C15 not<br />
addressed<br />
0<br />
C26 and C27<br />
not<br />
determinable<br />
++<br />
C28 and C29<br />
fully<br />
addressed<br />
++<br />
C30 is fully<br />
addressed<br />
++<br />
C31 is fully<br />
addressed<br />
++<br />
C11 and C12<br />
fully addressed<br />
++<br />
C13, C14 and<br />
C15 are<br />
addressed fully<br />
++<br />
C26 and C27<br />
fully addressed<br />
++<br />
C28 and C29<br />
fully addressed<br />
++<br />
C30 is fully<br />
addressed<br />
++<br />
C31 is fully<br />
addressed<br />
45
4. RESULTS<br />
4.2.2 Strength-Weakness Pr<strong>of</strong>iles <strong>of</strong> Selected Approaches<br />
The assessed <strong>approaches</strong>’ strength-weakness pr<strong>of</strong>iles 38 were produced from the<br />
classification according <strong>to</strong> a differentiated scale expressed as five degrees <strong>of</strong> strong and<br />
weak (very weak (--), weak (-), average (0), strong (+) and very strong (++)) for each key<br />
question and their respective criteria 39 .<br />
Figure 8 shows an example <strong>of</strong> the strength-weakness pr<strong>of</strong>ile pattern used in this thesis.<br />
Figure 8: Example <strong>of</strong> strength-weakness pr<strong>of</strong>ile scheme<br />
Group<br />
I. Ecology<br />
Criteria<br />
A. Addressed<br />
Biodiversity levels<br />
B. Addressed<br />
ecosystem types<br />
C. Geographic<br />
scale <strong>of</strong> applicability<br />
very<br />
weak<br />
(--)<br />
w eak<br />
(-)<br />
average<br />
(0)<br />
strong<br />
(+)<br />
very<br />
strong<br />
(++)<br />
II.<br />
Implementation<br />
D. Level <strong>of</strong> approach<br />
E. Implementation style<br />
F. Suitability for<br />
intended users<br />
J. Possibility <strong>of</strong> scoping<br />
assessment<br />
IV.<br />
Supplementary<br />
K. Consideration <strong>of</strong><br />
threats<br />
L. Moni<strong>to</strong>rin g<br />
recommendations<br />
Source: Own Design<br />
M. Management<br />
recommendations<br />
The following chapters show separate strength-weakness pr<strong>of</strong>iles (Figures 9-13) for each<br />
assessed approach. Furthermore, an individual explanation and interpretation <strong>of</strong> the results<br />
is <strong>of</strong>fered <strong>to</strong> the reader.<br />
38 For more detailed information <strong>to</strong> the individual pr<strong>of</strong>iles, please refer <strong>to</strong> Appendix A5.<br />
39 Please refer <strong>to</strong> Appendix A1 for the argumentative reasoning behind the classification scheme.<br />
46
4. RESULTS<br />
4.2.2.1 Pr<strong>of</strong>ile <strong>of</strong> High Conservation Value (HCV) Concept<br />
Since the aim <strong>of</strong> this thesis was <strong>to</strong> compare contemporary <strong>approaches</strong> used for<br />
<strong>identify</strong>ing biodiversity relevant sites <strong>to</strong> the HCV concept, the core analysis started by<br />
showing the results obtained for the HCV approach, as can be seen in Figure 9.<br />
Figure 9: HCV strength-weakness pr<strong>of</strong>ile<br />
Group<br />
Criteria<br />
very<br />
weak<br />
(--)<br />
w eak<br />
(-)<br />
average<br />
(0)<br />
strong<br />
(+)<br />
very<br />
strong<br />
(++)<br />
I. Ecology<br />
A. Addressed<br />
Biodiversity levels<br />
B. Addressed<br />
ecosystem types<br />
C. Geographic<br />
scale <strong>of</strong> applicability<br />
II.<br />
Implementation<br />
D. Level <strong>of</strong> approach<br />
E. Implementation style<br />
F. Suitability for<br />
intended users<br />
J. Possibility <strong>of</strong> scoping<br />
assessment<br />
IV.<br />
Supplementary<br />
K. Consideration <strong>of</strong><br />
threats<br />
L. Moni<strong>to</strong>rin g<br />
recommendations<br />
Source: Own design<br />
M. Management<br />
recommendations<br />
In Group I (Environmental), the HCV concept scored very strong for criterion A<br />
(addressed biodiversity levels), as both species diversity and ecosystem diversity are<br />
addressed fully (Jennings et al. 2003, 2) and genetic diversity is indirectly maintained in<br />
HCV2 40 . These maintain viable populations and thus, allow for genetic variation <strong>to</strong> be<br />
conserved (Lindenmayer and Burgman 2005, 31). Criterion B (addressed ecosystem<br />
types) was classified as weak, since the sub-criterion, terrestrial, is only partially met<br />
and the sub-criterion, aquatic, not at all. The concept was designed for forests and even<br />
though it can be adapted <strong>to</strong> other ecosystems, widespread implementation is still lacking<br />
(Jennings et al. 2003, 1, Lindhe 2005-07, 1). Furthermore, aquatic ecosystems cannot<br />
be assessed by the concept, yet (Lindhe 2005-07, 2).<br />
40 The generic HCV definitions are described in chapter 4.1.2.1.<br />
47
4. RESULTS<br />
In Group II (Implementation), the HCV concept was classified strong for the criterion C<br />
(geographic scale <strong>of</strong> applicability). Here the sub-criterion, regional, shows an<br />
apparent weakness. Even though this concept has also been implemented for<br />
conservation purposes at a regional scale, excluded from the FSC, in this context, it will<br />
result in smaller <strong>areas</strong> being set aside for conservation, than would be the case under<br />
conventional conservation planning <strong>to</strong>ols (Interview Partner E). Therefore, applied in this<br />
manner, small islands <strong>of</strong> protected <strong>areas</strong> 41 surrounded by large <strong>areas</strong> <strong>of</strong> development<br />
will be created (Colchester 2005-07, 2). This is an inherent weakness. Hence, the subcriterion,<br />
regional, can only be partially met. Criterion D (level <strong>of</strong> approach) scored a<br />
strong, as the HCV concept attempts <strong>to</strong> <strong>identify</strong> the smallest possible area necessary <strong>to</strong><br />
be set-aside in order <strong>to</strong> save the last threatened area or species. Thus, for the public<br />
sec<strong>to</strong>r level, more traditional conservation planning <strong>approaches</strong> would be better suited,<br />
as these <strong>identify</strong> the largest possible set-aside <strong>areas</strong> 41 (Interview Partner E). In contrast,<br />
criteria E (implementation style) and F (suitability for different users) were both<br />
classified as very strong. For criterion E, the concept adopts a combination <strong>of</strong> <strong>to</strong>p-down<br />
and bot<strong>to</strong>m-up (Interview Partner D) and all three sub-criteria for criterion F are<br />
addressed fully (Interview Partner D) 42 .<br />
In Group IV, (Supplementary), the HCV concept was assigned a very strong<br />
classification for criteria J <strong>to</strong> M. All sub-criteria, as per definition, are fully addressed. Part<br />
<strong>of</strong> the HCV scoping assessment is the implementation <strong>of</strong> a pilot study. This is seen as a<br />
rapid assessment <strong>to</strong> determine whether HCVs are present or not (Pr<strong>of</strong>orest 2005-07, 12;<br />
Pollard 2005, 1). The fieldwork for this assessment can be completed <strong>with</strong>in 2 days<br />
(Pollard 2005, 1). However, if HCVs have been identified during this stage, a full<br />
assessment will always be necessary <strong>to</strong> determine the status and <strong>to</strong> propose<br />
management and moni<strong>to</strong>ring plans and strategies (Pr<strong>of</strong>orest 2005-07, 12).<br />
This analysis produced a strong <strong>to</strong> very strong classification for the majority <strong>of</strong> key questions<br />
for the HCV concept. This result coincides <strong>with</strong> its increasing popularity amongst<br />
practitioners from different industries and <strong>with</strong> the results obtained from the expert<br />
interviews 43 .<br />
41 Please refer <strong>to</strong> chapter 7, General Terms, for a definition <strong>of</strong> protected area which has been used<br />
synonymously <strong>with</strong> set-aside area in this thesis.<br />
42 Please refer <strong>to</strong> Appendix A5-1 for more detailed information.<br />
43 An overview <strong>of</strong> all approach pr<strong>of</strong>iles can be seen in chapter 4.2.3, Interim Summary II. The<br />
comparison there<strong>of</strong> <strong>with</strong> an overall result for the entire assessment is shown in chapter 4.4,<br />
Summary.<br />
48
4. RESULTS<br />
4.2.2.2 Pr<strong>of</strong>ile <strong>of</strong> Key Biodiversity Areas (KBA) Approach<br />
In terms <strong>of</strong> KBA approach’s objectives, scale and criteria it addresses, it contrast<br />
strongly <strong>to</strong> the HCV concept. The results obtained for this approach during the strengthweakness<br />
analysis can be seen in the following figure.<br />
Figure 10: KBA strength-weakness pr<strong>of</strong>ile<br />
Group<br />
Criteria<br />
very<br />
weak<br />
(--)<br />
w eak<br />
(-)<br />
average<br />
(0)<br />
strong<br />
(+)<br />
very<br />
strong<br />
(++)<br />
I. Ecology<br />
A. Addressed<br />
Biodiversity levels<br />
B. Addressed<br />
ecosystem types<br />
C. Geographic<br />
scale <strong>of</strong> applicability<br />
II.<br />
Implementation<br />
D. Level <strong>of</strong> approach<br />
E. Implementation style<br />
F. Suitability for<br />
intended users<br />
J. Possibility <strong>of</strong> scoping<br />
assessment<br />
IV.<br />
Supplementary<br />
K. Consideration <strong>of</strong><br />
threats<br />
L. Moni<strong>to</strong>rin g<br />
recommendations<br />
Source: Own design<br />
M. Management<br />
recommendations<br />
In Group I (Environmental), the KBA approach was classified as average for criterion A<br />
(addressed biodiversity levels), since only the species diversity sub-criterion is fully<br />
met. Ecosystem diversity is not addressed, as the process does not aim <strong>to</strong> <strong>identify</strong> rare,<br />
threatened or endangered ecosystems and genetic diversity is addressed indirectly.<br />
Considering that KBA are large enough and sufficiently interconnected <strong>to</strong> support viable<br />
populations (Eken et al. 2004, 1111), genetic variation is indirectly conserved<br />
(Lindenmayer and Burgman 2005, 31). The KBA criteria were established <strong>to</strong> be applied<br />
across all biogeographic regions consistently and easily (Eken et al. 2004, 1111,<br />
Langhammer et al. 2007, xiii). Thus, the approach has been designed for implementation<br />
in all ecosystem types. However, further testing and refinement <strong>of</strong> criteria for marine and<br />
freshwater environments are required (Langhammer et al. 2007, 16). Due <strong>to</strong> this inherent<br />
49
4. RESULTS<br />
weakness the sub-criterion, aquatic ecosystems, is only addressed partially, and<br />
criterion B (addressed ecosystem types) therefore scored a strong.<br />
In Group II (Implementation), criterion C (geographic scale <strong>of</strong> applicability) was<br />
assigned an average classification, since the sub-criteria regional and local are only<br />
partially met. KBA are identified at a national level 44 <strong>with</strong> site-scale implementation<br />
(Langhammer et al. 2007, xiii). However, since the criteria thresholds (species based)<br />
are all set globally (Knight et al. 2007, 258; Langhammer et al. 2007, xiii), the<br />
identification <strong>of</strong> KBA, at a regional or local level, may result in significant omission and<br />
commission errors. This is caused by a lack <strong>of</strong> resolution, resulting in an inaccuracy <strong>to</strong><br />
assess conservation values at regional or local scales (Knight et al. 2007, 258). In<br />
addition, this resolution shortcoming has presented problems in prioritising KBA,<br />
e<strong>special</strong>ly in countries <strong>with</strong> high concentrations <strong>of</strong> biodiversity. Here any area could be<br />
assigned a KBA status (Interview Partner G). For criterion D (level <strong>of</strong> approach), the<br />
sub-criterion, private sec<strong>to</strong>r level, is partially captured. Even though the approach was<br />
not designed for implementation at this level, it does provide the private sec<strong>to</strong>r <strong>with</strong> a<br />
powerful watch list for <strong>identify</strong>ing sites not suitable for development (Interview Partner<br />
M). Thus, it was classified as strong. In contrast, criterion E (implementation style) only<br />
scored an average. As per definition, the sub-criterion, <strong>to</strong>p-down, is fully met, since the<br />
KBA approach strictly adherences <strong>to</strong> globally set thresholds (Eken et al. 2004, 1112;<br />
Langhammer et al. 2007, 18, 20). However, inherent weakness were identified. This rigid<br />
adherence <strong>to</strong> the globally set criteria causes difficulties in defining priority regions<br />
(Interview Partner G) and may result in omission and commission errors (Knight et al.<br />
2007, 258). For the bot<strong>to</strong>m-up sub-criterion, KBA identification occurs at the national and<br />
only sometimes at the local level (Interview Partner M). Thus, both sub-criteria were only<br />
partially addressed. Criterion F (suitability for intended users) received a strong<br />
classification, as the sub-criteria, national and international experts, are fully met<br />
(Langhammer et al. 2007, 8). Since the KBA identification process is data driven, in that<br />
the international thresholds and criteria need <strong>to</strong> be met, national experts (and<br />
international experts) are vital for data validation (Interview Partner M). The inclusion <strong>of</strong><br />
stakeholders in the delineation process mobilises local pride and ownership at the site<br />
level through the establishment <strong>of</strong> local groups and civil societies (Interview Partner M).<br />
However, participation <strong>of</strong> stakeholders is only encouraged for a refinement <strong>of</strong> boundaries<br />
after the selection <strong>of</strong> KBA (Knight et al. 2007, 258, Langhammer et al. 2007, 48, 50).<br />
Thus, the local user groups sub-criterion is only partially captured.<br />
44 National and regional have been used synonymously in this thesis. Please refer <strong>to</strong> chapter 7,<br />
General Terms.<br />
50
4. RESULTS<br />
In Group IV (Supplementary), the criteria K (consideration <strong>of</strong> threats), L (moni<strong>to</strong>ring<br />
recommendations) and M (management recommendations) were all classified as<br />
very strong. During priority-setting workshops, thematic working groups <strong>identify</strong> overall<br />
biological priorities and <strong>areas</strong> <strong>of</strong> threat and opportunity, both internal or external (García-<br />
Moreno et al. 2007, 322). In addition, threats are also ranked according <strong>to</strong> their severity<br />
which ranges from low, moderate, high, <strong>to</strong> extreme (Gerlach 2008, 322, 323;<br />
Langhammer et al. 2007, 70). Moni<strong>to</strong>ring recommendations are given by the KBA<br />
process. Even though exact moni<strong>to</strong>ring <strong>to</strong>ols are not mentioned, examples here<strong>of</strong> are<br />
provided. These include moni<strong>to</strong>ring <strong>of</strong> the KBA site itself or moni<strong>to</strong>ring <strong>of</strong> rare, threatend<br />
or endangered species <strong>with</strong>in these sites <strong>to</strong> assess their current status. Therefore,<br />
criterion L (moni<strong>to</strong>ring recommendations) is fully met. The delineation <strong>of</strong> KBA occurs at<br />
existing management units, as these ensure that conservation needs reach the species<br />
<strong>of</strong> interest. Thus, they are <strong>areas</strong> that actually are, or can be, suitably managed for<br />
conservation on the ground, either through management <strong>of</strong> protected <strong>areas</strong> or other<br />
appropriate measures (Interview Partner M). In addition, general management<br />
recommendations are provided, again in the form <strong>of</strong> examples. These include examples<br />
<strong>of</strong> habitat res<strong>to</strong>ration strategies or recommendations on captive breeding programmes <strong>to</strong><br />
supplement depleted populations. Thus, this sub-criterion is fully captured. Contrastingly,<br />
criterion J (scoping assessment) was classified as weak, since the approach’s design<br />
does not intend for a scoping assessment.<br />
The obtained pr<strong>of</strong>ile ranging from weak <strong>to</strong> very strong remained predominantly in the<br />
categories <strong>of</strong> average and strong 45 . Due <strong>to</strong> its strong support from leading international<br />
organisations 46 , this result was somewhat surprising.<br />
45 An overview <strong>of</strong> all approach pr<strong>of</strong>iles can be seen in chapter 4.2.3, Interim Summary II. The<br />
comparison there<strong>of</strong> <strong>with</strong> an overall result for the entire assessment is shown in chapter 4.4,<br />
Summary.<br />
46 The organisations supporting this approach have been mentioned in chapter 3.2.2.<br />
51
4. RESULTS<br />
4.2.2.3 Pr<strong>of</strong>ile <strong>of</strong> Ecoregion-Based Conservation (ERBC) Approach<br />
The results obtained for the strength-weakness analysis for one <strong>of</strong> the more<br />
comprehensive <strong>approaches</strong>, in terms <strong>of</strong> its objectives, the scales it addresses and the criteria<br />
it employs, is shown in Figure 11.<br />
Figure 11: ERBC strength-weakness pr<strong>of</strong>ile<br />
Group<br />
Criteria<br />
very<br />
w eak<br />
(--)<br />
w eak<br />
(-)<br />
average<br />
(0)<br />
strong<br />
(+)<br />
very<br />
strong<br />
(++)<br />
I. Ecology<br />
A. Addressed<br />
Biodiversity levels<br />
B. Addressed<br />
ecosystem types<br />
C. Geographic<br />
scale <strong>of</strong> applicability<br />
II.<br />
Implementation<br />
D. Level <strong>of</strong> approach<br />
E. Implementation style<br />
F. Suitability for<br />
intended users<br />
J. Possibility <strong>of</strong><br />
scoping assessment<br />
IV.<br />
Supplementary<br />
K. Consideration <strong>of</strong><br />
threats<br />
L. Moni<strong>to</strong>ring<br />
recommendations<br />
Source: Own design<br />
M. Management<br />
recommendations<br />
In Group I (Environmental), the ERBC approach was classified as very strong for both<br />
criteria. For criterion A (addressed biodiversity levels) all three sub-criteria are fully<br />
captured. Genetic variation is conserved through the conservation <strong>of</strong> viable populations<br />
or metapopulations (Lindenmayer and Burgman 2005, 31) which are conserved in large<br />
intact habitats, one <strong>of</strong> the approach criteria (Dinerstein et al. 2000, 17). Additionally,<br />
specific conservation targets, <strong>with</strong>in each subdivision <strong>of</strong> the ecoregion, aim <strong>to</strong> protect the<br />
genetic diversity <strong>of</strong> species for which data is available. Thus, it is assumed that genetic<br />
diversity <strong>of</strong> all species is also captured (Interview Partner J). Species diversity is<br />
captured at two levels. First, at a coarse level, albeit only partially, as it is assumed that<br />
by protecting plant communities and ecological systems most <strong>of</strong> the biodiversity, genetic,<br />
species and ecosystem diversity will be captured. Second, at a finer level, the<br />
assessment identifies threatened, rare or endemic species requiring a <strong>special</strong> need for<br />
conservation (Marshall et al. 2004, 11). Species diversity is, therefore, fully addressed.<br />
52
4. RESULTS<br />
This approach places emphasis on the conservation <strong>of</strong> all communities and ecosystem,<br />
both aquatic and terrestrial (Groves et al. 2000, 1-1). Through the implementation <strong>of</strong> the<br />
concept <strong>of</strong> complimentarity 47 , rare ecosystems will be prioritised for selection as<br />
conservation targets (Dinerstein et al. 2000, 17). Therefore, criterion B (addressed<br />
ecosystem types) is fully met. However, it should be noted that, <strong>with</strong>in an ecoregion,<br />
prioritisation for specific conservation measures is based on threat status, rather than on<br />
rarity (Interview Partner J).<br />
In Group II (Implementation), criteria C (geographic scale <strong>of</strong> applicability), E<br />
(implementation style) and F (suitability for intended users) all scored very strong 48 .<br />
For criterion C, the two sub-criteria, global and regional, are fully addressed. Ecoregionbased<br />
conservation has been designed for global application (Olson and Dinerstein<br />
1998, 509). When ecoregions are compared, ERBC can be viewed as a globalcontinental<br />
analysis, whereas it becomes a landscape level analysis (i.e. at the local<br />
scale) when analytical work is being performed <strong>with</strong>in the ecoregion (Dinerstein et al.<br />
2000, 14). Thus, both criteria regional and global are completely captured. Whereas, the<br />
sub-criterion for local is only met indirectly, as it is represented through analytical work<br />
being conducted <strong>with</strong>in an ecoregion, but the assessment itself is applied at a larger<br />
scale. In contrast, criterion D (level <strong>of</strong> approach) was assigned a strong classification,<br />
since its sub-criterion, private sec<strong>to</strong>r level, is only partially addressed. The ERBC<br />
approach aims <strong>to</strong> conserve biodiversity at an ecoregional scale. One <strong>of</strong> its goals is <strong>to</strong><br />
conserve blocks <strong>of</strong> natural habitat large enough <strong>to</strong> be resilient and responsive <strong>to</strong> large<br />
scale, short and long term change (Dinerstein et al. 2001, 4). Depending on the<br />
assessment location, this may be difficult <strong>to</strong> achieve at the private sec<strong>to</strong>r level, e<strong>special</strong>ly<br />
in heavily fragmented production landscapes (Interview Partner N). However, ERBC<br />
could, in theory, also be applied in a private sec<strong>to</strong>r setting. For example, in large-scale<br />
logging concessions, such as in Central Africa, where only one tree per hectare, per 25<br />
years is cut (Interview Partner F). Hence, the private sec<strong>to</strong>r level is partially addressed.<br />
The goal <strong>of</strong> the ERBC approach is <strong>to</strong> <strong>identify</strong> <strong>areas</strong> for legal protection. Thus, the subcriterion,<br />
public sec<strong>to</strong>r level is fully addressed.<br />
In Group IV (Supplementary), all four criteria (J, K L and M) were classified as very<br />
strong. During preparation the assessment team should be formed. They should then<br />
design and prepare expert workshops and gather essential data (Dinerstein et al. 2000,<br />
50). These expert workshops should aid in determining available data, its validity and still<br />
47 Please refer <strong>to</strong> chapter 7, General Terms, for a definition.<br />
48 Please refer <strong>to</strong> Appendix A5-3 for more detail.<br />
53
4. RESULTS<br />
required data. In addition, the financial cost <strong>of</strong> the assessment and the required time<br />
should be considered when choosing the assessment team and also when considering<br />
new versus old data (Dinerstein et al. 2000, 55; Groves et al. 2000, 2-1). Therefore, both<br />
sub-criteria for criterion J (scoping assessment) are fully captured. In addition, the subcriteria<br />
for criterion K (consideration <strong>of</strong> threats) are also fully addressed. The ERBC<br />
approach provides a detailed threat assessment <strong>to</strong>ol (Dinerstein et al. 2000, 112, Groves<br />
et al. 2000, vii). The levels <strong>of</strong> threat are determined by the degree <strong>to</strong> which the threat is<br />
isolated <strong>to</strong> a specific footprint, or whether the adverse effects <strong>of</strong> the footprint radiate out<br />
(Interview Partner J). These levels <strong>of</strong> threat are ranked qualitatively, low, medium or<br />
high, from the source. Therefore, zones <strong>of</strong> threat degree or zones <strong>of</strong> degradation<br />
emanating from the centre <strong>of</strong> each source are established. Consequently landscapes<br />
<strong>with</strong>in an ecoregion can be ranked in order <strong>to</strong> pinpoint the area <strong>with</strong> lowest ecological<br />
cost <strong>to</strong> work in. This approach identifies priority <strong>areas</strong> that are highly threatened, but<br />
where these threats can be abated (Interview Partner J). Since the exact location <strong>of</strong> the<br />
threat footprint can either be <strong>with</strong>in or outside <strong>of</strong> the ecoregion, both internal and external<br />
threats are addressed.<br />
In summary, the very strong pr<strong>of</strong>ile obtained for the ERBC approach pr<strong>of</strong>ile corresponded <strong>to</strong><br />
the common opinion that it is extremely comprehensive and successful in conserving<br />
biodiversity (Interview Partner I and J).<br />
54
4. RESULTS<br />
4.2.2.4 Pr<strong>of</strong>ile <strong>of</strong> Focal Species Approach (FSA)<br />
The FSA was included in this assessment, as a direct comparison <strong>to</strong> the HCV<br />
concept, since it is also implemented in production landscapes. The results obtained can be<br />
seen in Figure 12.<br />
Figure 12: FSA strength-weakness pr<strong>of</strong>ile<br />
Group<br />
Criteria<br />
very<br />
w eak<br />
(--)<br />
w eak<br />
(-)<br />
average<br />
(0)<br />
strong<br />
(+)<br />
very<br />
strong<br />
(++)<br />
I. Ecology<br />
A. Addressed<br />
Biodiversity levels<br />
B. Addressed<br />
ecosystem types<br />
C. Geographic<br />
scale <strong>of</strong> applicability<br />
II.<br />
Implementation<br />
D. Level <strong>of</strong> approach<br />
E. Implementation style<br />
F. Suitability for<br />
intended users<br />
J. Possibility <strong>of</strong><br />
scoping assessment<br />
IV.<br />
Supplementary<br />
K. Consideration <strong>of</strong><br />
threats<br />
L. Moni<strong>to</strong>ring<br />
recommendations<br />
Source: Own design<br />
M. Management<br />
recommendations<br />
In Group I (Environmental), criterion A (addressed biodiversity levels) was classified<br />
as weak, as only one <strong>of</strong> the sub-criterions is fulfilled. It only takes in<strong>to</strong> account locally<br />
rare, threatened and endangered species. Genetic diversity and ecosystem diversity are<br />
both not considered. In contrast, criterion B (addressed ecosystem types) was given<br />
an average value, since it was designed for implementation in terrestrial ecosystems, but<br />
not for aquatic ones.<br />
In Group II (Implementation), two <strong>of</strong> the three sub-criteria for criterion C (geographic<br />
scale <strong>of</strong> applicability) are addressed fully, thus, a strong classification was assigned.<br />
The FSA is implemented throughout the world, <strong>with</strong> case studies existing in Australia,<br />
the USA and Italy (Hugget 2007, Hess and King 2002, Bani et al. 2002). Furthermore,<br />
55
4. RESULTS<br />
the FSA is applied at the local level (Hess and King 2002, 26, Hugget 2007, 1). No<br />
examples <strong>of</strong> regional assessments were obtained through literature or expert interviews.<br />
Criterion D (level <strong>of</strong> approach) was assigned a very strong score, as both the private<br />
and public sec<strong>to</strong>r level are fully addressed. The FSA addresses some <strong>of</strong> the more<br />
pressing issues facing conservation in agricultural lands that are predominantly privately<br />
owned (Hess and King 2002, 26). However, it is also applied <strong>to</strong> <strong>areas</strong> <strong>of</strong> both private and<br />
public ownership (Bani et al. 2002, 827). The FSA is typically supported through<br />
partnerships between government, community-based organisations (Hugget 2007, 1)<br />
and landowners (Freudenberger et al. 2004, 9). Thus, the process is part bot<strong>to</strong>m-up, part<br />
<strong>to</strong>p-down and criterion E (implementation style) was therefore classified as very strong.<br />
Criterion F (level <strong>of</strong> approach), on the other hand, was given a weak score, as the subcriteria,<br />
international experts and local user groups, are not met. The identification <strong>of</strong><br />
focal species and their key threats requires input from local or national experts (Hugget<br />
2007, 3, 4; Hess and King 2002, 29).<br />
In Group IV (Supplementary), no information on criterion J (scoping assessment) was<br />
identified, thus it was assigned an average value. The last three criteria K<br />
(consideration <strong>of</strong> threats), L (moni<strong>to</strong>ring recommendations) and M (management<br />
recommendations) were all given a very strong classification, as all sub-criteria are<br />
met 49 .<br />
The FSA obtained a pr<strong>of</strong>ile ranging from weak <strong>to</strong> very strong. This variable result is<br />
reflected in the opinion found in contemporary literature where both proponents and<br />
opponents <strong>of</strong> the approach were identified (Lindenmeyer and Fischer 2003, Hugget<br />
2007, Hess and King 2002).<br />
49 Please refer <strong>to</strong> Appendix A5-4 for more detail.<br />
56
4. RESULTS<br />
4.2.2.5 Pr<strong>of</strong>ile <strong>of</strong> Rapid Ecological <strong>Assessment</strong> (REA)<br />
Contrasting the four previous <strong>approaches</strong>, the REA was added <strong>to</strong> include an<br />
approach based on scientific methodologies. Its pr<strong>of</strong>ile can be seen in Figure 13.<br />
Figure 13: REA strength-weakness pr<strong>of</strong>ile<br />
Group<br />
Criteria<br />
very<br />
w eak<br />
(--)<br />
w eak<br />
(-)<br />
average<br />
(0)<br />
strong<br />
(+)<br />
very<br />
strong<br />
(++)<br />
I. Ecology<br />
A. Addressed<br />
Biodiversity levels<br />
B. Addressed<br />
ecosystem types<br />
C. Geographic<br />
scale <strong>of</strong> applicability<br />
II.<br />
Implementation<br />
D. Level <strong>of</strong> approach<br />
E. Implementation style<br />
F. Suitability for<br />
intended users<br />
J. Possibility <strong>of</strong><br />
scoping assessment<br />
IV.<br />
Supplementary<br />
K. Consideration <strong>of</strong><br />
threats<br />
L. Moni<strong>to</strong>ring<br />
recommendations<br />
Source: Own design<br />
M. Management<br />
recommendations<br />
In Group I (Environmental), criterion A (addressed biodiversity levels) was classified<br />
as strong. Both sub-criteria, species diversity and ecosystem diversity, are fully captured.<br />
The vegetation fieldwork prioritises the sampling <strong>of</strong> rare and complex vegetation types.<br />
Prioritisation is based on a process which includes considerations such as endemism,<br />
representativeness and degree <strong>of</strong> fragmentation (Sayre et al. 2000, 82). Since the unit <strong>of</strong><br />
an ecosystem can be characterised by species composition (Millennium Ecosystem<br />
<strong>Assessment</strong> 2005b, 82), <strong>identify</strong>ing rare vegetation types as priorities is taken as<br />
meeting the sub-criterion, ecosystem diversity. Faunal surveys prioritise target species<br />
for sampling. These species are threatened, endangered or endemic (Sayre et al. 2000,<br />
96). A direct assessment <strong>of</strong> genetic diversity is not part <strong>of</strong> an REA (CBD 2005, 10).<br />
Additionally, it does not specifically foresee the conservation <strong>of</strong> large intact natural<br />
habitats which would enable the conservation <strong>of</strong> genetic diversity (Lindenmayer and<br />
Burgman 2005, 31). Hence, this sub-criterion is not addressed. Criterion B (addressed<br />
57
4. RESULTS<br />
ecosystem types) was classified as very strong, since both sub-criteria are met fully. A<br />
REA can be implemented in both aquatic and terrestrial ecosystems (CBD 2005, 9;<br />
Sayre et al. 2000, 2, 8, 9).<br />
In Group II (Implementation), criterion C (geographic scale <strong>of</strong> applicability) was given<br />
a very strong score. All three sub-criteria are fully captured. REAs have been<br />
implemented throughout the world (Sayre et al. 2000, 3) at both regional (Sayre et al.<br />
2000, 10, 13) and local levels (Sayre et al. 2000, 10, 13; Meerman et al. 2003, 7).<br />
Criterion D (level <strong>of</strong> approach) also scored a very strong. Over the years, REAs have<br />
resulted in the establishment <strong>of</strong>, amongst others, protected <strong>areas</strong>, zoning and boundary<br />
changes, biological corridor design and community-based conservation activities (Sayre<br />
et al. 2000, 16). Hence, the public sec<strong>to</strong>r level is addressed fully. In addition, the private<br />
sec<strong>to</strong>r level is also fully captured, as REAs have been implemented in privately owned<br />
logging concessions (Gillison et al. 1996, 1). Criterion E (implementation style) was<br />
classified as very strong, as the approach can be both bot<strong>to</strong>m-up and <strong>to</strong>p-down. REAs<br />
have been implemented at both a national and local level (Sayre et al. 2000, 8, 9). Thus,<br />
both sub-criteria are met. Additionally, local data sets are produced by a REA which<br />
have benefited research programmes (Sayre et al. 2000, 16) and aided the identification<br />
<strong>of</strong> stakeholders and constituencies (Interview Partner I) 50 .<br />
In Group IV (Supplementary), all criteria J <strong>to</strong> M were classified as very strong <strong>with</strong> all<br />
sub-criteria being fully addressed. During the scoping assessment, the scope, cost,<br />
timing and team composition are identified (Sayre et al. 2000, 35-37). Existing and<br />
potential threats, both internal and external, are pinpointed and ranked according <strong>to</strong> low,<br />
medium or high (Sayre et al. 2000, 119). Any moni<strong>to</strong>ring needs, such as moni<strong>to</strong>ring <strong>of</strong><br />
threatened or endangered species or vegetation types and moni<strong>to</strong>ring <strong>of</strong> threat<br />
abatement practices, are formulated as part <strong>of</strong> management recommendations (Sayre et<br />
al. 2000, 123, 134). One <strong>of</strong> the final stages <strong>of</strong> any REA is the preparation <strong>of</strong><br />
management recommendations and strategies. These may include aspects such as<br />
practices <strong>to</strong> maintain watershed integrity, <strong>to</strong> sustainably use resources, or the creation <strong>of</strong><br />
biological corridors or buffer zones (Sayre et al. 2000, 134).<br />
The very strong results obtained during the analysis <strong>of</strong> the REA correspond <strong>to</strong> the overall<br />
opinion gathered during the interviews (Interview Partner I and J). It is extremely<br />
comprehensive and representative in terms <strong>of</strong> characterising the species and landscape<br />
levels <strong>of</strong> biodiversity (Interview Partner I and J; Sayre et al. 2000, 33, 81).<br />
50 For more detail, please refer <strong>to</strong> Appendix A5-5.<br />
58
4. RESULTS<br />
4.2.3 Interim Summary II<br />
As seen in Figure 14, the individual strength-weakness pr<strong>of</strong>iles show a clear differentiation <strong>of</strong><br />
the <strong>approaches</strong>. The ERBC approach and the REA produced the strongest pr<strong>of</strong>ile for the<br />
strength-weakness analysis. This was followed closely by the HCV concept, then the KBA<br />
approach and the FSA.<br />
Figure 14: Overview <strong>of</strong> all strength-weakness pr<strong>of</strong>iles<br />
Group<br />
Criteria<br />
very<br />
w eak<br />
(--)<br />
weak<br />
(-)<br />
average<br />
(0)<br />
strong<br />
(+)<br />
very<br />
strong<br />
(++)<br />
Group<br />
Criteria<br />
very<br />
weak<br />
(--)<br />
weak<br />
(-)<br />
average<br />
(0)<br />
strong<br />
(+)<br />
very<br />
strong<br />
(++)<br />
I. Ecology<br />
A. Addressed<br />
Biodiversity levels<br />
B. Addressed<br />
ecosystem types<br />
I. Ecology<br />
A. Addressed<br />
Biodiversity levels<br />
B. Addressed<br />
ecosystem types<br />
C. Geographic<br />
scale <strong>of</strong> applicability<br />
C. Geographic<br />
scale <strong>of</strong> applicability<br />
II.<br />
Implementation<br />
D. Level <strong>of</strong> approach<br />
E. Implementation style<br />
II.<br />
Implementation<br />
D. Level <strong>of</strong> approach<br />
E. Implementation style<br />
F. Suitability for<br />
intended users<br />
F. Suitability for<br />
intended users<br />
J. Possibility <strong>of</strong><br />
scoping assessment<br />
J. Possibility <strong>of</strong><br />
scoping assessment<br />
IV.<br />
Supplementary<br />
K. Consideration <strong>of</strong><br />
threats<br />
L. Moni<strong>to</strong>ring<br />
recommendations<br />
IV.<br />
Supplementary<br />
K. Consideration <strong>of</strong><br />
threats<br />
L. Moni<strong>to</strong>ring<br />
recommendations<br />
M. Management<br />
recommendations<br />
HCV Pr<strong>of</strong>ile<br />
M. Management<br />
recommendations<br />
KBA Pr<strong>of</strong>ile<br />
Group<br />
Criteria<br />
very<br />
weak<br />
(--)<br />
weak<br />
(-)<br />
average<br />
(0)<br />
strong<br />
(+)<br />
very<br />
strong<br />
(++)<br />
Group<br />
Criteria<br />
very<br />
weak<br />
(--)<br />
weak<br />
(-)<br />
average<br />
(0)<br />
strong<br />
(+)<br />
very<br />
strong<br />
(++)<br />
I. Ecology<br />
A. Addressed<br />
Biodiversity levels<br />
B. Addressed<br />
ecosystem types<br />
I. Ecology<br />
A. Addressed<br />
Biodiversity levels<br />
B. Addressed<br />
ecosystem types<br />
C. Geographic<br />
scale <strong>of</strong> applicability<br />
C. Geographic<br />
scale <strong>of</strong> applicability<br />
II.<br />
Implementation<br />
D. Level <strong>of</strong> approach<br />
E. Implementation style<br />
II.<br />
Implementation<br />
D. Level <strong>of</strong> approach<br />
E. Implementation style<br />
F. Suitability for<br />
intended users<br />
F. Suitability for<br />
intended users<br />
J. Possibility <strong>of</strong><br />
scoping assessment<br />
J. Possibility <strong>of</strong><br />
scoping assessment<br />
IV.<br />
Supplementary<br />
K. Consideration <strong>of</strong><br />
threats<br />
L. Moni<strong>to</strong>ring<br />
recommendations<br />
IV.<br />
Supplementary<br />
K. Consideration <strong>of</strong><br />
threats<br />
L. Moni<strong>to</strong>ring<br />
recommendations<br />
M. Management<br />
recommendations<br />
ERBC Pr<strong>of</strong>ile<br />
M. Management<br />
recommendations<br />
FSA Pr<strong>of</strong>ile<br />
Group<br />
Criteria<br />
very<br />
weak<br />
(--)<br />
weak<br />
(-)<br />
average<br />
(0)<br />
strong<br />
(+)<br />
very<br />
strong<br />
(++)<br />
I. Ecology<br />
A. Addressed<br />
Biodiversity levels<br />
B. Addressed<br />
ecosystem types<br />
C. Geographic<br />
scale <strong>of</strong> applicability<br />
II.<br />
Implementation<br />
D. Level <strong>of</strong> approach<br />
E. Implementation style<br />
F. Suitability for<br />
intended users<br />
J. Possibility <strong>of</strong><br />
scoping assessment<br />
IV.<br />
Supplementary<br />
K. Consideration <strong>of</strong><br />
threats<br />
L. Moni<strong>to</strong>ring<br />
recommendations<br />
M. Management<br />
recommendations<br />
Source: Own design<br />
REA Pr<strong>of</strong>ile<br />
59
4. RESULTS<br />
4.3 Additional Criteria Analysis<br />
Since the Group III (Input) criteria (G. methods for site choice; H. required resources; I.<br />
data requirements) were <strong>to</strong>o complex <strong>to</strong> be classified only according <strong>to</strong> the characteristics<br />
“strong” and “weak”, an ordinal ranking scheme 51 was designed. The following chapters<br />
provide detailed insight in<strong>to</strong> the <strong>approaches</strong>, resulting in their subsequent ranking 52 , whilst<br />
making the ranking procedures transparent.<br />
An overview <strong>of</strong> the criteria that were ranked is shown in Figure 15.<br />
Figure 15: Overview <strong>of</strong> criteria assessment: focus on ranking<br />
Strength-Weakness Analysis Ranking No <strong>Assessment</strong> Possible<br />
Group Criteria Group Group<br />
Criteria<br />
Criteria<br />
I. Ecology<br />
A. Addressed<br />
Biodiversity Levels<br />
B. Addressed<br />
Ecosystem Types<br />
III. Input<br />
G. Methods for<br />
Site Choice<br />
H. Required<br />
Res ources<br />
I. Data<br />
Requirements<br />
V. Effectiveness<br />
N. Conserved<br />
Species<br />
O. Protected<br />
Area<br />
C. Geographic<br />
Scale <strong>of</strong> Applicability<br />
D. Level <strong>of</strong> Approach<br />
II. Implementation<br />
E. Implementation<br />
Style<br />
F. Suitability for<br />
Different Users<br />
IV. Supplementary<br />
J. Possibility <strong>of</strong><br />
Scoping <strong>Assessment</strong><br />
K. Consideration <strong>of</strong><br />
Threats/ Ris ks<br />
L. Moni<strong>to</strong>ring<br />
Rec ommendations<br />
Source: Own design<br />
M. Management<br />
Recommendations<br />
51 The ranking methodology is explained in chapter 2.2.7, Additional Criteria.<br />
52 The overall ranking <strong>of</strong> the Group III criteria can be seen in chapter 4.3.4, Interim Summary III.<br />
60
4. RESULTS<br />
As can be seen in Figure 16, chapter 4.3.1 deals <strong>with</strong> Methods for Site Choice (criterion G),<br />
whereas 4.3.2 centres around Required Resources (criterion H) and 4.3.3 <strong>with</strong> Data<br />
Requirements (criterion I). Furthermore chapter 4.3.4 (Interim Summary II) <strong>of</strong>fers the reader<br />
an overview <strong>to</strong> the findings concerning the <strong>approaches</strong>’ ranking, before embarking on the<br />
complete summary, discussion and conclusions.<br />
Figure 16: Overview <strong>of</strong> additional criteria<br />
Additional Criteria<br />
Group III<br />
Input<br />
G. Methods For<br />
Site Choice<br />
4.3.1<br />
I. Data<br />
Requirements<br />
4.3.3<br />
H. Required<br />
Required<br />
4.3.2<br />
Source: Own design<br />
61
4. RESULTS<br />
4.3.1 Methods for Site Choice<br />
In order <strong>to</strong> determine the appropriate site for implementation <strong>of</strong> the <strong>approaches</strong>, biodiversity<br />
needs <strong>to</strong> be evaluated (Hill et al. 2005, 65). The exact methodology employed by the<br />
<strong>approaches</strong> varies considerably 53 . The method <strong>of</strong> site choice will always depend on the<br />
objectives and available resources, since the latter will, <strong>of</strong> necessity, have <strong>to</strong> increase when<br />
assessing remote <strong>areas</strong>, large spatial scales, high <strong>to</strong>pographic resolution and a large<br />
number <strong>of</strong> different features (CBD 2005, 11).<br />
The various methods were divided in<strong>to</strong> the three groups: Site visits, surveys and additional<br />
methods (Figure 17).<br />
Figure 17: Overview <strong>of</strong> methods employed for site choice<br />
Methods for Site<br />
Choice<br />
Site Visits<br />
Additional<br />
methods<br />
Surveys<br />
Source: Own design<br />
53 For an overview <strong>of</strong> the individual approach methodology used for site choice, please refer <strong>to</strong><br />
Appendix A6. These have also been described in following chapters, 4.3.1.1-.4.3.1.5.<br />
62
4. RESULTS<br />
In Figure 18, the sub-criteria were further divided according <strong>to</strong> the most important issues as<br />
stated in contemporary literature. Here a detailed overview <strong>of</strong> the methods employed by the<br />
various <strong>approaches</strong> was provided.<br />
As per definition, field surveys and rapid assessments are used synonymously in this<br />
thesis 54 .<br />
Figure 18: Methods employed for site identification<br />
Site Visits Surveys Additional<br />
methods<br />
•Inven<strong>to</strong>ries<br />
KBA, REA<br />
•Rapid assessment<br />
all <strong>approaches</strong><br />
•Indica<strong>to</strong>r species<br />
HCV, ERBC, FSA, REA<br />
•Ground truthing<br />
HCV, ERBC, FSA, REA<br />
•Field surveys<br />
all <strong>approaches</strong><br />
•Expert surveys<br />
ERBC, FSA<br />
•Stakeholder surveys<br />
HCV, ERBC, REA<br />
•Remote sensing<br />
all <strong>approaches</strong><br />
•Existing data<br />
•Models<br />
all <strong>approaches</strong><br />
ERBC<br />
•Environmental indica<strong>to</strong>rs<br />
ERBC<br />
Source: Own design<br />
Inven<strong>to</strong>ries have been employed by the KBA approach (Eken et al. 2005, 3) and REA (CBD<br />
2005, 82). Though this form <strong>of</strong> site visit is highly objective in its field sampling (Sayre et al.<br />
2000, 28), it also tends <strong>to</strong> be resource and time intensive (CBD 2005, 6). For a REA,<br />
sampling intensity will depend on the availability <strong>of</strong> resources (Sayre et al. 2000, 82).<br />
Furthermore, as part <strong>of</strong> a REA, it is not necessary <strong>to</strong> <strong>identify</strong> every plant <strong>to</strong> the species level,<br />
however, certain plants must always be identified <strong>to</strong> this level. These include species<br />
characterising vegetation type, species <strong>of</strong> conservation concern (i.e. endemic, rare or<br />
endangered plants) and species <strong>of</strong> management concern (i.e. exotic or economic plants)<br />
(Sayre et al. 2000, 85).<br />
54 As defined in chapter 7, General Terms.<br />
63
4. RESULTS<br />
Rapid assessments (i.e. field surveys) have been implemented by all <strong>approaches</strong><br />
(Rainforest Alliance 2005, 29; Interview Partner M; Dinerstein et al. 2000, 63; Hugget 2007,<br />
12; Sayre et al. 2000, 82), as these provide a fast, efficient and cost effective method for<br />
producing estimates on <strong>to</strong>tal biodiversity (Oliver et al. 1993, 562).<br />
Indica<strong>to</strong>r species <strong>of</strong>fer a simple and cost-effective way <strong>to</strong> determe numbers, status or<br />
trends <strong>of</strong> biodiversity, as well as habitat quality (Millspaugh and Thompson 2008, 59) and<br />
have been employed by all <strong>approaches</strong>, except the KBA approach (Rayden et al. 2009, 22;<br />
Interview Partner I, Lambeck 1997, 849-856; Sayre et al. 2000, 96).<br />
Ground truthing has been implemented by the HCV concept (Stewart et al. 2000, 20, 25),<br />
the ERBC appproach (Dinerstein et al. 2000, 86) and the REA (Sayre et al. 2000, 29). This<br />
method is predominantly used <strong>to</strong> verify data, such as remotely sensed or land cover maps<br />
(Stewart et al. 2008, 20, 25). It is e<strong>special</strong>ly useful <strong>with</strong> inaccurate or outdated data and<br />
maps (Dinerstein et al. 2000, 86). Additionally, it has also been employed for more detailed<br />
site level mapping, as part <strong>of</strong> a HCV assessment (Rayden et al. 2009, 8).<br />
Stakeholder surveys have been employed by three <strong>of</strong> the five <strong>approaches</strong>, as a method for<br />
site identification (Stewart 2009, 11, 13; Dinerstein et al. 2000, 31, CBD 2005, 18). The<br />
bot<strong>to</strong>m-up approach <strong>of</strong> stakeholder surveys gives the assessment credibility (Stewart et al.<br />
2008, 11, 13; Interview Partner M) by providing more accurate local and regional data sets<br />
and also endowing a sense <strong>of</strong> ownership and commitment <strong>to</strong> the approach (Knight et al.<br />
2007, 258). The KBA approach has not been included here, as stakeholder surveys are only<br />
included for the refinement <strong>of</strong> delineated KBA and not for the delineation process itself<br />
(Langhammer et al. 2007, 50, Knight et al. 2007, 258).<br />
The ERBC approach and the FSA have made use <strong>of</strong> expert surveys for site identification,<br />
as experts provide a vast experience and understanding <strong>of</strong> the biota and threats <strong>to</strong> the area<br />
<strong>of</strong> interest (Dinerstein et al. 2000, 9, Hess and King 2002, 28).<br />
This last sub-criterion was added <strong>to</strong> include any additional methodology which does not fall<br />
under the first four sub-criteria. Examples <strong>of</strong> the sub-criterion, additional methods, include<br />
the use <strong>of</strong> remote sensing technology, existing data, environmental indica<strong>to</strong>rs and predictive<br />
models. Remote sensing technology and existing data have been implemented by all<br />
<strong>approaches</strong> (Stewart et al. 2008, pg 14, 25, 37; Interview Partner M; Dinerstein et al. 2001,<br />
55, 57; Lambeck 1997, 854; Sayre et al. 2000, pg 54) 55 . Environmental indica<strong>to</strong>rs, such as<br />
biophysical data, and predictive models have only been employed by the ERBC approach.<br />
These allow for the best informed decisions <strong>with</strong> limited resources (Dinerstein et al. 2000, 63,<br />
86). Even though the quality <strong>of</strong> environmental indica<strong>to</strong>rs are continuously improving <strong>with</strong> the<br />
55 For a more thorough analysis, please refer <strong>to</strong> section 4.3.3.4, Use <strong>of</strong> Remote Sensing and chapter<br />
4.3.3.1, Use <strong>of</strong> Existing Data.<br />
64
4. RESULTS<br />
advancement <strong>of</strong> remote sensing technology (Turner et al. 2003, 306), taken on their own,<br />
indica<strong>to</strong>rs present certain weaknesses in <strong>identify</strong>ing biodiversity relevant sites (Langhammer<br />
et al. 2007, 10; Interview Partner J). Hence, the use <strong>of</strong> indica<strong>to</strong>rs and predictive models<br />
always has <strong>to</strong> be followed by ground truthing in a certain subset <strong>of</strong> the area <strong>to</strong> verify satellite<br />
imagery and land form composition. (Interview Partner J).<br />
The majority <strong>of</strong> the <strong>approaches</strong> result in an extensive, multilayered GIS database which<br />
permits both spatial analysis and map production (Stewart et al. 2008, 40; Dinerstein et al.<br />
2000, 57, Groves et al. 2000, 14; Langhammer et al. 2007, 29; Sayre et al. 2000, 74). As has<br />
been described above, all <strong>approaches</strong> may make use <strong>of</strong> an array <strong>of</strong> different methods for site<br />
choice.<br />
However, each approach provides guidelines on the methods for site choice. The following<br />
chapters (4.3.1.1-4.3.1.5) cover these recommendations for the assessed <strong>approaches</strong><br />
individually, listing any identified strengths and weaknesses.<br />
4.3.1.1 High Conservation Value (HCV) Concept<br />
The method for site choice relies on a type <strong>of</strong> coarse filter-fine filter approach,<br />
where the coarse filter can be viewed as the landscape level assessment and the fine filter<br />
as the site scale level assessment. The preliminary assessment at the landscape level relies<br />
purely on remotely sensed data which establishes a broad framework, allowing for<br />
subsequent site level decisions (Stewart 2009, 7). By analysing the landscape level, site<br />
scale features are set in<strong>to</strong> the correct context and therefore, the HCV concept, as a whole, is<br />
strengthened (Stewart 2009, 6). Thus, implementation is improved and conservation values<br />
are either maintained or enhanced (Stewart and Rayden 2009, 3).<br />
The site scale analysis relies on existing data and field visits (Stewart 2009, 7). Prior <strong>to</strong> the<br />
field visit and during the planning stage <strong>of</strong> the assessment, data is sourced from the remotely<br />
sensed information sets, literature reviews, available public sec<strong>to</strong>r maps and lists <strong>of</strong> possibly<br />
present indica<strong>to</strong>r species, amongst others (Stewart et al. 2008, 13, 14, 15). Due <strong>to</strong> the<br />
generally short field surveys, on average about 5-10 days (Interview Partner D), the majority<br />
<strong>of</strong> data for site choice is gathered through rapid assessments and stakeholder surveys.<br />
However, examples <strong>of</strong> aerial surveys by helicopter also exist (Rainforest Alliance 2005, 30).<br />
These surveys increase the resolution <strong>of</strong> data obtained at the landscape level assessment<br />
(Stewart 2009, 7). In addition, stakeholder surveys are extremely important in gathering<br />
species sightings data, determining the socio-economic situation (also in the wider<br />
65
4. RESULTS<br />
landscape, e<strong>special</strong>ly for possible external threat identification) (Rainforest Alliance 2005, 31,<br />
58), avoiding or reducing conflicts arising from operations and ensuring the transparency <strong>of</strong><br />
the process and therefore, also strengthening the credibility <strong>of</strong> the decision-making (Stewart<br />
2009, 9).<br />
Hence, through its methods for site choice, the HCV concept not only effectively merges the<br />
site and landscape level conservation scale, but also increases its implementation success<br />
through the incorporation <strong>of</strong> stakeholder knowledge and opinion (Interview Partner M).<br />
4.3.1.2 Key Biodiversity Areas (KBA) Approach<br />
The KBA approach identifies conservation targets at the site level <strong>with</strong> the exact<br />
mechanism for site choice depending on the national institutions implementing the<br />
framework.<br />
In order for any area <strong>to</strong> be assigned KBA status, the species based criteria and thresholds<br />
need <strong>to</strong> be met. Whether precise inven<strong>to</strong>ries, stakeholder surveys, rapid assessments or<br />
indica<strong>to</strong>r species are used, is always left up <strong>to</strong> the implementing body (Interview Partner M).<br />
Unfortunately a thorough literature review did not reveal any exact mechanisms in the choice<br />
for sites.<br />
International organisations support the identification process through access <strong>to</strong> literature,<br />
remote sensing data or site specific biodiversity database sets (Interview Partner M). It is,<br />
however, important <strong>to</strong> mention that identification and refinement <strong>of</strong> KBA is an iterative<br />
exercise, remaining flexible in<strong>to</strong> the future and being continuously improved as land-use<br />
patterns change, as habitat destruction progresses and as underlying data and datasets are<br />
updated (García-Moreno et al. 2007, 46; Interview Partner M). Previously, identification has<br />
<strong>of</strong>ten occurred based solely on literature, museum specimens and remotely sensed data,<br />
due <strong>to</strong> the funding structure <strong>of</strong> the process <strong>with</strong> no field work component being included in<br />
the assessment (Interview Partner M). Furthermore, stakeholder involvement is only<br />
employed for refining already delineated KBA, not for the actual identification and delineation<br />
process (Langhammer et al. 2007, 50). In addition, the sole reliance on globally set criteria<br />
and thresholds, being purely <strong>to</strong>p-down, limits the provision <strong>of</strong> perhaps more accurate local or<br />
regional data by stakeholders. This may prevent a sense <strong>of</strong> ownership and commitment<br />
(Knight et al. 2007, 258) and result in a reduction in implementation success (Interview<br />
Partner M).<br />
In summary, these shortcomings may cause the inclusion <strong>of</strong> commission and omission errors<br />
in the identification and subsequent delineation phase <strong>of</strong> the KBA process (Knight et al.<br />
2007, 259) and should urgently be addressed.<br />
66
4. RESULTS<br />
4.3.1.3 Ecoregion-Based Conservation (ERBC) Approach<br />
In order <strong>to</strong> determine the exact site location, the site choice relies firstly on the<br />
global ecoregion map <strong>of</strong> Ohlson and Dinerstein (1998). These ecoregions are small enough<br />
<strong>to</strong> receive correct conservation attention, roughly averaging 15 million ha (median 5,6 million<br />
ha), a finer level <strong>of</strong> resolution than, for example, biodiversity hotspots (Ohlson et al. 2001,<br />
934). However, the Global 200 ecoregions are still an agglomeration <strong>of</strong> several regional<br />
ecoregions and therefore require decisions on the exact scale and assessment capacity <strong>to</strong><br />
be made. Hence, a boundary refinement is completed by expert surveys (Dinerstein et al.<br />
2000, 35). The resolution <strong>of</strong> delineation is then increased further until finally sub-regions are<br />
also delineated as conservation targets (Dinerstein et al. 2000, 36). These targets are<br />
identified through a combination <strong>of</strong> methods, such as indica<strong>to</strong>rs, predictive models, remote<br />
sensing and targeted stakeholder and expert surveys, allowing for the best outcome <strong>with</strong><br />
limited time and resources.<br />
The exact combination <strong>of</strong> methods will depend on the availability <strong>of</strong> data for the specific<br />
ecoregion <strong>of</strong> interest (Dinerstein et al. 2000, 63, 75) and follows a coarse filter-fine filter<br />
approach, a powerful <strong>to</strong>ol which enables the most extensive collection <strong>of</strong> biodiversity <strong>to</strong> be<br />
represented (Marshall et al. 2004, i). Conservation targets are selected at multiple spatial<br />
scales and levels <strong>of</strong> biodiversity and should include both aquatic and terrestrial types<br />
(Groves et al. 2000, vi).<br />
The primary focus <strong>of</strong> the ERBC assessment should be <strong>to</strong> <strong>identify</strong> ecological characteristics<br />
and critical processes, such as those important for maintaining ecosystem integrity. In some<br />
cases, the maintenance <strong>of</strong> conserving these characteristics may be more important than<br />
conserving local hotspots <strong>of</strong> endemism (Dinerstein et al. 2000, 40). This focus is captured in<br />
the coarse filter which relies on ecological groups, or assemblages <strong>of</strong> plant species present<br />
in repeated patterns across the ecoregion (Marshall et al. 2000, 12).<br />
From here the prime conservation priorities, requiring immediate action, are determined<br />
(Dinerstein et al. 2000, 44) by applying the criteria <strong>of</strong> complementarity 56 , conservation value,<br />
threat and feasibility <strong>to</strong> each <strong>of</strong> these sites (Groves et al. 2000, x, 8-1). This fine filter<br />
identifies species which, due <strong>to</strong> their rare, threatened or endemic status, are not likely <strong>to</strong> be<br />
captured by the coarse filter. Distributional and population data on these species is <strong>of</strong>ten<br />
available through global, national, regional or local datasets which are then complemented<br />
by expert knowledge (Marschall et al. 2000, 12). In the absence <strong>of</strong> available data, a REA<br />
may be performed <strong>to</strong> fill any gaps (Interview Partner I). The conservation goal, formulated<br />
56 Please refer <strong>to</strong> chapter 7, General Terms, for a definition here<strong>of</strong>.<br />
67
4. RESULTS<br />
during the “biodiversity vision plan”, is <strong>to</strong> <strong>identify</strong> the minimum viable number <strong>to</strong> ensure the<br />
long-term persistence <strong>of</strong> these species <strong>of</strong> interest (Groves et al. 2000, viii).<br />
Determining which priority sites are most feasible for successful conservation (i.e. which<br />
<strong>areas</strong> have the right enabling conditions?) is difficult <strong>to</strong> achieve and also adds <strong>to</strong> the time<br />
and cost <strong>of</strong> the identification phase (Interview Partner I).<br />
However, the ERBC approach is the most comprehensive and the most representative in<br />
terms <strong>of</strong> trying <strong>to</strong> capture and maximise different scales and conservation targets <strong>of</strong><br />
biodiversity. Furthermore, it probably is the most successful in delineating important<br />
ecological processes and entire ecosystems (Interview Partner I) which ensures the long<br />
term persistence <strong>of</strong> biodiversity. This coincides <strong>with</strong> the results obtained here, namely that<br />
this approach is able <strong>to</strong> employ the broadest range <strong>of</strong> different methods for site choice,<br />
therefore, making it also the most flexible in its use <strong>of</strong> data sources and data acquisition 57 .<br />
4.3.1.4 Focal Species Approach (FSA)<br />
The first step in <strong>identify</strong>ing the conservation site is the identification <strong>of</strong> threats <strong>to</strong><br />
the area <strong>of</strong> interest. Species considered susceptible <strong>to</strong> the different threats are grouped and<br />
the most sensitive one, <strong>to</strong>wards a given threat, is identified (Lambeck 1997, 851). For the<br />
identification <strong>of</strong> threats and subsequent focal community determination, various methods<br />
have been employed. These include expert surveys and literature reviews (Hess and King<br />
2002, 29, 35) or analysis <strong>of</strong> existing data sets and validation through field surveys (Brooker<br />
2002, 187; Bani et al. 2002, 827; Lambeck 1997, 852).<br />
Within the production landscape (i.e. the area under consideration) any remaining remnant<br />
patches are next identified through aerial pho<strong>to</strong>graphy and then validated through vegetation<br />
surveys. In addition, the habitat quality <strong>of</strong> these patches is also established during surveying<br />
(Brooker 2002, 188). To determine the remnant patches required by the set <strong>of</strong> focal species,<br />
the following needs <strong>to</strong> be established: the focal species’ habitat requirements, an estimation<br />
<strong>of</strong> the range <strong>of</strong> population densities and an estimation <strong>of</strong> viable population sizes. From this,<br />
the area <strong>of</strong> habitat able <strong>to</strong> maintain viable populations <strong>of</strong> each focal species can be<br />
determined (viable population size divided by density). Thus, the required habitat size for a<br />
focal species can be mapped and then overlaid <strong>with</strong> all other focal species maps (Hess and<br />
King 2002, 35). Again various methods have been applied <strong>to</strong> determine this. These may<br />
include literature reviews followed by expert surveys (Hess and King 2002, 35), literature<br />
reviews followed by a statistical analyses (Brooker 2002, 187) or site surveys followed by a<br />
statistical analyses (Bani et al. 2002, 828).<br />
57 This has been described in detail in chapter 4.3.3.<br />
68
4. RESULTS<br />
The primary criticism <strong>of</strong> FSA deals <strong>with</strong> the assumption that the identified focal community<br />
covers the needs <strong>of</strong> all biota <strong>with</strong>in a given landscape. This argument has been raised by<br />
several authors (e.g. Noss et al. 1997, 118; Lindenmayer et al. 2002, 338; Lindenmayer and<br />
Fischer 2003, 150). Due <strong>to</strong> the complex and <strong>of</strong>ten poorly unders<strong>to</strong>od requirements <strong>of</strong><br />
individual species, this taxon-based surrogate approach attempts <strong>to</strong> reach an unrealistic<br />
goal, e<strong>special</strong>ly since conservation actions for one particular taxon do not result in successful<br />
conservation <strong>of</strong> other taxa. The effects <strong>of</strong> landscape change and habitat fragmentation or<br />
alteration can vary among species (Robinson et al. 1992, 54) and among groups <strong>of</strong> species<br />
(Gascon et al. 1999, 223).<br />
A second critique lies in the identification <strong>of</strong> focal species, key threatening processes and<br />
their interactions. Identifying the focal species and their threats has caused difficulties due <strong>to</strong><br />
a general lack <strong>of</strong> available species data (Lindenmayer et al. 2002, 340).<br />
4.3.1.5 Rapid Ecological <strong>Assessment</strong> (REA)<br />
To achieve an efficient characterisation <strong>of</strong> the landscape and species level <strong>of</strong><br />
biodiversity, using scientifically sound methodology, the REA first delineates either the<br />
vegetation classes or the land use-land cover classes through satellite imagery and aerial<br />
pho<strong>to</strong>graphy. This is important firstly <strong>to</strong> characterise and map the distribution, abundance<br />
and condition <strong>of</strong> biodiversity at the landscape level and secondly <strong>to</strong> establish a sampling<br />
framework <strong>with</strong>in which <strong>to</strong> conduct field sampling (Sayre et al. 2000, 81). Next an overflight<br />
should provide a general familiarity <strong>of</strong> the study area and collect valuable data on vegetation<br />
types (Sayre et al. 2000, 70). Following this, grond truthing is performed <strong>to</strong> <strong>identify</strong> and verify<br />
the delineation <strong>of</strong> vegetation classes. The intensity <strong>of</strong> sampling will depend on the exact<br />
objective <strong>of</strong> the assessment (Sayre et al. 2000, 82; Meerman et al. 2003, 4). The field team<br />
collects data on vegetation structure and dominance and on environmental parameters, such<br />
as slope, aspect and <strong>to</strong>pographic positioning. In addition, plant diversity at the species level<br />
is also characterised and specimens are collected as part <strong>of</strong> a thorough inven<strong>to</strong>ry (Sayre et<br />
al. 2000, 89). Subsequently, fauna inven<strong>to</strong>ries can be taken at these sites (Sayre et al. 2000,<br />
93). The fauna analysed normally includes birds, mammals, reptiles, amphibians and, where<br />
appropriate, fish or invertebrates (Sayre et al. 2000, 96; Meerman et al. 2003, 4). To facilitate<br />
the maximum number <strong>of</strong> species identified, multiple field visits should be made, taking in<strong>to</strong><br />
account seasonality (Meerman et al. 2003, 5). However, this choice <strong>of</strong> methodology is<br />
extremely time and personnel intensive (Interview Partner I). The choice <strong>of</strong> surveyed taxa will<br />
depend on the time and resources available (Sayre et al. 2000, 95) and is also <strong>of</strong>ten based<br />
69
4. RESULTS<br />
on such considerations as conservation value (i.e. target species), indica<strong>to</strong>r value (i.e.<br />
indica<strong>to</strong>r species), ecosystem value (i.e. keys<strong>to</strong>ne species) and detectability (Sayre et al.<br />
2000, 96). Target species for conservation are any species that are listed as threatened or<br />
endangered by the IUCN red list or listed in appendix I or II <strong>of</strong> CITES (Sayre et al. 2000, 98).<br />
The REA prouces a final map <strong>of</strong> vegetation types derived from image interpretation and<br />
verified in the field. This map is a comprehensive characterisation <strong>of</strong> landscape and site<br />
level biodiversity and is extremely suitable for management planning. It also forms the basis<br />
for threat assessments and the formulation <strong>of</strong> recommendations. In addition, other thematic<br />
maps may be produced. Again, this will depend on the exact objectives and may include<br />
species <strong>of</strong> conservation concern maps or threat maps (Sayre et al. 2000, 74; Meerman et al.<br />
2003, 45).<br />
The REA employs a broad range <strong>of</strong> methods for site identification and is therefore extremely<br />
comprehensive in its characterisation <strong>of</strong> the landscape under consideration. It is, however,<br />
notably time and resource intensive which is described in the subsequent chapter.<br />
Overall, the ERBC approach is able <strong>to</strong> implement the most broad range methods. This is<br />
followed closely by the REA, then the HCV concept and the FSA. The KBA approach makes<br />
use <strong>of</strong> the least amount <strong>of</strong> methods for site choice.<br />
A ranking <strong>of</strong> the <strong>approaches</strong> for the criterion G (Methods for Site Choice) is covered in<br />
chapter 4.3.4.<br />
70
4. RESULTS<br />
4.3.2 Required Resources<br />
The majority <strong>of</strong> information for this criterion (H. Required Resources) was obtained from the<br />
interviews, predominantly in the form <strong>of</strong> estimations. These show great variations for all three<br />
sub-criteria.<br />
Minimum and maximum values 58 for all three criteria have been listed in Table 10. The<br />
financial cost estimates have been converted <strong>to</strong> euros (€) 59 and figures from earlier years<br />
were not adjusted for inflation.<br />
Table 10: Overview <strong>of</strong> required resources<br />
HVC KBA ERBC FSA REA<br />
Financial<br />
Resources<br />
(€) 59 • 5,600-<br />
65,000<br />
• 32,500<br />
(Country<br />
wide)<br />
• 100,000-<br />
235,000<br />
• 6,500-<br />
60,000<br />
• 50,000-<br />
170,000<br />
Human<br />
Resources<br />
Time<br />
Required<br />
Site size<br />
(ha)<br />
• International<br />
and/ or<br />
national<br />
experts;<br />
• Minimum: 4<br />
experts<br />
• 3-6 experts<br />
<strong>with</strong><br />
validation by<br />
expert panel<br />
• Very human<br />
resource<br />
intensive;<br />
• Many<br />
international<br />
and/ or<br />
national<br />
experts<br />
• University<br />
students<br />
and/ or<br />
• national<br />
experts<br />
• Many<br />
international<br />
and/ or<br />
national<br />
experts<br />
• 1-6 months • ~ 3 years • 1,5-2 years • 3-4 months • 12 months<br />
• ~ 100-<br />
200,000<br />
Key: n.d. = not determined<br />
ha = hectare<br />
Source: Own design<br />
• n.d.<br />
• 400,000-<br />
3,6 mill<br />
• ~ 1,000s -<br />
100,000s<br />
• n.d.<br />
58 For a detailed listing <strong>of</strong> all obtained information for each individual approach, please refer <strong>to</strong><br />
Appendix A7.<br />
59 Converted currency: XE (1995-2009): The Universal Currency Converter; (retrieved 18.10.2009)<br />
http://www.xe.com/<br />
1 US$ = 0.67 €; 1 € = 1.49 US$<br />
1 GB£ = 1.13 €; 1 € = 0.89 GB£<br />
71
4. RESULTS<br />
In general, the identification <strong>of</strong> sites always requires the input <strong>of</strong> experts, irrespective <strong>of</strong> the<br />
approach used (Interview Partner A). In addition, the cost <strong>of</strong> any approach, or the<br />
identification phase there<strong>of</strong>, will depend on the size <strong>of</strong> the area <strong>to</strong> be assessed and on<br />
available data, time and experts <strong>to</strong> perform the assessment (Interview Partner D and J).<br />
Furthermore, the objective <strong>of</strong> the approach and therefore the quality <strong>of</strong> the required outcome<br />
will also play a significant role in the amount <strong>of</strong> resources needed (Interview Partner I).<br />
The following chapters (4.3.2.1 - 4.3.2.5) provide explanations <strong>to</strong> the resource requirements<br />
<strong>of</strong> the individual <strong>approaches</strong>.<br />
4.3.2.1 High Conservation Value (HCV) Concept<br />
The financial resources 60 required for the HCV assessment range from 5,600€ <strong>to</strong><br />
65,000€ (Interview Partner D and K). It should be noted that the values on cost and size<br />
obtained from Interview Partner C (100,000€ <strong>to</strong> map 10 mill hectares) were only possible at a<br />
very low resolution and <strong>with</strong> a lot <strong>of</strong> existing data (Interview Partner C) and have therefore<br />
not been used as maximum values for cost and site size. The minimum cost <strong>of</strong> an HCV<br />
assessment is approximately 5,600€ for a medium <strong>to</strong> large forestry operation <strong>with</strong> an<br />
average <strong>of</strong> 7,500€ <strong>to</strong> 11,000€. The average forest management unit (FMU) was estimated as<br />
100 <strong>to</strong> 10,000 hectares (Interview Partner D). The highest cost estimates lie between<br />
35,000€ <strong>to</strong> 65,000€ which are presented for large scale operations <strong>of</strong> between 20,000 and<br />
100,000 hectares (Interview Partner K). Thus, the size <strong>of</strong> the forest operation plays a very<br />
important role in the cost <strong>of</strong> the process. Furthermore, the data availability is also influential<br />
in the cost <strong>of</strong> a project. A HCV assessment can cost between 6,500€ <strong>to</strong> 10,000€ <strong>with</strong> valid<br />
available data, however these minimum and maximum value rise <strong>to</strong> 20,000€ <strong>to</strong> 25,000€ for<br />
the same size operation <strong>with</strong> no valid data available, since extensive field work will be<br />
required as part <strong>of</strong> the assessment (Interview Partner E).<br />
The average time for an individual HCV assessment is between 1 and 6 months <strong>with</strong> field<br />
work taking between 7 and 13 days (Interview Partner C, D, E, F and K). If the HCV<br />
assessment is part <strong>of</strong> an entire management plan, the process will take 2 <strong>to</strong> 3 years<br />
(Interview Partner E and F).<br />
The HCV process requires a minimum team <strong>of</strong> 3 <strong>to</strong> 4 experts, comprising a soil scientist, a<br />
biologist and a social scientist (Interview Partner G). The assessment is normally performed<br />
<strong>with</strong> a combination <strong>of</strong> international and national experts (Interview Partner D, E, F, G and K),<br />
e<strong>special</strong>ly for high impact operations (Interview Partner D). For low impact operations, the<br />
60 All required resources for the HCV concept are listed in detail in Appendix A7-1.<br />
72
4. RESULTS<br />
assessment could be performed by non-experts <strong>with</strong> validation <strong>of</strong> results by experts<br />
(Interview Partner D).<br />
Overall, the HCV assessment is very efficient <strong>with</strong> regard <strong>to</strong> the financial, human and time<br />
resources required.<br />
4.3.2.2 Key Biodiversity Areas (KBA) Approach<br />
The financial resources 61 required for the KBA identification phase, for about ten<br />
different regions, were approximately 650€/ KBA site identified. Therefore, the cost <strong>of</strong> a<br />
national assessment would be in the order <strong>of</strong> 32,500€, for a country or region containing<br />
around 50 KBA. Unfortunately, this value is difficult <strong>to</strong> place in<strong>to</strong> perspective, since there are<br />
no fixed size limits <strong>to</strong> KBA. They range from very small <strong>to</strong> very large, depending on the<br />
management context and the species distribution <strong>of</strong> a given region (Langhammer et al. 2007,<br />
42; Interview Partner M). Therefore, no minimum or maximum site sizes can be defined.<br />
On average, the time required for a regional or national KBA identification is around 3 years.<br />
This time estimate and the indicated cost requirements do not really match and further data<br />
should be consulted for a more accurate conclusion. Nevertheless, the exact time required<br />
for an assessment will vary depending on the availability and accuracy <strong>of</strong> data. The general<br />
opinion is that this is probably faster than it should be, since the most effective processes<br />
were those involving extensive field surveys prior <strong>to</strong> identification. With the progression from<br />
IBA, IPA and others <strong>to</strong> KBA, these extensive field work components were not incorporated.<br />
KBA identification has instead <strong>of</strong>ten relied solely on literature, museum specimens and<br />
remotely sensed data (Interview Partner M).<br />
This process does not require a large amount <strong>of</strong> human resources <strong>to</strong> complete the<br />
identification phase. A team <strong>of</strong> 3-6 experts is sufficient. The results obtained from these<br />
experts will, however, be validated by a panel <strong>of</strong> experts, usually in the form <strong>of</strong> a workshop.<br />
Thus, a relatively small number <strong>of</strong> pr<strong>of</strong>essionals are involved in organising and managing the<br />
process <strong>with</strong> a much broader community participating in the review (Interview Partner M).<br />
On the whole, the KBA approach is efficient in its financial and human resources<br />
requirements, but, at the same time, is also extremely time consuming.<br />
61 All required resources for the KBA approach are listed in detail in Appendix A7-2.<br />
73
4. RESULTS<br />
4.3.2.3 Ecoregion-Based Conservation (ERBC) Approach<br />
On average the ERBC approach costs between 100,000€ and 217,000€ 62<br />
(Interview Partner I and J). The cost estimate for China was not considered as the maximum<br />
value, as the size <strong>of</strong> the site was not given. <strong>Assessment</strong>s <strong>with</strong>in the United States have<br />
tended <strong>to</strong> be slightly less expensive than in other regions, due <strong>to</strong> the size <strong>of</strong> the assessment,<br />
the required human resources and available data (Interview Partner J). The size normally<br />
assessed during this approach ranges from 400,000 <strong>to</strong> 3.6 million hectares, the largest area<br />
<strong>to</strong> be looked at. It takes approximately one and a half <strong>to</strong> two years <strong>to</strong> complete and requires<br />
many experts, either international or national.<br />
In general, the ERBC approach is extremely resource and fairly time intensive, but it is also<br />
the approach that assesses the largest area.<br />
4.3.2.4 Focal Species Approach (FSA)<br />
Unfortunately, only rough estimates were obtained for the resources required 63 by<br />
the FSA. This approach can be implemented by either university students or experts. If the<br />
approach is being implemented <strong>with</strong>in a university setting, the cost will decrease, however<br />
the time required may increase (Interview Partner O). When performed by a group <strong>of</strong> experts<br />
it takes between 3 <strong>to</strong> 4 months and costs anywhere between 6,500€ and 60,000€ (Interview<br />
Partner O).<br />
Overall, the FSA is efficient in its personel and time requirements, but further data should be<br />
consulted <strong>to</strong> provide more accurate results on the cost <strong>of</strong> an assessment.<br />
4.3.2.5 Rapid Ecological <strong>Assessment</strong> (REA)<br />
The cost <strong>of</strong> an REA was estimated <strong>to</strong> lie between 50,000€ and 170,000€ 64 . It takes<br />
approximately 1 year <strong>to</strong> complete (Sayre et al. 2000, 37) and requires an extensive array <strong>of</strong><br />
experts (Sayre et al. 2000, 36, 79, 93; Interview Partner I). No values <strong>to</strong> maximum and<br />
minimum site sizes were found in the literature. The cost <strong>of</strong> an assessment will increase,<br />
e<strong>special</strong>ly when assessing remote <strong>areas</strong>, large spatial scales or high <strong>to</strong>pographic resolution.<br />
Furthermore, the faster the results are required, the higher the cost will be, for example, due<br />
<strong>to</strong> the requirement <strong>of</strong> large filed teams (CBD 2005, 11).<br />
On the whole, the REA has intensive human resource requirements, but can be completed in<br />
a relatively short time frame.<br />
62 All required resources for the ERBC approach are listed in detail in Appendix A7-3.<br />
63 All required resources for the FSA are listed in detail in Appendix A7-4.<br />
64 All required resources for the REA are listed in detail in Appendix A7-5.<br />
74
4. RESULTS<br />
Due <strong>to</strong> the lack <strong>of</strong> data on the financial resource requirements and the exact size <strong>of</strong> an<br />
assessment area, the <strong>approaches</strong>’ differences in cost were not discussed further. However,<br />
when comparing the remaining two sub-criteria <strong>of</strong> required resources, the HCV concept and<br />
the FSA require the least input. They are followed by the REA, <strong>with</strong> the KBA and ERBC<br />
<strong>approaches</strong> requiring the most input.<br />
An overall ranking <strong>of</strong> the required resources for each individual <strong>approaches</strong> is further<br />
discussed in chapter 4.3.4.<br />
4.3.3 Data Requirements<br />
Each approach has specific data requirements that are needed <strong>to</strong> successfully complete an<br />
assessment. Certain requirements will be the same for the <strong>approaches</strong>, however some<br />
differences do exist. This section provides an overview <strong>of</strong> each approach’s specific data<br />
requirements, showing similarities and differences between the <strong>approaches</strong> for the subcriteria:<br />
use <strong>of</strong> existing data (C22), data acquisition (C23), data validation (C24) and remotely<br />
sensed data (C25) 65 . For the selected <strong>approaches</strong> each sub-criterion is addressed<br />
separately in the following chapters, as can be seen in Figure 19.<br />
Figure 19: Overview <strong>of</strong> sub-criteria for data requirements<br />
4.3.3<br />
Data Requirements<br />
Use <strong>of</strong> Existing<br />
Data<br />
4.3.3.1<br />
Use <strong>of</strong> Remote<br />
Sensing<br />
4.3.3.4<br />
Data Acquisition<br />
4.3.3.2<br />
Data Validation<br />
4.3.3.3<br />
Source: Own design<br />
65 For further detail on the individual approach’s data requirements, please refer <strong>to</strong> Appendix A8.<br />
75
4. RESULTS<br />
4.3.3.1 Use <strong>of</strong> Existing Data<br />
An attempt should always be made <strong>to</strong> <strong>identify</strong> existing data sources, as a thorough<br />
knowledge <strong>of</strong> these enable a more efficient identification <strong>of</strong> further assessment requirements<br />
(Sayre et al. 2000, 81).<br />
Six <strong>areas</strong> <strong>of</strong> existing data sources, as shown in Figure 20, were identified during the course<br />
<strong>of</strong> this thesis. These include: macro-scale databases, micro-scale databases, species<br />
conservation status according <strong>to</strong> the IUCN red list, primary literature and expert<br />
knowledge, remotely sensed data sources and additional data sources which are made<br />
up <strong>of</strong> a wide collection <strong>of</strong> different references.<br />
Figure 20: Overview <strong>of</strong> existing data sources<br />
Macro-scale<br />
databases<br />
HCV<br />
ERBC<br />
REA<br />
Use <strong>of</strong> Existing Data<br />
(C22)<br />
Additional<br />
data sources<br />
HCV<br />
KBA<br />
ERBC<br />
REA<br />
Micro-scale<br />
databases<br />
HCV<br />
KBA<br />
FSA<br />
REA<br />
IUCN red list<br />
HCV<br />
KBA<br />
ERBC<br />
REA<br />
Literature<br />
and experts<br />
all<br />
<strong>approaches</strong><br />
Remotely<br />
sensed data<br />
all<br />
<strong>approaches</strong><br />
Source: Own design<br />
76
4. RESULTS<br />
Remotely sensed data sources are employed by all <strong>approaches</strong> 66 .<br />
The IUCN red list provides the world’s largest data base and therefore, insight on the status<br />
and trends <strong>of</strong> species, focusing on those at greatest risk <strong>of</strong> extinction (Baillie et al. 2004, 2).<br />
Except for the FSA, all <strong>approaches</strong> employ information from this list <strong>to</strong> obtain knowledge on<br />
the conservation status <strong>of</strong> possible species <strong>with</strong>in an area <strong>of</strong> interest (Stewart et al. 2008, 13;<br />
Langhammer et al. 2007, 17; Groves et al. 2000, 3-8; Sayre et al. 2000, 81).<br />
All <strong>approaches</strong> review primary literature sources or make use <strong>of</strong> expert knowledge as<br />
existing data sources (Stewart et al. 2008, 13; Langhammer et al. 2007, 31; Dinerstein et al.<br />
2000, 51; Sayre et al. 2000, 81). Expert consultation should be an important step in<br />
<strong>identify</strong>ing existing data, as much <strong>of</strong> the information required for an assessment will be<br />
buried in the grey literature, in unpublished manuscripts or in the heads <strong>of</strong> experts<br />
(Dinerstein et al. 2000, 50).<br />
Figure 21 provides examples on the remaining three identified <strong>areas</strong> <strong>of</strong> existing data, namely<br />
macro-scale databases, micro-scale databases and additional data sources.<br />
Figure 21: Examples <strong>of</strong> existing data sources<br />
Macro-scale<br />
databases<br />
HCV<br />
ERBC<br />
REA<br />
Micro-scale<br />
databases<br />
HCV<br />
KBA<br />
FSA<br />
REA<br />
Additional<br />
data sources<br />
HCV<br />
KBA<br />
ERBC<br />
REA<br />
For example:<br />
Biodiversity hotspots<br />
Priority ecoregions<br />
Frontier forests<br />
Last <strong>of</strong> the wild<br />
For example:<br />
IBAs, IPAs, KBAs<br />
AZE<br />
National databases<br />
Local databases<br />
For example:<br />
Museum specimens<br />
Traditional knowledge<br />
Management plans<br />
Priority-setting plans<br />
Source: Own design<br />
66 For further clarification on the use <strong>of</strong> remote sensing, please refer <strong>to</strong> chapter 4.3.3.4.<br />
77
4. RESULTS<br />
Macro-scale databases provide coarse filter maps and descriptions <strong>of</strong> regions <strong>with</strong> high<br />
levels <strong>of</strong> biodiversity or conservation significance (Stewart et al. 2008, 14). These databases<br />
include maps produced by <strong>approaches</strong>, such as Biodiversity Hotspots (Meyers et al. 2000),<br />
Priority Ecoregions (Olson and Dinerstein 1998), Last <strong>of</strong> the Wild Habitats (Sanderson et al.<br />
2002) and Frontier Forests (Bryant et al. 1997). The maps and databases provide an<br />
indication <strong>of</strong> likely conservation targets and are employed by the HCV concept (Stewart et al.<br />
2008, 14), the ERBC approach (Dinerstein et al. 2000, 35) and the REA (Sayre et al. 2000,<br />
81), as a source <strong>of</strong> existing data.<br />
In contrast, micro-scale databases provide fine filter maps and descriptions <strong>of</strong> group<br />
specific data provided by <strong>approaches</strong>, such as Important Bird Areas (IBA) (BirdLife<br />
International 2009), Important Plant Areas (IPA) (PlantLife International 2009), Key<br />
Biodiversity Areas (KBA) (Eken et al. 2004; Langhammer et al. 2007) and sites identified by<br />
the Alliance for Zero Extinction (AZE) (Alliance for Zero Extinction 2005), the latter being<br />
extremely important for preventing the extinction <strong>of</strong> critically endangered species (Interview<br />
Partner M). These maps are employed by the HCV concept (Stewart et al. 2008, pg 14), the<br />
KBA approach (Langhammer et al. 2007, 29, 30) and, if available, the REA (Sayre et al.<br />
2000, 81). National or local databases, which have also been placed under the heading <strong>of</strong><br />
micro-scale databases, are employed by the FSA (Brooker 2002, 187).<br />
Additional data sources include information from previously established management<br />
plans, ecoregional assessments, national and regional conservation plans or databases and<br />
priority setting exercises (Stewart et al. 2008, 13; Groves et al. 2000, viii; Sayre et al. 2000,<br />
81). At least one source <strong>of</strong> information from <strong>with</strong>in this very broad category is used by all <strong>of</strong><br />
the <strong>approaches</strong> 67 , except for the FSA, which does not employ any <strong>of</strong> the additional data<br />
sources.<br />
Obtaining valuable information is key <strong>to</strong> <strong>identify</strong>ing conservation targets. Therefore, all<br />
existing data should be collected during the scoping stage, thereby pinpointing data gaps<br />
and judging data quality and reliability. This leads <strong>to</strong> decisions on final team composition,<br />
methods <strong>of</strong> data acquisition (Stewart et al. 2008, 12, 15) and hence time requirements and<br />
cost (Hill et al. 2005, 5).<br />
67 More detailed information is provided in Appendix A8.<br />
78
4. RESULTS<br />
4.3.3.2 Data Acquisition<br />
Data acquisition is extremely important <strong>to</strong> augment and replace missing and<br />
unreliable or outdated data. Existing data and the lack there<strong>of</strong> will pinpoint where, when and<br />
how this should be undertaken (Stewart et al. 2008, 15).<br />
For this thesis, methods <strong>of</strong> data acquisition were divided in<strong>to</strong> three categories: site visits,<br />
expert surveys and stakeholder surveys, as can be seen in Figure 22.<br />
Figure 22: Overview <strong>of</strong> methods employed for data acquisition<br />
Data Acquisition<br />
All <strong>approaches</strong><br />
Site visit<br />
All<br />
<strong>approaches</strong><br />
Expert<br />
surveys<br />
HCV<br />
KBA<br />
ERBC<br />
FSA<br />
Stakeholder<br />
Surveys<br />
HCV<br />
KBA<br />
ERBC<br />
Inven<strong>to</strong>ries<br />
KBA, ERBC, FSA, REA<br />
Rapid assessment<br />
all <strong>approaches</strong><br />
Remote sensing<br />
HCV, ERBC, FSA, REA<br />
Source: Own design<br />
Site visits are essential components <strong>of</strong> data acquisition, as these <strong>identify</strong> or confirm<br />
conservation values and features <strong>of</strong> interest and assess their overall <strong>importance</strong> (Hill et al.<br />
2005, 95).<br />
Targeted surveys <strong>of</strong> experts and stakeholders provide the best information for decision<br />
making <strong>with</strong> limited resources and time (Dinerstein et al. 2000, 63). They provide experience,<br />
knowledge and understanding <strong>of</strong> the biota and threats affecting the integrity <strong>of</strong> an ecoregion<br />
and the persistence <strong>of</strong> important ecological processes, habitats and species assemblages<br />
(Dinerstein et al. 2000, 9). Using stakeholder knowledge and opinion in the assessment,<br />
79
4. RESULTS<br />
imparts ownership and pride in the process, ensuring a certain degree <strong>of</strong> implementation<br />
success (Interview Partner M).<br />
All <strong>approaches</strong> have been designed <strong>to</strong> employ a combination <strong>of</strong> methods <strong>with</strong>in these loose<br />
categories. The exact combination <strong>of</strong> methods employed by any approach will also depend<br />
on the objectives and required outcome <strong>of</strong> the assessment (Hill et al. 2005, 3).<br />
All <strong>approaches</strong> make use <strong>of</strong> site visits <strong>to</strong> obtain information for the identification process. A<br />
rapid assessment is the most wide-spread method employed (Stewart et al. 2008, 24;<br />
Langhammer et al. 2007, 22, 30; Dinerstein et al. 2000, 230; Dinerstein et al. 2001, appendix<br />
A 2; Brooker 2002, 187; Lambeck 1997, 855; Sayre et al. 2000, 84) which, as per definition,<br />
is a fast, efficient and cost efficient <strong>to</strong>ol for obtaining information on biodiversity (Oliver et al.<br />
1993, 562). In contrast, an inven<strong>to</strong>ry is far more time-consuming, requires considerable<br />
organisation and methodological rigour (Sayre et al. 2000, 82), and is therefore, employed by<br />
less methods. These include the KBA approach (Langhammer et al. 2007, 19), ERBC<br />
(Dinerstein et al. 2001, 21), the FSA (Bani et al. 2002, 826; Lambeck 1997, 855) and the<br />
REA (Sayre et al. 2000, 82). The HCV process (Stewart et al. 2008, 25), the ERBC approach<br />
(Dinerstein et al. 2001, 51), the FSA (Bani et al. 2002, 828) and the REA (Sayre et al. 2000,<br />
81) acquire data through remote sensing technology 68 .<br />
The HCV concept, the KBA and ERBC <strong>approaches</strong> employ both expert and stakeholder<br />
surveys as a means <strong>of</strong> acquiring data (Stewart et al. 2008, 17, 18; Langhammer et al. 2007,<br />
31; Dinerstein et al. 2000, 51,151). The KBA approach uses stakeholder surveys <strong>to</strong> refine<br />
the delineation <strong>of</strong> KBA designated sites (Langhammer et al. 2007, 50), whereas the FSA<br />
makes use <strong>of</strong> expert surveys <strong>to</strong> <strong>identify</strong> the focal community, their habitat requirements and<br />
distribution range, as well as <strong>to</strong> estimate viable population sizes (Hess and King 2002, 30).<br />
Overall, all <strong>approaches</strong> employ a varying range <strong>of</strong> <strong>to</strong>ols for data acquisition. However, all<br />
acquired or existing data should always be validated <strong>to</strong> ensure the reliability and overall<br />
confidence in an assessment (CBD 2005, 11).<br />
68 For further detail on the use <strong>of</strong> remote sensing, please refer <strong>to</strong> chapter 4.3.3.4.<br />
80
4. RESULTS<br />
4.3.3.3 Data Validation<br />
Every data set has limitations or biases which need <strong>to</strong> be considered during the<br />
identification stage (Langhammer et al. 2007, 33). For this thesis, three main categories <strong>of</strong><br />
data validation were identified, namely site visits, expert surveys and literature or peer<br />
reviews.<br />
All <strong>approaches</strong> make use <strong>of</strong> a combination <strong>of</strong> different <strong>to</strong>ols for data validation 69 , depending<br />
on the resources and time available, as well as the objective <strong>of</strong> the assessment (Interview<br />
Partner I).<br />
Figure 23 provides an overview <strong>of</strong> all validation <strong>to</strong>ols that are employed by the <strong>approaches</strong>.<br />
Figure 23: Overview <strong>of</strong> validation <strong>to</strong>ols<br />
Data validation<br />
All <strong>approaches</strong><br />
Site visit<br />
All<br />
<strong>approaches</strong><br />
Rapid assessment<br />
HCV, KBA,<br />
ERBC, REA<br />
Ground truthing<br />
HCV, KBA, ERBC,<br />
FSA, REA,<br />
Expert<br />
surveys<br />
HCV<br />
KBA<br />
FSA<br />
Literature/<br />
reviews<br />
HCV<br />
KBA<br />
ERBC<br />
REA<br />
Museum collections <strong>of</strong><br />
species<br />
KBA<br />
Peer reviewing<br />
HCV, KBA,<br />
ERBC, REA<br />
Source: Own design<br />
69 Please refer <strong>to</strong> Appendix A8, for more detail on the individual <strong>approaches</strong>‘ validation methodology<br />
81
4. RESULTS<br />
All <strong>approaches</strong> make use <strong>of</strong> site visits for data validation. Rapid assessments or ground<br />
truthing <strong>of</strong> maps are employed by all <strong>of</strong> the <strong>approaches</strong>. The KBA approach uses site visits,<br />
museum records and expert surveys <strong>to</strong> increase the reliability <strong>of</strong> data, such as species<br />
occurrence or point locality data. It also foresees the validation <strong>of</strong> existing micro-scale<br />
databases, such as IBA, IPA and the AZE (Langhammer et al. 2007, 34, 35). The HCV<br />
concept verifies maps or databases <strong>of</strong> endangered or threatened conservation targets<br />
through ground truthing (Stewart et al. 2008, 25, 26) and rapid assessments (Stewart et al.<br />
2008, 25, 26; Stewart 2009, 7). Therefore, the uncertainty <strong>of</strong> uneven or poor quality data is<br />
reduced (Stewart et al. 2008, 20). The ERBC approach and the REA confirms its remotely<br />
sensed data through ground truthing (Dinerstein et al. 2000, 151; Sayre et al. 2000, 81).<br />
The FSA has used expert surveys <strong>to</strong> confirm candidate focal species and habitat<br />
requirements (Hess and King 2002, 30).<br />
Peer reviewing enhances the value and effectiveness <strong>of</strong> an assessment report (Sayre et al.<br />
2000, 139) and is included in the HCV concept (HCV Resource Network 2005-07), the KBA<br />
approach (Interview Partner M), the ERBC approach (Dinerstein et al. 2000, 231) and REA<br />
(Sayre et al. 2000, 139). In addition, it is vital that all results <strong>of</strong> a REA include an overall<br />
estimation on confidence (CBD 2006, 12), endowing validity on<strong>to</strong> the assessment. The same<br />
has been suggested for species occurrence data under the KBA approach (Langhammer et<br />
al. 2007, 35). This approach alone requires, where possible, that identified species be traced<br />
<strong>to</strong> sources in museum collections or herbariums (Langhammer et al. 2007, 32) and that the<br />
presence <strong>of</strong> a species be confirmed prior <strong>to</strong> a site being considered for KBA status<br />
(Langhammer et al. 2007, 35). In practice, however, data validation has not been this<br />
rigorous, as identification has <strong>of</strong>ten purely been based on literature, museum specimens and<br />
remote sensing (Interview Partner M).<br />
In general, all <strong>approaches</strong> validate existing and acquired data <strong>to</strong> increase the reliability <strong>of</strong> the<br />
assessment. Amongst the three validation <strong>to</strong>ols looked at during this thesis, site visits are<br />
most commonly implemented by the <strong>approaches</strong>.<br />
82
4. RESULTS<br />
4.3.3.4 Use <strong>of</strong> Remote Sensing<br />
Advancement in remote sensing technology has increased the resolution and<br />
quality <strong>of</strong> landscape data tremendously over the past years and the cost <strong>of</strong> obtaining such<br />
data is continuously decreasing (Turner et al. 2003, 306, 312). Although the incorporation <strong>of</strong><br />
remote sensing in conservation work always requires technical expertise and needs <strong>to</strong> be<br />
validated through ground truthing (Turner et al. 2003, 312; Interview Partner J), it may lead <strong>to</strong><br />
a decrease in overall assessment costs and required time (Langhammer et al. 2007, 10) <strong>with</strong><br />
a consequence <strong>of</strong> ultimately aiding the overall efficiency <strong>of</strong> the approach.<br />
All <strong>approaches</strong> implement remote sensing technology; however, the exact uses differ<br />
between <strong>approaches</strong>, as is shown in Figure 24.<br />
Figure 24: Overview <strong>of</strong> employed remote sensing technology<br />
Remote sensing<br />
Aerial pho<strong>to</strong>graphy &<br />
satellite imagery<br />
All <strong>approaches</strong><br />
General<br />
overview<br />
HCV<br />
REA<br />
Delineation<br />
HCV<br />
ERBC<br />
FSA<br />
Data<br />
acquisition<br />
HCV<br />
KBA<br />
ERBC<br />
Initial landscape<br />
characterisation<br />
REA<br />
Broad framework for<br />
site-scale decisions<br />
HCV<br />
Source: Own design<br />
Macro-scale mapping<br />
HCV<br />
Micro-scale mapping<br />
ERBC, FSA<br />
<strong>Assessment</strong> <strong>of</strong><br />
current condition<br />
HCV, ERBC<br />
<strong>Assessment</strong> <strong>of</strong> threats<br />
ERBC<br />
Moni<strong>to</strong>ring<br />
KBA, ERBC<br />
83
4. RESULTS<br />
The HCV concept and REA apply the technology <strong>to</strong> obtain a general overview at a macroscale.<br />
The HCV concept establishes a broad framework for site scale decisions which<br />
enables the establishment <strong>of</strong> appropriate limits <strong>to</strong> the landscape level assessment at a<br />
coarse scale (Stewart 2009, pg 7, Stewart and Rayden 2009, 8). The REA performs an initial<br />
landscape characterisation based on remotely sensed data (Sayre et al. 2000, 68, 81; CBD<br />
2006, 11).<br />
In contrast, the KBA approach, the ERBC approach and the FSA use remotely sensed<br />
information for delineation <strong>of</strong> sites at a micro-scale. KBA sites are themselves <strong>of</strong>ten<br />
identified purely on literature, museum specimens and remote sensing (Interview Partner M).<br />
Whereas the FSA relies on remote sensing <strong>to</strong> delineate remnant patches <strong>with</strong>in the study<br />
area (Lambeck 1997, 854; Bani et al. 2002, 828) and the ERBC approach requires this<br />
information for the precise delineation <strong>of</strong> ecoregion and sub-region boundaries (Dinerstein et<br />
al. 2000, 75).<br />
Three <strong>of</strong> the assessed <strong>approaches</strong>, namely the HCV concept, the KBA approach and the<br />
ERBC approach, use remote sensing technology for data acquisition. The ERBC approach<br />
uses this source <strong>of</strong> data most extensively, e<strong>special</strong>ly for moni<strong>to</strong>ring <strong>of</strong> habitat quality, notably<br />
in inaccessible forest regions (Dinerstein et al. 2001, 51) and <strong>to</strong> assess the current condition<br />
<strong>of</strong> <strong>areas</strong> <strong>of</strong> interest (Dinerstein et al. 2001, 86). The HCV concept uses remote sensing for<br />
acquiring data on current conditions <strong>of</strong> significant landscape level regions (HCV2) (Stewart et<br />
al. 2008, 25), whereas the KBA approach employs this technology as a cost effective and<br />
relatively rapid moni<strong>to</strong>ring <strong>to</strong>ol, <strong>to</strong> determine the status <strong>of</strong> biodiversity at a broad scale<br />
(Langhammer et al. 2007, 83; Interview Partner M).<br />
With the continuously decreasing cost and increasing spectral and spatial resolution (Turner<br />
et al. 2003, 306, 313), the use <strong>of</strong> remote sensing, as a data source, is becoming more widespread.<br />
Furthermore, the advances in this technology, providing direct and indirect measures<br />
<strong>of</strong> biodiversity, have also lead <strong>to</strong> a wide divergence in its application (Turner et al. 2003,<br />
306). These facts are reflected in the results obtained during this thesis which show a widespread,<br />
yet different use in the implementation <strong>of</strong> remote sensing.<br />
All <strong>approaches</strong> are able <strong>to</strong> employ a variety <strong>of</strong> different sources <strong>to</strong> fulfill their data<br />
requirements and are also more or less flexible in their exact choice <strong>of</strong> <strong>to</strong>ols <strong>to</strong> make use <strong>of</strong><br />
existing data, acquire and validate data sets and <strong>to</strong> incorporate remote sensing technology in<br />
their assessment. The HCV concept utilizes the widest range <strong>of</strong> different data sources. This<br />
is followed by the KBA and ERBC <strong>approaches</strong> and the REA. In contrast, the FSA employs<br />
the least amount <strong>of</strong> data sources looked at during this thesis.<br />
84
4. RESULTS<br />
4.3.4 Interim Summary III<br />
For Group III (Input) criteria, the <strong>approaches</strong> were evaluated based on a ranking system<br />
which was established individually for each criterion. Criteria G (methods for site choice)<br />
and I (data requirements) were dealt <strong>with</strong> as a whole, whereas the sub-criteria for criterion<br />
H (required resources) were ranked separately 70 .<br />
This chapter provides an overview <strong>of</strong> the results obtained for the additional criteria, thus<br />
providing transparency <strong>to</strong> the ranking <strong>of</strong> the <strong>approaches</strong>. Any deviations from the original<br />
ranking system, as established in chapter 2.2.7, are explained in this chapter.<br />
Criterion G: Methods for Site Choice<br />
Table 11 shows an overview <strong>of</strong> the methods that can be employed by the various<br />
<strong>approaches</strong> for site choice. Not all methods are employed simultaneously by the <strong>approaches</strong><br />
during site identification, but this overview rather provides an indication <strong>of</strong> an approach’s<br />
flexibility in terms <strong>of</strong> the available methods it may implement. Furthermore, differences or<br />
precise implementation rigour <strong>of</strong> methods by different practitioners is not considered. The<br />
exact methodology will change <strong>with</strong> varying objectives and <strong>with</strong> the available resources at<br />
hand (Interview Partner L). Thus, in general, the more methods at an approach’s disposal,<br />
the more flexible and versatile the approach is.<br />
70 The ranking methodology and classes are described in chapter 2.2.7, Additional Criteria.<br />
85
4. RESULTS<br />
Table 11: Approach ranking according <strong>to</strong> their methods for site choice<br />
Group III<br />
Input<br />
Criteria G<br />
Methods for<br />
Site Choice<br />
Subcriteria<br />
Site visits<br />
(C16)<br />
Surveys<br />
(C17)<br />
Additional<br />
methods<br />
(C18)<br />
HCV KBA ERBC FSA REA<br />
Inven<strong>to</strong>ries – X – – X<br />
Rapid assessments X X X X X<br />
Indica<strong>to</strong>r species X – X X X<br />
Ground truthing X – X X X<br />
Field surveys X X X X X<br />
Expert surveys – – X X –<br />
Stakeholder surveys X – X – X<br />
Remote sensing X X X X X<br />
Existing data X X X X X<br />
Models – – X – –<br />
Environmental indica<strong>to</strong>rs – – X – –<br />
Total 11 7 5 10 7 8<br />
Rank 2 3 1 3 2<br />
Key: X = employed – = not employed<br />
Rank: 1 = 9-11 methods that may be applied<br />
2 = 6-8 methods that may be applied<br />
3 = 2-5 methods that may be applied<br />
Source: Own design<br />
The ERBC approach was placed first, as it is able <strong>to</strong> make use <strong>of</strong> all identified methods,<br />
except for inven<strong>to</strong>ries. The REA is able <strong>to</strong> employ 8 different methods for site choice, relying<br />
less on models and environmental indica<strong>to</strong>rs. Since this assessment is predominantly<br />
performed in <strong>areas</strong> <strong>with</strong> little or no information (Sayre et al. 2000, 33, 81), models and<br />
environmental indica<strong>to</strong>rs would be less suitable (Interview Partner J). The FSA and the HCV<br />
concept can both apply 7 different methods. These <strong>approaches</strong> do not make use <strong>of</strong> detailed<br />
inven<strong>to</strong>ries, models and environmental indica<strong>to</strong>rs. The first being resource and time intensive<br />
(CBD 2005, 6) and the latter two requiring additional testing and validation via ground<br />
truthing (Interview Partner J), since they momentarily still present certain weaknesses<br />
(Langhammer et al. 2007, 10). Even though the FSA can apply the same number <strong>of</strong> methods<br />
as the HCV concept and the REA, it was only ranked third. Firstly, this taxon-based<br />
surrogate scheme assumes that conservation actions for one specific taxon will result in the<br />
successful conservation <strong>of</strong> other taxa (Noss et al. 1997, 118; Lindenmeyer et al. 2002, 338;<br />
86
4. RESULTS<br />
Lindenmeyer and Fischer 2003, 150). Secondly, the identification <strong>of</strong> the focal species and<br />
their threats has caused difficulties (Lindenmeyer et al. 2002, 340). Hence, these two main<br />
criticisms 71 have prompted the approach <strong>to</strong> be ranked third, <strong>to</strong>gether <strong>with</strong> the KBA approach.<br />
The KBA approach has only 5 methods at its disposal and was, therefore, placed third. It<br />
relies very heavily on existing data and remote sensing <strong>with</strong> site visits only being included<br />
funding permitted (Interview Partner M). Furthermore, the KBA approach does not<br />
incorporate stakeholder opinion or knowledge (eg. through surveys) for site identification<br />
which is known <strong>to</strong> pose problems for implementation success (Interview Partner M) 72.<br />
Criterion H: Required Resources<br />
One <strong>of</strong> the most important criteria for comparing the <strong>approaches</strong> is criterion H<br />
(required resources). Cost, personnel and time are key components for determining the<br />
exact procedure <strong>of</strong> all <strong>approaches</strong>.<br />
The sub-criterion, financial resources 73 , was not discussed here, since these estimates are<br />
all fairly similar, e<strong>special</strong>ly when taking the size <strong>of</strong> the site in<strong>to</strong> consideration. For an accurate<br />
assessment here<strong>of</strong>, more data on the cost and size <strong>of</strong> a project would be required.<br />
Table 12 provides a coarse ranking <strong>of</strong> the sub-criteria: human resources and required time.<br />
Table 12: Approach ranking according <strong>to</strong> their required resources<br />
Group III<br />
Input<br />
Sub-criteria HCV KBA ERBC FSA REA<br />
human resources<br />
(C20)<br />
moderate moderate highest moderate highest<br />
Criterion H<br />
Rank 2 2 3 2 3<br />
Required<br />
resources<br />
Required time<br />
(C21)<br />
1-6<br />
months<br />
3<br />
years<br />
1.5-2<br />
years<br />
3-4<br />
months<br />
12<br />
months<br />
Rank 1 3 2 1 1<br />
C20 rank: 1 = least human resource requirements<br />
2 = moderate human resource requirements<br />
3 = highest human resource requirements<br />
C21 rank: 1 = 1-12 months<br />
2 = 1-2,5 years<br />
3 = ≥ 3 years<br />
Source: Own design<br />
71 Please refer <strong>to</strong> Methods for Site Choice, chapter 4.3.1.4, and Appendix A6-4 for a more detailed<br />
explanation.<br />
72 Please refer <strong>to</strong> Methods for Site Choice, chapter 4.3.1.2 and Appendix A6-2 for more information.<br />
73 An overview <strong>of</strong> the financial data obtained for the individual <strong>approaches</strong> can be seen in chapter<br />
4.3.2 and Appendix 7.<br />
87
4. RESULTS<br />
The HCV concept, the KBA approach and the FSA are all fairly similar in their human<br />
resource requirements and have, thus, all been ranked second. In contrast, the ERBC<br />
approach and the REA are far more intensive in their personnel needs which has placed<br />
them third.<br />
The average time needed <strong>to</strong> complete an assessment lies under or around one year for the<br />
HCV concept, the FSA and the REA. They have, therefore, all been placed first. The ERBC<br />
approach takes between 1.5 and 2 years, whereas the KBA approach requires at least 3<br />
years for completion. Hence, the ERBC approach was ranked second and the KBA approach<br />
third.<br />
Criterion I: Data Requirements<br />
Table 13 (see next page) shows an overview <strong>of</strong> the <strong>approaches</strong>’ data sources. Not all<br />
data sources are utilized for each assessment, but instead this list shows the flexibility and<br />
versatility in the <strong>approaches</strong>’ ability <strong>to</strong> use different information sources. The more data<br />
sources that can be implemented, the stronger the approach was ranked 74 .<br />
74 Please refer <strong>to</strong> Appendix A1, Key Question I, for further information.<br />
88
4. RESULTS<br />
Table 13: Approach ranking according <strong>to</strong> their data sources<br />
Group III Subcriteria<br />
HCV KBA ERBC FSA REA<br />
Input<br />
Criterion I<br />
Data<br />
requirements<br />
Existing<br />
data (C22)<br />
Data<br />
acquisition<br />
(C23)<br />
Macro-scale<br />
databases<br />
Micro-scale<br />
databases<br />
X – X – X<br />
X X – X X<br />
Red list X X X – X<br />
Literature and<br />
experts<br />
Remotely sensed<br />
data<br />
Additional data<br />
sources<br />
X X X X X<br />
X X X X X<br />
X X X – X<br />
Site visits X X X X X<br />
Expert surveys X X X X –<br />
Stakeholder<br />
surveys<br />
X X X – –<br />
Data<br />
validation<br />
(C24)<br />
Remote<br />
sensing<br />
(C25)<br />
Site visits X X X X X<br />
Expert surveys X X – X –<br />
Literature/ reviews X X X – X<br />
General overview X – – – X<br />
Delineation X – – X –<br />
Data acquisition X X X – –<br />
Total 15 15 12 11 8 10<br />
Ranking 1 2 2 3 2<br />
Key: X = employed – = not employed<br />
Rank: 1 = 13-15; 2 = 10-12; 3 = 7-9 different data sources<br />
Source: Own design<br />
The HCV concept can make use <strong>of</strong> all identified sources <strong>of</strong> data for all four sub-criteria and<br />
was, therefore, placed first. The KBA approach, the ERBC approach and the REA were all<br />
ranked second, whereas the FSA was placed third. Even though the REA does not make<br />
use <strong>of</strong> stakeholder surveys as a form <strong>of</strong> data acquisition, it does incorporate a source <strong>of</strong><br />
traditional knowledge in the planning stages <strong>of</strong> the assessment (CBD 2005, iii; Sayre et al.<br />
2000, 13).<br />
89
4. RESULTS<br />
4.4 Summary<br />
In order <strong>to</strong> determine the overall efficiency <strong>of</strong> the <strong>approaches</strong>, all groups and their respective<br />
key questions, criteria and sub-criteria needed <strong>to</strong> be assessed so that a comparison <strong>of</strong> the<br />
<strong>approaches</strong> could be made. As per definition, efficiency 75 is output relative <strong>to</strong> input. Even<br />
though this thesis was unable <strong>to</strong> obtain any information on output (Group V. Effectiveness),<br />
it has still assessed: Groups I. (Environmental), II. (Implementation), III. (Input) and IV.<br />
(Supplementary), providing a detailed comparison <strong>of</strong> the different <strong>approaches</strong>.<br />
Table 14 provides an overview <strong>of</strong> the results obtained for the criteria assessed during the<br />
strength-weakness analysis.<br />
Table 14: Overview <strong>of</strong> classification <strong>of</strong> criteria for strength-weakness analysis<br />
Group Criteria HCV KBA ERBC FSA REA<br />
I.<br />
Ecology<br />
II.<br />
Implementation<br />
IV.<br />
Supplementary<br />
Source: Own design<br />
A. Addressed<br />
biodiversity levels<br />
B. Addressed<br />
ecosystem types<br />
C. Geographic<br />
scale <strong>of</strong><br />
applicability<br />
D. Level <strong>of</strong><br />
Approach<br />
E. Implementation<br />
Style<br />
F. Suitability <strong>of</strong><br />
intended users<br />
J. Scoping<br />
assessment<br />
K. Consideration <strong>of</strong><br />
threats<br />
L. Moni<strong>to</strong>ring<br />
recommendations<br />
M. Management<br />
recommendations<br />
Very<br />
strong<br />
(++)<br />
Weak<br />
(-)<br />
Strong<br />
(+)<br />
Strong<br />
(+)<br />
Very<br />
strong<br />
(++)<br />
Very<br />
strong<br />
(++)<br />
Very<br />
strong<br />
(++)<br />
Very<br />
strong<br />
(++)<br />
Very<br />
strong<br />
(++)<br />
Very<br />
strong<br />
(++)<br />
Average<br />
(0)<br />
Strong<br />
(+)<br />
Average<br />
(0)<br />
Strong<br />
(+)<br />
Average<br />
(0)<br />
Strong<br />
(+)<br />
Weak<br />
(-)<br />
Very<br />
strong<br />
(++)<br />
Very<br />
strong<br />
(++)<br />
Very<br />
strong<br />
(++)<br />
Very<br />
strong<br />
(++)<br />
Very<br />
strong<br />
(++)<br />
Very<br />
strong<br />
(++)<br />
Strong<br />
(+)<br />
Very<br />
strong<br />
(++)<br />
Very<br />
strong<br />
(++)<br />
Very<br />
strong<br />
(++)<br />
Very<br />
strong<br />
(++)<br />
Very<br />
strong<br />
(++)<br />
Very<br />
strong<br />
(++)<br />
Weak<br />
(-)<br />
Average<br />
(0)<br />
Strong<br />
(+)<br />
Very<br />
strong<br />
(++)<br />
Very<br />
strong<br />
(++)<br />
Weak<br />
(-)<br />
Average<br />
(0)<br />
Very<br />
strong<br />
(++)<br />
Very<br />
strong<br />
(++)<br />
Very<br />
strong<br />
(++)<br />
Strong<br />
(+)<br />
Very<br />
strong<br />
(++)<br />
Very<br />
strong<br />
(++)<br />
Very<br />
strong<br />
(++)<br />
Very<br />
strong<br />
(++)<br />
Very<br />
strong<br />
(++)<br />
Very<br />
strong<br />
(++)<br />
Very<br />
strong<br />
(++)<br />
Very<br />
strong<br />
(++)<br />
Very<br />
strong<br />
(++)<br />
75 Please refer <strong>to</strong> chapter 7, General Terms, for a definition here<strong>of</strong>.<br />
90
4. RESULTS<br />
As seen in Figure 25 (see next page), Group I (Ecology) and II (Implementation) resulted in<br />
a higher variation in results for their respective criteria than Group IV (Supplementary). This<br />
group produced negligible differences <strong>with</strong> only criterion J (scoping assessment) receiving a<br />
weak and average classification for the KBA approach and the FSA, respectively. The<br />
remaining criteria in Group IV were all classified as very strong, hence producing few marked<br />
distinctions between the <strong>approaches</strong>. Group I and Group II, on the other hand, showed<br />
noticeable differences which enabled a clear division <strong>of</strong> the <strong>approaches</strong>.<br />
An overall classification for each group assessed during the strength-weakness analysis was<br />
not obtained, as this would have implied that all key questions are weighted equally in the<br />
final result.<br />
Figure 25 provides an overview <strong>of</strong> the results obtained for the strength-weakness pr<strong>of</strong>iles,<br />
clearly showing differences and similarities between the assessed <strong>approaches</strong>. These<br />
differences undoubtedly show that the ERBC approach and the REA are the most successful<br />
and comprehensive, in terms <strong>of</strong> the assessed criteria. They are followed closely by the HCV<br />
concept, then the KBA approach and the FSA.<br />
91
4. RESULTS<br />
Figure 25: Overview <strong>of</strong> results: strength-weakness pr<strong>of</strong>iles<br />
IV. M.<br />
Management<br />
recommendations<br />
IV. L. Moni<strong>to</strong>ring<br />
recommendations<br />
I. A. Addressed<br />
biodiversity levels<br />
++<br />
+<br />
0<br />
-<br />
--<br />
I. B. Addressed<br />
ecosystem types<br />
II. C. Geographic<br />
scale <strong>of</strong><br />
applicability<br />
IV. K.<br />
Consideration <strong>of</strong><br />
threats<br />
IV. J. Scoping<br />
assessment<br />
II. F. Suitability for<br />
intended users<br />
II. D. Level <strong>of</strong><br />
approach<br />
II. E.<br />
Implementation<br />
style<br />
HCV<br />
KBA<br />
ERBC<br />
FSA<br />
REA<br />
Axis labelling: ++ = very strong; + = strong; 0 = average<br />
- = weak; -- = very weak<br />
Source: Own design<br />
Figure 26: Overview <strong>of</strong> results: additional criteria<br />
III. G. Methods for site<br />
choice<br />
1<br />
2<br />
III. I. Data<br />
requirements<br />
3<br />
III. H. Human<br />
resources<br />
HCV<br />
KBA<br />
ERBC<br />
FSA<br />
REA<br />
III. H. Required time<br />
Axis labelling: 1 = first place; 2= second place; 3 = third place<br />
Source: Own design<br />
92
4. RESULTS<br />
As seen in Figure 26, the criteria and sub-criteria in Group III (Input) resulted in a clear<br />
ranking <strong>of</strong> the <strong>approaches</strong>. Overall, the HCV concept received the highest ranking. This was<br />
followed by the ERBC approach and the REA. The FSA and the KBA approach received the<br />
lowest ranking.<br />
Table 15 provides an overview <strong>of</strong> the ranked criteria and sub-criteria.<br />
Table 15: Ranking overview for Group III criteria and sub-criteria<br />
Criteria Sub-criteria HCV KBA ERBC FSA REA<br />
Criterion G<br />
Methods for site choice<br />
Criterion H<br />
Required resources<br />
Criterion H<br />
Required resources<br />
Criterion I<br />
Data requirements<br />
All sub-criteria<br />
(C16-C19)<br />
Human resources<br />
(C20)<br />
Time requirements<br />
(C21)<br />
All sub-criteria<br />
(C22-C25)<br />
Key: 1= first place; 2=second place; 3= third place;<br />
Source: Own design<br />
2 3 1 3 2<br />
2 2 3 2 3<br />
1 3 2 1 1<br />
1 2 2 3 2<br />
Group III (Input) plays a fundamental role in providing a thorough overview <strong>of</strong> the<br />
<strong>approaches</strong> and for the future analysis <strong>of</strong> the overall efficiency (input vs output).<br />
Furthermore, the analysis <strong>of</strong> input, e<strong>special</strong>ly the criteria: cost, time, personnel and data, is<br />
the beginning <strong>of</strong> establishing the cost-benefit ratio <strong>of</strong> a given approach. Establishing this<br />
shall provide a significant contribution <strong>to</strong> ultimately increase the success <strong>of</strong> a conservation<br />
activity (Interview Partner J).<br />
93
5. DISCUSSION<br />
5. Discussion<br />
This thesis attempted <strong>to</strong> provide a deeper understanding <strong>of</strong> a range <strong>of</strong> local and regional<br />
conservation <strong>approaches</strong> compared <strong>to</strong> the High Conservation Value (HCV) concept. The<br />
Key Biodiversity Areas (KBA) approach, the Ecoregion-Based Conservation (ERBC)<br />
approach, the Focal Species Approach (FSA) and the Rapid Ecological <strong>Assessment</strong> (REA)<br />
were selected due <strong>to</strong> their global application and the amount <strong>of</strong> available case studies.<br />
Furthermore, it was envisaged that the sample should collectively cover the full range <strong>of</strong><br />
conservation targets <strong>with</strong> a sample size allowing for extensive conclusions <strong>to</strong> be drawn.<br />
Together <strong>with</strong> the HCV concept, the selected <strong>approaches</strong> may all be used for the<br />
identification <strong>of</strong> <strong>areas</strong> important for biodiversity conservation.<br />
Literature research and interviews <strong>with</strong> experts provided sufficient information on the<br />
<strong>approaches</strong>. Firstly, the criteria employed for site identification were identified and analysed.<br />
Secondly, a strength-weakness analysis was performed and thirdly, a comparison <strong>of</strong> the<br />
<strong>approaches</strong>’ input requirements was made. The latter two assessments were based on a set<br />
<strong>of</strong> predetermined key questions and criteria which were formulated through argumentative<br />
reasoning 76 . For each approach, a differentiation according <strong>to</strong> the approach criteria, a<br />
strength-weakness pr<strong>of</strong>ile and an ordinal ranking for input criteria were established.<br />
The thesis succeeded in accomplishing the task <strong>to</strong> pr<strong>of</strong>oundly compare and analyse different<br />
<strong>approaches</strong> <strong>to</strong> <strong>identify</strong> <strong>areas</strong> important for biodiversity conservation and judging them based<br />
on an elaborated set <strong>of</strong> criteria.<br />
However, it has <strong>to</strong> be clearly stated that a different reasoning and different criteria may have<br />
led <strong>to</strong> results which vary from the ones presented in this thesis. Additionally, more<br />
substantial data, taking in<strong>to</strong> account further case studies and a broader range <strong>of</strong> interview<br />
partners, may have resulted in pr<strong>of</strong>iles <strong>with</strong> a different character and a clearer ranking <strong>of</strong> the<br />
<strong>approaches</strong>.<br />
In particular, the ranking <strong>of</strong> the <strong>approaches</strong> for Group III (Input) was not qualitative, and thus,<br />
no great weight should be given <strong>to</strong> this ranking system. Due <strong>to</strong> a lack <strong>of</strong> data, a ranking <strong>of</strong><br />
the <strong>approaches</strong> based on their required costs was not performed.<br />
76 For the exact definitions, please refer <strong>to</strong> Appendix A1.<br />
94
5. DISCUSSION<br />
To date no information on Group V (Effectiveness) exists, preventing any form <strong>of</strong><br />
assessment on the approach efficiency being determined 77 . Future research in this direction<br />
would provide deeper understanding <strong>of</strong> the <strong>approaches</strong>, since data on an approach’s<br />
effectiveness is the beginning <strong>of</strong> establishing a cost:benefit ratio. A more varied pool <strong>of</strong><br />
interview partners, e<strong>special</strong>ly including the private sec<strong>to</strong>r may aid in assessing this. Any<br />
information on effectiveness could be useful for improving fundraising activities and<br />
convincing decision makers <strong>to</strong> implement the results obtained during the identification phase.<br />
Since the rationale behind the HCV concept is <strong>to</strong> find management orientated solutions, <strong>to</strong><br />
sustainably manage production landscapes, <strong>with</strong> the focus on maintaining and enhancing<br />
biodiversity and social values <strong>of</strong> outstanding significance or critical <strong>importance</strong> (HCV<br />
Resource Network 2005-07), it addresses both biological and social needs. Due <strong>to</strong> the<br />
inclusion <strong>of</strong> human needs, the approach’s implementation success is increased, making it<br />
extremely popular <strong>with</strong> both the private and public sec<strong>to</strong>r (Interview Partner A and C). It was<br />
originally developed for forest ecosystems in the context <strong>of</strong> forest certification (HCV<br />
Resource Network 2005-07). This conception and design is clearly reflected in the approach<br />
criteria it employs for site identification and also in the obtained strength-weakness pr<strong>of</strong>ile.<br />
The HCV concept is the most extensive in terms <strong>of</strong> the broad range <strong>of</strong> biological and social<br />
approach criteria it employs for site identification. Since it makes use <strong>of</strong> species, ecosystem<br />
and site specific criteria, it is able <strong>to</strong> establish an accurate picture <strong>of</strong> any area under<br />
consideration (Pressey 2004, 1677).<br />
For the strength-weakness analysis, the majority <strong>of</strong> key questions and criteria were classified<br />
as very strong, indicating a solid foundation underpinning the approach’s design and<br />
methodology. However, certain criteria were assigned a lower classification, due <strong>to</strong> specific<br />
aspects that are embedded in the approach’s philosophy. Firstly, aquatic ecosystems are not<br />
yet addressed by this approach and its focus so far, has predominantly been on forest<br />
ecosystems (Jennings et al. 2003, 1; Lindhe 2005-07, 1). Secondly, any regional<br />
assessment (eg. for conservation planning purposes) will result in small islands <strong>of</strong> protected<br />
<strong>areas</strong> surrounded by large <strong>areas</strong> <strong>of</strong> development (Colchester 2005-07, 2). Therefore, from a<br />
biodiversity conservation point <strong>of</strong> view, alternative <strong>approaches</strong>, for instance the ERBC<br />
approach, would be better suited in this context. Thirdly, the HCV concept attempts <strong>to</strong><br />
<strong>identify</strong> the smallest possible area required <strong>to</strong> save the last threatened area or species<br />
77 Please refer <strong>to</strong> chapter 7, General Terms.<br />
95
5. DISCUSSION<br />
(Interview Partner E). Hence, when designing or expanding any protected area network,<br />
other methods, such as the KBA approach, would be more appropriate.<br />
A positive result was obtained for the ranking <strong>of</strong> the approach’s input criteria. The HCV<br />
concept employs an extensive range <strong>of</strong> different methods and data sources for site choice,<br />
as well as requiring moderate human resources and a short time-frame <strong>to</strong> complete an<br />
assessment.<br />
The overall outcome is reflected in the fact that the HCV concept works well as an effective<br />
umbrella that is flexible and versatile <strong>to</strong> encompass many different types <strong>of</strong> assessment,<br />
mapping and moni<strong>to</strong>ring methods (Interview Partner K). It is extremely extensive for the<br />
approach criteria it employs. It received the second strongest strength-weakness pr<strong>of</strong>ile and<br />
the best ranking for its input requirements. This result not only reinforces, but also<br />
substantiates, the concept’s popularity <strong>with</strong> international organisations and the private<br />
sec<strong>to</strong>r. This wide-spread acceptance should, however, be viewed <strong>with</strong> caution in a public<br />
sec<strong>to</strong>r setting.<br />
The philosophy behind the KBA approach is aimed at providing an umbrella across several<br />
other single taxon based <strong>approaches</strong>, such as Important Bird Areas (IBA), Important Plant<br />
Areas (IPA) etc., <strong>to</strong> form a common framework (Interview Partner M), thus targeting all<br />
known biodiversity which would benefit from site scale conservation. It is essentially a data<br />
driven process, predominantly building on existing information, <strong>to</strong> expand the global<br />
protected area network (Langhammer et al. 2007, xiv).<br />
Since this approach is based on multiple taxa, it is not surprising that it relies purely on<br />
species specific criteria and neither on ecosystem nor site specific criteria for the<br />
identification <strong>of</strong> sites. Even though species specific criteria are the more manageable and<br />
comprehensible components <strong>of</strong> biodiversity and they hold more appeal <strong>with</strong> the general<br />
public (Mace et al. 2006, 18), solely relying on these does not allow for a complete picture <strong>to</strong><br />
be produced (Pressey 2004, 1677). Therefore, taken on its own, this approach is fairly<br />
limited in terms <strong>of</strong> the criteria it uses for site identification.<br />
The process <strong>of</strong> relying purely on data driven, globally set criteria and thresholds ensures a<br />
repeatable application, throughout time and amongst different practitioners (Langhammer et<br />
al. 2007, 15). In terms <strong>of</strong> the strength-weakness analysis, this fact led <strong>to</strong> a lower<br />
classification <strong>of</strong> certain criteria. These strictly data driven, globally set criteria and thresholds<br />
lack resolution at finer scales which has led <strong>to</strong> commission and omission errors (Knight et al.<br />
2007, 258), as well as causing problems in prioritising KBA (Interview Partner G). Though<br />
stakeholder participation is supposedly one <strong>of</strong> the strengths <strong>of</strong> the KBA approach (Interview<br />
Partner M), evidence suggests that inclusion <strong>of</strong> stakeholders is encouraged purely for the<br />
96
5. DISCUSSION<br />
refinement <strong>of</strong> boundaries (Langhammer et al. 2007, 48, 50; Knight et al. 2007, 258) and not<br />
for data acquisition or KBA site identification. Therefore, again leading <strong>to</strong> commission and<br />
omission errors and decreasing the approach’s implementation success (Knight et al. 2007,<br />
258; Interview Partner M).<br />
Although the approach has a wide variety <strong>of</strong> data sources, acquisition and validation <strong>to</strong>ols at<br />
its disposal, it was established that the majority <strong>of</strong> identified KBA were based purely on<br />
existing data, museum specimens and remote sensing, <strong>with</strong>out a field work component<br />
(Interview Partner M). Site visits are a vital part <strong>of</strong> data acquisition and validation (Hill et al.<br />
2005, 95; Stewart et al. 2008, 20), since these augment and replace missing, unreliable and<br />
outdated information, thereby preventing commission and omission errors. Nevertheless,<br />
these shortcomings may be due <strong>to</strong> the low human resource requirements <strong>of</strong> the KBA<br />
identification and subsequent delineation which occurs at a national scale. Upon further<br />
investigation on site size for all <strong>approaches</strong>, the KBA may prove <strong>to</strong> assess the largest <strong>areas</strong>.<br />
This, <strong>to</strong>gether <strong>with</strong> the low human resource needs, may also explain the long time-frame<br />
required for an assessment.<br />
In summary, the approach is predominantly implemented in entire countries and is the least<br />
extensive in the criteria it employs for site identification. Furthermore, it received the weakest<br />
strength-weakness pr<strong>of</strong>ile (<strong>to</strong>gether <strong>with</strong> the FSA) and was ranked last for its input<br />
requirements, reflecting its weaknesses in delineation and prioritisation (Interview Partner D,<br />
E and G). The results obtained during this thesis were rather disappointing in view <strong>of</strong> the fact<br />
that this approach receives strong support from leading international organisations.<br />
The ERBC approach is the most comprehensive and representative in terms <strong>of</strong> capturing<br />
different scales and conservation targets (Interview Partner I and J) and in delineating<br />
important ecological processes and entire ecosystems (Interview Partner I). This is mirrored<br />
in the approach criteria it employs and its strength-weakness pr<strong>of</strong>ile.<br />
It encompasses a wide rage <strong>of</strong> different criteria, including species, ecosystem and site<br />
specific criteria, hence producing an accurate picture <strong>of</strong> the area under consideration.<br />
For the strength-weakness analysis, all key questions and criteria, except one, were<br />
classified as very strong. The only minor shortcoming <strong>of</strong> the approach is that it is not feasible<br />
<strong>to</strong> implement in heavily fragmented landscapes (Interview Partner N). However, it should be<br />
noted that this is not the objective <strong>of</strong> an ERBC approach. Rather, it aims <strong>to</strong> conserve blocks<br />
<strong>of</strong> natural habitat large enough <strong>to</strong> be resilient and responsive <strong>to</strong> large scale, short and long<br />
term change (Dinerstein et al. 2000, 16). Identifying <strong>areas</strong> for biodiversity conservation in<br />
fragmented landscapes would be better suited <strong>to</strong> the FSA, or perhaps the HCV concept.<br />
97
5. DISCUSSION<br />
Overall, the ERBC approach is the second most extensive in terms <strong>of</strong> the approach criteria it<br />
employs. Together <strong>with</strong> the REA, it was assigned the strongest strength-weakness pr<strong>of</strong>ile<br />
and regarding its input requirements it was ranked second. This approach is the most<br />
comprehensive for the methods for site choice and also has only moderate time<br />
requirements. But in terms <strong>of</strong> human resources, it is the most intensive, relying on an<br />
extremely large team <strong>of</strong> experts for completion. This, however, may be reflected in the size<br />
<strong>of</strong> the assessment area (400,000-3.6mill hectares), the complexity <strong>of</strong> addressing multiple<br />
different scales and conservation targets and in view <strong>of</strong> this, it is relatively fast.<br />
In summary, this approach is extremely well suited for large, predominantly natural regions<br />
where information and human resources are available. These results correspond well <strong>to</strong> the<br />
overall opinion that the approach is very effective and comprehensive in conserving<br />
biodiversity (Interview Partner I and J).<br />
The FSA received (<strong>to</strong>gether <strong>with</strong> the KBA approach) the weakest strength-weakness pr<strong>of</strong>ile.<br />
However, this should be viewed in regard <strong>to</strong> its objective. Since is essentially a taxon based<br />
surrogate scheme that is used <strong>to</strong> prevent the further loss <strong>of</strong> any species in production<br />
landscapes, such as forestry, agriculture or grazing <strong>areas</strong>, the criteria it employs for site<br />
identification are purely species based. This approach relies on a completely different set <strong>of</strong><br />
criteria from those identified during this thesis and therefore, does not cover an extensive<br />
array. Due <strong>to</strong> this, any statement on its accuracy <strong>of</strong> site identification cannot be established<br />
based on the arguments built during this thesis.<br />
The approach’s objectives can also explain some <strong>of</strong> the weaker results obtained for the FSA<br />
strength-weakness pr<strong>of</strong>ile. Preventing the loss <strong>of</strong> species in production landscapes means<br />
that any level <strong>of</strong> biodiversity, other than species and a few terrestrial ecosystem types,<br />
clearly fall outside <strong>of</strong> its objective. Furthermore, the FSA has, so far, not made use <strong>of</strong><br />
international experts or local user groups. For local user groups, the approach may be<br />
difficult <strong>to</strong> apply, since the identification <strong>of</strong> the focal species and their threats have posed<br />
problems for the scientific community. Until now, the approach has only been implemented in<br />
the developed world, excluding the need for international experts, since sufficient national<br />
experts were available.<br />
For its input criteria the FSA was ranked third. It faired badly for site identification, as several<br />
shortcomings were identified. This approach attempts <strong>to</strong> cover the needs <strong>of</strong> all other biota<br />
<strong>with</strong>in a given landscape, by covering the needs <strong>of</strong> a selected few. It has been shown that<br />
the effects <strong>of</strong> habitat change and fragmentation have different consequences for different<br />
species (Robinson et al. 1992, 54; Gascon et al. 1999, 223). Therefore, the assumption <strong>of</strong><br />
meeting the requirements <strong>of</strong> all biota cannot be met (e.g. Noss et al. 1997, 118;<br />
98
5. DISCUSSION<br />
Lindenmayer et al. 2002, 338; Lindenmayer and Fischer 2003, 150). Furthermore, the lack <strong>of</strong><br />
available species data sources has caused considerable problems in <strong>identify</strong>ing the focal<br />
community and their major threats (Lindenmayer et al. 2002, 340). The third criticism is that<br />
stakeholder knowledge and opinion were not included in the site identification, thereby<br />
weakening the implementation success <strong>of</strong> the approach. Additionally, it faired badly for the<br />
data sources at its disposal. It not only utilizes the least data sources, but also does not<br />
make use <strong>of</strong> stakeholder surveys. In contrast, the human resource requirements are<br />
moderate and time requirements low.<br />
Conclusively, the FSA received the weakest strength-weakness pr<strong>of</strong>ile, was ranked third for<br />
its input requirements and was not assessed for the criteria it employs. Thus, this thesis has<br />
substantiated the shortcomings already known about this approach. Nevertheless, it is an<br />
approach that is fast, efficient and specifically designed for assessing heavily fragmented,<br />
production landscapes.<br />
The REA is extremely comprehensive and representative in terms <strong>of</strong> characterising the<br />
landscape and species level <strong>of</strong> biodiversity (Interview Partner I; Sayre et al. 2000, 33, 81).<br />
This comprehensiveness is represented in the overall results obtained during this thesis.<br />
Even though it only employs a moderate range <strong>of</strong> approach criteria for site identification,<br />
resulting in a fairly accurate depiction <strong>of</strong> the area under consideration, the remaining analysis<br />
produced excellent results.<br />
Together <strong>with</strong> the ERBC approach, the REA was assigned the strongest strength-weakness<br />
pr<strong>of</strong>ile. The individual criteria were all classified as very strong, except for one. It is unable <strong>to</strong><br />
directly or indirectly conserve genetic diversity. However, its objective is <strong>to</strong> efficiently<br />
characterise two levels <strong>of</strong> biodiversity <strong>of</strong> large <strong>areas</strong> for which relatively little is known (Sayre<br />
et al. 2000, 33, 81). Empirical data, required for assessing genetic diversity, is mostly limited<br />
<strong>to</strong> a small set <strong>of</strong> species, most commonly related <strong>to</strong> agriculture (Millennium Ecosystem<br />
<strong>Assessment</strong> 2005b, 95). Therefore, in light <strong>of</strong> the REA’s objective, an analysis in terms <strong>of</strong><br />
genetic diversity would not be feasible.<br />
The REA makes use <strong>of</strong> a broad range <strong>of</strong> methods and data sources for site identification. It<br />
has low time requirements, but extremely intensive human resource requirements. The<br />
comprehensiveness <strong>of</strong> the assessment in unknown <strong>areas</strong> and its time requirements, reflect<br />
the amount <strong>of</strong> human resources needed.<br />
The general view <strong>of</strong> an REA is supported by the strong results obtained during this thesis. All<br />
in all, this approach employs a moderate amount <strong>of</strong> approach criteria. Results showed the<br />
strongest strength-weakness pr<strong>of</strong>ile and it was ranked second for its input requirements.<br />
99
5. DISCUSSION<br />
In summary, the popularity and overall opinion <strong>of</strong> the HCV concept, the ERBC approach and<br />
REA were substantiated, as well as the controversy behind the FSA. Whereas, the results<br />
obtained for the KBA approach contradicted its popularity <strong>with</strong> leading international<br />
organisations. This thesis has shown that all <strong>of</strong> the <strong>approaches</strong> have differing advantages<br />
and disadvantages (Interview Partner H) and therefore could and should be used <strong>to</strong><br />
supplement each other, <strong>to</strong> develop practical solutions for biodiversity conservation (Interview<br />
Partner C).<br />
100
6. CONCLUSION<br />
6. Conclusion<br />
This thesis has attempted <strong>to</strong> assess a range <strong>of</strong> regional and local conservation <strong>approaches</strong><br />
used <strong>to</strong> <strong>identify</strong> <strong>areas</strong> important for biodiversity conservation, compared <strong>to</strong> the HCV concept.<br />
The sample <strong>of</strong> <strong>approaches</strong> selected for this assessment, namely the High Conservation<br />
Value (HCV) concept, the Key Biodiversity Areas (KBA) approach, the Ecoregion-Based<br />
Conservation (ERBC) approach, the Focal Species Approach (FSA) and the Rapid<br />
Ecological <strong>Assessment</strong> (REA), facilitated informed conclusions <strong>to</strong> be drawn by listing<br />
strengths and weaknesses, establishing similarities and differences and <strong>identify</strong>ing their<br />
input requirements. Therefore, a classification and ranking <strong>of</strong> the <strong>approaches</strong> was enabled.<br />
Data was obtained through literature research and interviews <strong>with</strong> experts. This, firstly,<br />
enabled the selected <strong>approaches</strong> <strong>to</strong> be described and analysed on the basis <strong>of</strong> the scale<br />
they address, their objectives 78 and the criteria they employ for site identification. Secondly, a<br />
strength-weakness analysis and a comparison <strong>of</strong> the <strong>approaches</strong>’ input requirements, based<br />
on a set <strong>of</strong> predetermined key questions and criteria, were performed. For this, each key<br />
question was defined through argumentative reasoning 79 . Thus, by classifying the<br />
<strong>approaches</strong> according <strong>to</strong> various degrees <strong>of</strong> weak and strong, a strength-weakness pr<strong>of</strong>ile<br />
for each approach was established. Additionally, the reasoning allowed for an ordinal ranking<br />
system <strong>to</strong> be set up for the additional input criteria. This enabled a ranking <strong>of</strong> the <strong>approaches</strong><br />
according <strong>to</strong> their input needs. The results obtained provide conservation planning<br />
practitioners <strong>with</strong> an overview <strong>of</strong> the approach <strong>to</strong> ultimately be implemented according <strong>to</strong><br />
different goals and objectives.<br />
The HCV concept is the most extensive in terms <strong>of</strong> the criteria it employs for site<br />
identification. It uses an extremely broad array <strong>of</strong> species and ecosystem specific criteria, as<br />
well as addressing the socio-economic and cultural aspects <strong>with</strong>in the assessment area. The<br />
ERBC approach also utilizes a wide range <strong>of</strong> species and ecosystem specific criteria.<br />
However, due <strong>to</strong> the complexity <strong>of</strong> this approach, it is recommended <strong>to</strong> perform a socioeconomic<br />
analysis separately. The REA employs a limited range <strong>of</strong> species and ecosystem<br />
specific criteria, whereas the KBA approach only utilizes species specific criteria for site<br />
identification. Both these <strong>approaches</strong> also recommend a separate socio-economic and<br />
78 This was extensively covered in chapter 3.4.<br />
79 For the exact definitions, please refer <strong>to</strong> Appendix A1.<br />
101
6. CONCLUSION<br />
cultural analysis subsequent <strong>to</strong> their assessments. Lastly, the FSA approach relies solely on<br />
species specific criteria.<br />
In terms <strong>of</strong> the different <strong>approaches</strong>’ capabilities <strong>to</strong> link different scales, the ERBC approach<br />
is the most comprehensive, successfully merging the ecoregional, landscape and site scale.<br />
The HCV concept and the REA easily link the landscape and site scale, whereas the KBA<br />
approach and the FSA work only at the site and landscape scale, respectively.<br />
Both the HCV concept and the FSA were developed for implementation in production<br />
landscapes, while the REA and the KBA approach are implemented in non-production<br />
landscapes. However, the latter is used <strong>to</strong> ultimately expand and support protected <strong>areas</strong>,<br />
whereas the REA initially only characterises the landscape for a multitude <strong>of</strong> different uses.<br />
The ERBC approach, due <strong>to</strong> the large area it assesses, is implemented in both natural and<br />
production landscapes trying <strong>to</strong> find a balance between the two, in order <strong>to</strong> conserve the full<br />
range <strong>of</strong> biodiversity throughout time.<br />
The results <strong>of</strong> the strength-weakness analysis and ranking were principally determined by<br />
the individual approach’s objective and the rationale behind its conception.<br />
The HCV concept is best suited <strong>to</strong> <strong>identify</strong> sustainable management practices in forest<br />
operations at the site or landscape scale, whereas it is less suited for conservation planning<br />
at a regional scale. So far, it has little assessment exposure <strong>to</strong> terrestrial ecosystems other<br />
than forests and none <strong>to</strong> aquatic ecosystems. As it results in management recommendations<br />
and attempts <strong>to</strong> <strong>identify</strong> the smallest possible set aside area, it works well and is popular at<br />
the private sec<strong>to</strong>r level, however, it is less effective at the public sec<strong>to</strong>r level. Its style <strong>of</strong><br />
implementation, being a combination <strong>of</strong> <strong>to</strong>p-down and bot<strong>to</strong>m-up, is extremely successful.<br />
The approach is flexible and versatile in the use <strong>of</strong> different methods and data sources for<br />
site identification, <strong>with</strong> moderate human resource requirements and can be completed <strong>with</strong>in<br />
a short time-frame.<br />
As it stands momentarily, the KBA approach has some shortcomings, which may result in<br />
commission and omission errors, as well as cause problems in prioritisation. On the other<br />
hand, it is extremely flexible in the use <strong>of</strong> methods and data sources for site identification.<br />
Therefore, it can be applied in both data-rich and data-poor countries. This, however, has<br />
also led <strong>to</strong> weaknesses in the approach methodology. In contrast, it is the only approach<br />
performed at a national level, embedded <strong>with</strong>in national institutions and simultaneously<br />
providing the private sec<strong>to</strong>r level <strong>with</strong> information for responsible development operations.<br />
The KBA approach requires moderate human resources, but it is normally performed <strong>with</strong>in<br />
a lengthy time-frame.<br />
102
6. CONCLUSION<br />
The comprehensiveness and representativeness <strong>of</strong> the ERBC approach is not only<br />
determined by the use <strong>of</strong> multiple scales and identification criteria, but is also reflected in the<br />
results <strong>of</strong> the strength-weakness analysis. It is an extremely powerful approach<br />
encompassing, both terrestrial and aquatic ecosystems, the private and public sec<strong>to</strong>r level<br />
<strong>with</strong> a bot<strong>to</strong>m-up and <strong>to</strong>p-down concept. Furthermore, this approach provides the most<br />
detailed threat assessment <strong>to</strong>ols specifically <strong>identify</strong>ing highly threatened, but conservable,<br />
priority regions. It is the only one attempting <strong>to</strong> safeguard the full range <strong>of</strong> biodiversity<br />
throughout time. However, it is difficult <strong>to</strong> perform the ERBC assessment in heavily<br />
developed or fragmented regions. It is flexible and versatile in the use <strong>of</strong> methods and data<br />
sources for site identification, but requires intensive human resources and is normally<br />
completed <strong>with</strong>in a moderate time-frame.<br />
In contrast, the FSA was designed for heavily fragmented production landscapes, but does<br />
not address the persistence <strong>of</strong> biodiversity over time. Furthermore, it can only be performed<br />
in terrestrial ecosystems. The FSA can be applied at both the private and public sec<strong>to</strong>r level<br />
and makes use <strong>of</strong> a bot<strong>to</strong>m-up and <strong>to</strong>p-down style. It is, however, weak and less flexible in<br />
the use <strong>of</strong> methods and data sources for site identification, this having caused several<br />
problems. However, it requires moderate human resources and can be completed in a short<br />
time-frame.<br />
The REA is also a comprehensive approach, albeit less due <strong>to</strong> the scales and identification<br />
criteria it addresses, but rather <strong>to</strong> the results <strong>of</strong> the strength-weakness analysis. It is the only<br />
approach best suited for <strong>areas</strong> <strong>of</strong> which very little is known. Here, it successfully<br />
characterises the landscape and site scale <strong>of</strong> biodiversity, being implemented for a multitude<br />
<strong>of</strong> different purposes. The REA can be implemented by both the private and public sec<strong>to</strong>r<br />
and effectively combines the style <strong>of</strong> <strong>to</strong>p-down and bot<strong>to</strong>m-up. This flexibility originates in its<br />
scientifically sound use <strong>of</strong> methods and data sources for site identification which, however,<br />
requires intensive human resources, but is completed <strong>with</strong>in a relatively short time-frame.<br />
In conclusion, the ERBC approach is probably the most suited for conserving the full range<br />
<strong>of</strong> biodiversity in less developed regions, but only when sufficient human resources, data and<br />
time are available. The REA is extremely appropriate for conserving biodiversity in less<br />
developed regions, also requiring sufficient human resources, but lower data and time<br />
requirements. The KBA approach is well suited for national level applications <strong>to</strong> expand and<br />
strengthen the protected area system, when human resources are not as abundant, yet time<br />
is. This application can rely purely on existing data sources <strong>with</strong>out validation. The HCV<br />
concept is appropriate and flexible in the design <strong>of</strong> management options and<br />
103
6. CONCLUSION<br />
recommendations for sustainable forest operations, e<strong>special</strong>ly when time is <strong>of</strong> the essence.<br />
Similar <strong>to</strong> this, the FSA is also used in production landscapes, albeit, in heavily fragmented<br />
<strong>areas</strong> <strong>with</strong> moderate human resource requirements and where time is <strong>of</strong> the essence.<br />
The results obtained during this work did not permit any assessment <strong>to</strong> be made on the<br />
efficiency <strong>of</strong> the <strong>approaches</strong>. This was due <strong>to</strong> a lack <strong>of</strong> data on effectiveness and insufficient<br />
information on the cost and size <strong>of</strong> the <strong>approaches</strong>’ assessment <strong>areas</strong>. Further research in<br />
this direction would be desirable <strong>to</strong> gain a deeper understanding <strong>of</strong> the <strong>approaches</strong>. With<br />
additional work, the determined strengths and weaknesses could either be validated or<br />
invalidated and this is, thus, strongly recommended. Building and expanding on this would<br />
be the analysis <strong>of</strong> approach effectiveness <strong>to</strong> determine a conclusive outcome on overall<br />
efficiency.<br />
From the interviews it became apparent that none <strong>of</strong> the <strong>approaches</strong> conserve biodiversity.<br />
They only indirectly play a role in safeguarding nature’s diversity. Instead they are effective<br />
<strong>to</strong>ols for awareness raising, prioritisation or fundraising in the field <strong>of</strong> biodiversity<br />
conservation. The advantages and disadvantages identified during this thesis could and<br />
should be considered when implementing or combining <strong>approaches</strong>, in order <strong>to</strong> increase the<br />
overall success <strong>of</strong> biodiversity conservation. In addition, new challenges such as adaptation<br />
<strong>to</strong> climate change and conservation <strong>of</strong> ecosystem services in line <strong>with</strong> sustainable<br />
development need <strong>to</strong> be considered when allocating resources and prioritising conservation<br />
projects.<br />
104
7. GENERAL TERMS<br />
7. General Terms<br />
Biodiversity: refers <strong>to</strong> the variability among living organisms from all sources including<br />
terrestrial, marine and other aquatic ecosystems and the ecological complexes <strong>of</strong> which they<br />
are part; this includes diversity <strong>with</strong>in species, between species and <strong>of</strong> ecosystems (CBD<br />
1995).<br />
Biodiversity level: refers <strong>to</strong> the different levels <strong>of</strong> biodiversity. These can be defined as<br />
diversity <strong>with</strong>in and between species and ecosystem diversity. Diversity <strong>with</strong>in species is<br />
synonymous <strong>with</strong> genetic diversity and diversity between species <strong>with</strong> species diversity.<br />
The term ecosystem diversity is limited <strong>to</strong> the number <strong>of</strong> different ecosystems, as time<br />
restraints do not permit a more detailed analysis <strong>of</strong> various ecosystem functions.<br />
Bot<strong>to</strong>m-up: proceeding from the bot<strong>to</strong>m or beginning <strong>of</strong> a hierarchy or process upwards<br />
(Oxford Dictionary 2006, 163). Thus, it refers <strong>to</strong> decisions or conservation projects being<br />
enforced locally and then escalating <strong>to</strong> either a national or international level.<br />
Complementarity: provides a way <strong>of</strong> selecting reserves or management units, that<br />
combined represent the greatest possible biodiversity <strong>with</strong>in the least possible area<br />
(Dinerstein et al. 2000, 177). The concept <strong>of</strong> complementarity is a prioritisation exercise that<br />
determines how much each site contributes <strong>to</strong> conservation by complimenting existing sites.<br />
The priority level <strong>of</strong> each site is based, not only on its biological composition, but on that <strong>of</strong><br />
other sites as well. Thus, conservation investment can be maximised (Langhammer et al.<br />
2007, 7)<br />
Connectivity: refers <strong>to</strong> the degree by which an individual set-aside area is connected <strong>to</strong><br />
another <strong>with</strong>in a network, or <strong>to</strong> buffer zones, corridors or stepping s<strong>to</strong>nes for migra<strong>to</strong>ry<br />
species (Hockings et al. 2006, 19).<br />
Data acquisition: refers <strong>to</strong> the way data has been collected, which methods <strong>of</strong> data<br />
collection have been used <strong>to</strong> gather information needed for an identification process.<br />
Data validation: refers <strong>to</strong> the way acquired and existing data is substantiated.<br />
105
7. GENERAL TERMS<br />
Ecosystem: is a biological community <strong>of</strong> interacting organisms and their physical<br />
environment (Oxford Dictionary 2006, 454). In this thesis terrestrial refers <strong>to</strong> dry land,<br />
whereas aquatic refers <strong>to</strong> water (Oxford Dictionary 2006, 1488, 65).<br />
Ecosystem services: are the benefits humans obtain from ecosystems. These include<br />
provision services, such as food, timber, water and fibre; regulating services, such as<br />
climate, floods, wastes, disease and water quality; supporting services, such as soil<br />
formation, nutrient cycling and pho<strong>to</strong>synthesis and cultural services, such as recreation,<br />
aesthetic enjoyment and spiritual fulfilment (Millennium Ecosystem <strong>Assessment</strong> 2005a, 2).<br />
Ecoregion: an area defined in terms <strong>of</strong> its natural features and environment (Oxford<br />
Dictionary 2006, 454). In this thesis the term ecoregion is defined as a large unit <strong>of</strong> land or<br />
water (on the scale <strong>of</strong> up <strong>to</strong> millions <strong>of</strong> hectares) containing a geographically distinct<br />
assemblage <strong>of</strong> natural communities that share a large majority <strong>of</strong> their species and<br />
ecological dynamics, environmental conditions, such as climate, and interact ecologically <strong>to</strong><br />
ensure their long term persistence (Dinerstein et al. 2000, 241) 80 .<br />
Effectiveness: the production <strong>of</strong> a desired or intended result (Oxford Dictionary 2006, 456).<br />
In this thesis the term effectiveness is defined as the effect an approach has on biodiversity<br />
conservation. This thesis has defined effectiveness as an approach’s desired or intended<br />
outcome. It may be measured through determining whether the value <strong>of</strong> interest really has<br />
been conserved (Interview Partner O). Ways <strong>of</strong> determining effectiveness would be <strong>to</strong> see<br />
whether the target species is persisting, by either looking <strong>to</strong> see whether the threat has been<br />
abated, or whether it’s habitat is remaining unchanged or increasing in size and naturalness,<br />
for example. Thus, effectiveness can be viewed as output <strong>of</strong> the approach (Interview Partner<br />
O). For a solid scientific conclusion <strong>of</strong> effectiveness <strong>to</strong> be made, it would have <strong>to</strong> be<br />
measured over time.<br />
Efficiency: is defined as output relative <strong>to</strong> input. Output has been defined by effectiveness<br />
(see effectiveness). Input are fac<strong>to</strong>rs such as time, cost and other resources required <strong>to</strong><br />
accomplish the objectives (Interview Partner O).<br />
Endemic: any species whose distribution is confined <strong>to</strong> a given area is said <strong>to</strong> be endemic <strong>to</strong><br />
that area. The range <strong>of</strong> distribution may vary considerably, spanning an entire continent, or<br />
covering only a few hectares. A small geographic range makes any species vulnerable <strong>to</strong><br />
80 However, it should be noted that neither ecoregions, nor landscapes have predetermined minimum<br />
and maximum scale limitations and there is considerable overlap <strong>of</strong> sizes between them (WWF<br />
Conservation Science Program 2004).<br />
106
7. GENERAL TERMS<br />
extinction (Encyclopaedia Britannica 2009). This thesis has included biome, bioregions and<br />
restricted range species in the definition <strong>of</strong> endemic.<br />
Expert: a person who is very knowledgeable about, or skilful in, a particular area (Oxford<br />
Dictionary 2006, 501). In this thesis, expert was divided in<strong>to</strong> international and national. An<br />
international expert is defined as a person who has gained expertise on an international<br />
level or <strong>with</strong>in several different countries, whereas a national expert is a person who has<br />
gained expertise only <strong>with</strong>in one country. Skills and knowledge can be obtained from experts<br />
by either including them in an assessment team or by letting them take part in a survey (for<br />
additional information please see surveys).<br />
Financial resources: refers <strong>to</strong> the cost required for either the identification <strong>of</strong> <strong>areas</strong> or the<br />
scoping assessment <strong>of</strong> the various <strong>approaches</strong>.<br />
Focal species: serve an umbrella function in terms <strong>of</strong> encompassing habitats needed by<br />
many other species. They play a vital role in maintaining community structure or processes<br />
and are sensitive <strong>to</strong> likely changes. The main characteristic <strong>of</strong> a focal species is that its<br />
status and trend provide insight in<strong>to</strong> the integrity <strong>of</strong> the ecosystem <strong>to</strong> which it belongs, thus,<br />
serving as an indica<strong>to</strong>r <strong>of</strong> ecological sustainability (Millspaugh and Thompson 2008, pg 59).<br />
The term focal species has been used in a broader context <strong>to</strong> include flagship, indica<strong>to</strong>r and<br />
economically viable species (Dinerstein et al. 2000, 39).<br />
Global: relating <strong>to</strong> the whole world; worldwide (Oxford Dictionary 2006, 605).<br />
Habitat: is specific type <strong>of</strong> environment which is <strong>of</strong>ten used <strong>to</strong> describe the requirements <strong>of</strong> a<br />
certain species or community (Dinerstein et al. 2000, 243).<br />
Human resources: describes the extent <strong>of</strong> human resources, the skills and level <strong>of</strong><br />
education required for identification, ranging from international experts, <strong>to</strong> general<br />
practitioners, <strong>to</strong> people <strong>with</strong> a more general level <strong>of</strong> education (Interview Partner K).<br />
Indica<strong>to</strong>r species: an organism whose characteristics (presence or absence, population<br />
density, dispersion, reproductive success) have been used as a simple, cost-effective index<br />
<strong>to</strong> measure numbers, trends or status <strong>of</strong> other species or the health <strong>of</strong> an ecosystem. An<br />
indica<strong>to</strong>r species is art <strong>of</strong> the broader classification <strong>of</strong> focal species (Millspaugh and<br />
Thompson 2008, 59).<br />
107
7. GENERAL TERMS<br />
Inven<strong>to</strong>ries: refers <strong>to</strong> a complete list <strong>of</strong> items (Oxford Dictionary 2006, 747). In this thesis it<br />
refers <strong>to</strong> the process <strong>of</strong> making a detailed list, report or record <strong>of</strong> all species and or habitats<br />
<strong>with</strong>in the area under consideration.<br />
Irreplaceability: the irreplaceability <strong>of</strong> an area was originally defined as the extent <strong>to</strong> which<br />
geographic or spatial options for conservation will disappear if that particular site is lost<br />
(Pressey et al. 1994, 242). In this thesis it refers <strong>to</strong> any species being unique <strong>to</strong> a given area<br />
or site. Thus, species <strong>with</strong>in a given area <strong>with</strong> lower irreplaceability will be more represented<br />
either regionally or globally (Ferrier et al. 2000, 305). For instance, a site is completely<br />
irreplaceable, if it contains one or more species that occur nowhere else, whereas a site<br />
containing species that are widely distributed is less irreplaceable (or more replaceable), as<br />
many alternatives exist for conserving these species (Langhammer et al. 2007, 7).<br />
Keys<strong>to</strong>ne species: a keys<strong>to</strong>ne species is a species whose presence is crucial in<br />
maintaining the organisation and diversity <strong>of</strong> ecological communities. In addition, relative <strong>to</strong><br />
the rest <strong>of</strong> the community, these species are exceptional in <strong>importance</strong> (Mills et al. 1993,<br />
219).<br />
Landscape: defined as an area that contains a set <strong>of</strong> species, communities, or ecological<br />
processes that differ from other such units (Moore et al. 2004, 5, 6). The term does not have<br />
an exact scientific definition, but instead is used in flexibly in defining a large land area <strong>with</strong><br />
some defining or perceptible characteristics. This may change in different <strong>areas</strong> due <strong>to</strong> the<br />
biological, geographical, political, economic and social fac<strong>to</strong>rs (Stewart and Rayden 2009,<br />
7). For the purpose <strong>of</strong> the thesis, the landscape scale lies between a site and an ecoregion 81 .<br />
Local: is <strong>of</strong>ficially defined as an individual unit; relating or restricted <strong>to</strong> a particular area<br />
(Oxford Dictionary 2006, 836). For the purpose <strong>of</strong> this study, the size <strong>of</strong> local has been<br />
limited <strong>to</strong> being smaller than provincial, i.e. at a municipal or community level.<br />
Local user groups: a user group is a set <strong>of</strong> people who have similar interests, goals, or<br />
concerns (Webopedia 2005). In this thesis local user groups have been defined as user<br />
groups residing at the local level which have a direct interest in the use and management <strong>of</strong><br />
some aspect <strong>of</strong> biodiversity. Thus, user groups can be seen as stakeholders (see survey<br />
definition).<br />
81 Please see definitions for site and ecoregion. It should be noted that neither ecoregions, nor<br />
landscapes have predetermined minimum and maximum scale limitations and there is considerable<br />
overlap <strong>of</strong> sizes between them (WWF Conservation Science Program 2004).<br />
108
7. GENERAL TERMS<br />
Moni<strong>to</strong>ring: defined in this thesis as collecting information on indica<strong>to</strong>rs, repeatedly over<br />
time, <strong>to</strong> discover trends in the status <strong>of</strong> the set-aside area and the activities and processes <strong>of</strong><br />
management (Oxford Dictionary 2006, 922; Hockings et al. 2006, 15).<br />
Management: administration, regulation and maintenance <strong>of</strong> resources (Oxford Dictionary<br />
2006, 865) where, in this thesis, resources refer <strong>to</strong> the content <strong>of</strong> biodiversity and the natural<br />
processes that produce it (Dinerstein et al. 2000, 240).<br />
Persistence: protected <strong>areas</strong> should promote the long term survival <strong>of</strong> all elements <strong>of</strong><br />
biodiversity they contain by maintaining natural processes, viable populations and by<br />
excluding threats (Margules and Pressey 2000, 243).<br />
Private sec<strong>to</strong>r level: the private sec<strong>to</strong>r comprises individuals and privately owned<br />
enterprises (Oxford Dictionary 2006, 1142). Thus, the private sec<strong>to</strong>r level relates <strong>to</strong> any<br />
conservation project identified by and <strong>with</strong>in an area owned and/ or used by the private<br />
sec<strong>to</strong>r.<br />
Protected area: “an area <strong>of</strong> land and/ or sea e<strong>special</strong>ly dedicated <strong>to</strong> the protection and<br />
maintenance <strong>of</strong> biological diversity, and <strong>of</strong> natural and associated cultural resources, and<br />
managed through legal or other effective means,” as defined by the IUCN (1994). This refers<br />
<strong>to</strong> a legally established land or water area under either public or private ownership that is<br />
regulated and managed <strong>to</strong> achieve specific conservation objectives (OECD Statistical Portal<br />
1997). This term has been used synonymously <strong>with</strong> set-aside area, as it refers <strong>to</strong> either<br />
public or private ownership.<br />
Public sec<strong>to</strong>r level: the public sec<strong>to</strong>r is controlled by the state (Oxford Dictionary 2006,<br />
1161). In this thesis, the public sec<strong>to</strong>r level refers <strong>to</strong> any conservation project identified by<br />
and <strong>with</strong>in the public sec<strong>to</strong>r, ranging from the community or municipal <strong>to</strong> state.<br />
Rapid <strong>Assessment</strong>: a quick scientific survey or count that helps measure local biodiversity<br />
<strong>to</strong> obtain information on a selected area (Arizona-Sonora Desert Museum 2006-2009),<br />
providing a fast, efficient and cost effective method <strong>to</strong> produce estimates on <strong>to</strong>tal biodiversity<br />
(Oliver et al. 1993, 562). Field surveys have been used synonymously <strong>with</strong> rapid assessment<br />
in this thesis.<br />
Regional: is defined as relating <strong>to</strong>, or characteristic <strong>of</strong>, a region (Oxford Dictionary 2006,<br />
1211). For this study, this may range from provincial <strong>to</strong> continental.<br />
109
7. GENERAL TERMS<br />
Representativeness: the long-term success <strong>of</strong> in-situ conservation requires that the global<br />
system <strong>of</strong> protected <strong>areas</strong> represent, or sample, the full variety <strong>of</strong> biodiversity, ideally at all<br />
levels <strong>of</strong> organisation (Margules and Pressey 2000, 243).<br />
Required time: is the amount <strong>of</strong> time necessary for the identification <strong>of</strong> biodiversity relevant<br />
<strong>areas</strong>. This should be determined or estimated during the scoping assessment.<br />
Required resources: is defined here as the cost, data and personnel requirements needed<br />
<strong>to</strong> complete an assessment. This should be determined or estimated during the scoping<br />
assessment.<br />
Scoping assessment: a scoping assessment is performed in the initial planning stages <strong>of</strong> a<br />
conservation project <strong>with</strong> the aim <strong>of</strong> determining how best <strong>to</strong> achieve the goals <strong>of</strong> the project<br />
<strong>with</strong> minimal expenditure, both financial and time wise, as well as determining the<br />
assessment team requirements (Dinerstein et al. 2000, 50, 57).<br />
Site: is a variably sized, but homogenous unit, that is actually or could potentially, be<br />
managed for conservation (Langhammer et al. 2007, 15) and/ or production. In this thesis<br />
the site-scale is defined as a tract <strong>of</strong> land up <strong>to</strong> 200 000 hectares. It should be noted that<br />
certain examples <strong>of</strong> concessions exits that are large than 1 million hectares (Interview<br />
Partner D). These exceptions would also fall under the site-scale.<br />
Size: <strong>of</strong> a set aside area will vary according <strong>to</strong> the conservation targets. However<br />
determining the minimum size required <strong>to</strong> maintain viable populations <strong>of</strong> particular species,<br />
<strong>to</strong> maintain interior species, etc. is <strong>of</strong> critical <strong>importance</strong> (Hill et al. 2005, 86).<br />
Species: is a basic unit <strong>of</strong> classification consisting <strong>of</strong> a population or series <strong>of</strong> populations <strong>of</strong><br />
closely related and similar organisms (Dinerstein et al. 2000, 257).<br />
Species richness: is a measure <strong>of</strong> species diversity calculated as the <strong>to</strong>tal number <strong>of</strong><br />
species in a habitat or community (Dinerstein et al. 2000, 258).<br />
Stakeholder: is defined as any person, group, or organization <strong>with</strong> a direct or indirect<br />
interest in the use and management <strong>of</strong> some aspect <strong>of</strong> biodiversity in a given area, or who<br />
affects, or is affected by, a particular conservation action, ranging from local users, <strong>to</strong><br />
government agencies, NGOs, experts and the private sec<strong>to</strong>r, including local, regional, and<br />
international levels (USAID 2005) 82 .<br />
82 Please refer <strong>to</strong> the definition <strong>of</strong> surveys for additional information.<br />
110
7. GENERAL TERMS<br />
State or naturalness: State refers <strong>to</strong> the extent a habitat has been modified by humans and<br />
naturalness <strong>to</strong> the extent a habitat remains unchanged (i.e. in its natural state). Natural<br />
habitats are favoured, since there is a high relation between these and its biodiversity value.<br />
Furthermore, a high proportion <strong>of</strong> rare species and natural ecological processes are <strong>of</strong>ten<br />
associated <strong>with</strong> natural <strong>of</strong> near-natural habitats and (Hill et al. 2005, 85).<br />
Surveys: define the collection <strong>of</strong> spatial and/or temporal data <strong>of</strong> a species, community or<br />
habitat (Hill et al. 2005, 3). In this thesis surveys have been broadly divided in<strong>to</strong> expert,<br />
stakeholder and field surveys. Expert survey refers <strong>to</strong> the collection <strong>of</strong> data, according <strong>to</strong><br />
their knowledge or skill <strong>with</strong>in a specific area <strong>of</strong> interest. Stakeholder survey refers <strong>to</strong> the<br />
acquiring <strong>of</strong> data, according <strong>to</strong> their opinion, knowledge and relative involvement in project.<br />
Field surveys refer <strong>to</strong> the collection <strong>of</strong> data through a site visit and have been used<br />
synonymously <strong>with</strong> rapid assessments. All three categories <strong>of</strong> surveys are predominantly<br />
used for data acquisition and/ or validation.<br />
Threat: is an indication <strong>of</strong> impeding or possible danger or harm <strong>to</strong> either one or all <strong>of</strong> the<br />
levels <strong>of</strong> biodiversity (modified from Oxford 2006, 1501). This can either be anthropogenic or<br />
natural in nature. A threat can either be external or internal. An external threat is defined as<br />
a threat occurring outside the area under consideration <strong>with</strong> an influence on that area,<br />
whereas an internal threat is defined as a threat occurring <strong>with</strong>in the area <strong>of</strong> interest.<br />
Threat status: refers <strong>to</strong> a species' risk <strong>of</strong> becoming globally extinct. This has been classified<br />
in<strong>to</strong> a system ranging from not determined, least concerned <strong>to</strong> endangered and extinct. The<br />
identified area should contain threatened species which can further be sub-divided in<strong>to</strong> near<br />
threatened, vulnerable, endangered and critically endangered (IUCN 2001, 407).<br />
Threatened: describes any species that is vulnerable <strong>to</strong>wards extinction as defined by the<br />
IUCN red list which further divides this in<strong>to</strong> three categories: endangered, critically<br />
endangered and vulnerable, depending on the degree <strong>of</strong> extinction threat (Baillie et al. 2004,<br />
2).<br />
Tolerance or sensitivity <strong>to</strong>wards a threat: this refers <strong>to</strong> a species' ability <strong>to</strong> rapidly detect,<br />
respond <strong>to</strong>, or be affected by (sensitivity) a person or thing likely <strong>to</strong> cause harm or damage<br />
(threat), or a species’ ability, willingness or capacity <strong>to</strong> endure a threat (<strong>to</strong>lerance) (modified<br />
from Oxford Dictionary 2006, 1311, 1501, 1515).<br />
111
7. GENERAL TERMS<br />
Top-down: controlled from the highest level; proceeding from the general <strong>to</strong> the particular<br />
(Oxford Dictionary 2006, 1519). In this thesis it refers <strong>to</strong> decisions or conservation projects<br />
being enforced from an international level upon a local level, and also from a highest state<br />
level upon a local level (Interview Partner C).<br />
Use <strong>of</strong> existing data: refers <strong>to</strong> available data such as scientific publications, museum<br />
specimens, expert knowledge, spatial plans (i.e. land maps for infrastructure and<br />
development, both present and forecasted; hydrological plans, species distribution maps;<br />
etc) and existing remotely sensed data.<br />
Use <strong>of</strong> remote sensing: remote sensing techniques will include both satellite-based remote<br />
sensing and aerial pho<strong>to</strong>graphy, which can be used for mapping and/ or quantification <strong>of</strong><br />
habitats at various resolutions (Hill et al. 2005, 154).<br />
Viability: refers <strong>to</strong> a species ability <strong>to</strong> live or exist in a particular area (Oxford Dictionary<br />
2006, 1609).<br />
Vulnerability: exposed <strong>to</strong> a risk <strong>of</strong> being attacked or harmed (Oxford Dictionary 2006,<br />
1621). In this thesis, it refers <strong>to</strong> the likelihood that a site’s biodiversity will be lost in the future<br />
(Pressey and Taffs 2001, 355). It can be viewed as a temporal, rather than a spatial<br />
measure, <strong>of</strong> irreplaceability, i.e. an area can either be conserved now or not at all. In<br />
contrast, sites <strong>with</strong> a low vulnerability reserve other options for future protection. It can either<br />
be measured on a site-basis (species will be lost from that particular site) or species-basis<br />
(species will go globally extinct) (Langhammer et al. 2007, 7).<br />
112
REFERENCES<br />
References<br />
Alliance for Zero Extinction (2005): Pinpointing and conserving epicentres <strong>of</strong> imminent<br />
extinctions; (retrieved 18.08.2009) http://www.zeroextinction.org/<br />
Arizona-Sonora Desert Museum (2006-2009): Invaders Glossary <strong>of</strong> Terms; (retrieved<br />
17.10.2009) http://www.desertmuseum.org/invaders/invaders_glossary.php?alpha=r<br />
Balmford A., Bennun L., ten Brink B., Cooper D., Côté I. M., Crane P., Dobson A., Dudley N.,<br />
Dut<strong>to</strong>n I., Green R. E., Gregory R. D., Harrison J., Kennedy E. T., Kremen C., Leader-<br />
Williams N., Lovejoy T. E., Mace G., May R., Mayaux P., Morling P., Phillips J.,<br />
Redford K., Ricketts T. H., Rodríguez J. P., Sanjayan M., Schei P. J., van Jaarsfeld A.<br />
S., Walther B. A. (2005): Science and the Convention on Biological Diversity’s 2010<br />
target; Science 307: 212-213<br />
Baillie J., Hil<strong>to</strong>n-Taylor C., Stuart S. N. (2004): IUCN red list <strong>of</strong> threatened species: a global<br />
species assessment; IUCN<br />
Bani L., Baiet<strong>to</strong> M., Bot<strong>to</strong>ni L., Masse R. (2002): The use <strong>of</strong> focal species in designing a<br />
habitat network for a lowland area <strong>of</strong> Lombardy, Italy; Conservation Biology; 16(3):826-<br />
831<br />
BirdLife International (2009) Important Bird Areas; (retrieved: 18.08.2009)<br />
http://www.birdlife.org/<br />
Boakes E. H., Mace G. M., McGowan P. J. K., Fuller R. A. (2009): Extreme contagion in<br />
global habitat clearance; Proc. R. Soc. B<br />
Bonn A., Rodrigues A. S. L., Gas<strong>to</strong>n K. J. (2002): Threatened and endemic species: are they<br />
good indica<strong>to</strong>rs <strong>of</strong> patterns <strong>of</strong> biodiversity on a national scale? Ecology Letters, 5:733-<br />
741<br />
Boyd C., Brooks T. M., Butchart S. H. M., Edgar G. J., da Fonseca G. A. B., Hawkins F.,<br />
H<strong>of</strong>fmann M., Sechrest W., Stuart S. N., van Dijk P. P. (2008): Spatial scale and the<br />
conservation <strong>of</strong> threatened species; Conservation Letters; 1(1):37-43<br />
Brooker L. (2002): The application <strong>of</strong> focal species knowledge <strong>to</strong> landscape design in<br />
agricultural lands using the ecological neighbourhood as a template; Landscape and<br />
Urban Planning; 60:185-210<br />
Brooks T. M., Mittermeier R. A., da Fonseca G. A. B., Gerlach J., H<strong>of</strong>fmann M., Lamoreux J.<br />
F., Mittermeier C. G., Pilgrim J. D., Rodrigues A. S. L. (2006): Global biodiversity<br />
conservation priorities; Science 313:58-61<br />
Brooks T. M., da Fonseca G. A. B., Rodrigues A. S. L. (2004): Protected <strong>areas</strong> and species;<br />
Conservation Biology; 18(3):616-618<br />
113
REFERENCES<br />
Bryant D., Nielsen D., Tangley L. (1997): Last frontier forests; World Resources Institute;<br />
Washing<strong>to</strong>n, DC<br />
Butchart S. H. M., Stattersfield A. J., Bennun L. A., Shutes S. M., Akçakaya H. R., Baillie J.<br />
E. M., Stuart S. N., Hil<strong>to</strong>n-Taylor C., Mace G. M. (2004): Measuring Global Trends in<br />
the Status <strong>of</strong> Biodiversity: Red List Indices for Birds; PloS Biology; 2(12):1-11<br />
Conservation International (2008): Key Biodiversity Areas and governments; national<br />
conservation supporting a global strategy <strong>to</strong> meet international targets; (retrieved<br />
15.11.2009)<br />
http://www.conservation.org/Event%20Documents/KBAs%20and%20governments.pdf<br />
Colchester M. (2005-07): Safeguards and ecosystem conversions; (retrieved 07.06.2009)<br />
http://www.hcvnetwork.org/resources/comment-consultation<br />
Convention on Biological Diversity (2005): Guidelines for the rapid ecological assessment <strong>of</strong><br />
biodiversity in inland water, coastal and marine <strong>areas</strong>. Secretariat <strong>of</strong> the Convention on<br />
Biological Diversity, Montreal, Canada, CBD Technical Series no. 22 and the<br />
Secretariat <strong>of</strong> the Ramsar Convention, Gland, Switzerland, Ramsar Technical Report<br />
no.1<br />
Convention on Biological Diversity (1995): Multilateral, No 30619; Article 2; Rio de Janeiro;<br />
(retrieved 17.10.2009) http://www.cbd.int/doc/legal/cbd-un-en.pdf<br />
Dinerstein E., Powell G., Olson D., Wikramanayake E. D., Abell R., Loucks C., Underwood<br />
E., Allnutt T., Wettengel W., Ricketts T., Strand H., O'Connor S., Burgess N. (2000): A<br />
workbook for conducting biological assessments and developing biodiversity visions for<br />
ecoregion-based conservation; Conservation Science Program, World Wildlife Fund;<br />
Washing<strong>to</strong>n, D. C.<br />
Dinerstein E., Olson D., Atchley J., Loucks C., Contreras-Balderas S., Abell R., Iñigo E.,<br />
Enkerlin E., Williams C., Castilleja G. (2001): Ecoregion-based conservation in the<br />
Chihuahuan Desert: A biological assessment; The Nature Conservancy, PRONATURA<br />
Noreste, and the Institu<strong>to</strong> Tecnologico y de Estudios Superiores de Monterrey (ITESM)<br />
Dudley N. (Edi<strong>to</strong>r) (2008): Guidelines for Applying Protected Area Management Categories;<br />
Gland, Switzerland: IUCN<br />
Eken G., Bennun L., Brooks T. M., Darwall W., Fishpool L. D. C., Foster M., Knox D.,<br />
Langhammer P., Matiku P., Radford E., Salaman P., Sechrest W., Smith M. L., Spec<strong>to</strong>r<br />
S., Tord<strong>of</strong>f A. (2004): Key biodiversity <strong>areas</strong> as site conservation targets; Bioscience<br />
54(12):1110-1118<br />
Eken G., Bozdoğan M., Karataş A., Lise Y. (2004): Key biodiversity <strong>areas</strong>: Identifying the<br />
world's priority sites for conservation – lessons learned from Turkey; Doğa Derneği,<br />
Ankara, Turkey<br />
Encyclopeadia Britannica (2009): Encyclopedia Britannica Online: (retrieved 15.11.2009)<br />
http://www.britannica.com/EBchecked/<strong>to</strong>pic/186799/endemism<br />
114
REFERENCES<br />
Ferrier S., Pressey R. L., Barrett T. W. (2000): A new predic<strong>to</strong>r <strong>of</strong> the irreplaceability <strong>of</strong> <strong>areas</strong><br />
for achieving a conservation goal, its application <strong>to</strong> real-world planning; Biological<br />
Conservation; 93(3):303-325<br />
da Fonseca G. A. B., Balmford A., Bibby C., Boitani L., Corsi F., Brooks T. M., Gascon C.,<br />
Olivieri S., Mittermeier R. A., Burgess N., Dinerstein E., Olson D., Hannah L., Lovett J.,<br />
Moyer D., Rahbek C., Stuart S., Williams P. (2000): ... following Africa's lead in setting<br />
priorities; Nature; 405(6785):393-394<br />
Freudenberger D., Harvey J., Drew A. (2004): Predicting the biodiversity benefits <strong>of</strong> the<br />
Saltshaker Project, Boorowa, NSW, Ecological Management and Res<strong>to</strong>ration; 5(1):5-<br />
14<br />
García-Moreno J., Clay R. P., Ríos-Muñoz C. A. (2007): The <strong>importance</strong> <strong>of</strong> birds for<br />
conservation in the Neotropical region; Journal <strong>of</strong> Orthithology; 148(Suppl 2):321-326<br />
Gascon C., Lovejoy T. E., Bieeregaard R. O., Malcolm J. R., S<strong>to</strong>uffer P. C., Vasconcelos H.<br />
L., Laurance W. F., Zimmerman B., Tocher M., Borges S. (1999): Matrix habitat and<br />
species richness in tropical forest remnants; Biological Conservation 91(2-3):223–229<br />
Gebremedhin B., Fice<strong>to</strong>la G. F., Naderi S., Rezaei H.-R., Maudet C., Rioux D., Luikart G.,<br />
Flagstad Ǿ., Thuiller W., Taberlet P (2009): Frontiers in <strong>identify</strong>ing conservation units:<br />
from neutral markers <strong>to</strong> adaptive genetic variation; Animal Conservation; 12:107-109<br />
Gerlach J. (2008): Setting conservation priorities - A Key Biodiversity Areas analysis for the<br />
Seychelles Islands; The Open Conservation Biology Journal 2:44-53<br />
Gillison A. N., Liswanti N., Arief Rachman I. (1996): Rapid ecological assessment; Kerinci<br />
Seblat National Park Buffer Zone; Preliminary report on plant ecology and overview <strong>of</strong><br />
biodiversity assessment; Centre for International Forestry Research (CIFOR); Working<br />
Paper No. 14<br />
Grabherr G. (2000): Rapid biodiversity assessment for the Alps ecoregion; WWF Alpine<br />
Programme<br />
Groves G., Valutis L., Vosick D., Neely B., Whea<strong>to</strong>n K., Touval J., Runnels B. (2000):<br />
Designing a Geography <strong>of</strong> Hope: A practitioner’s handbook for ecoregional<br />
conservation planning; The Nature Conservancy<br />
Hess G. R., Koch F. H., Rubino M. J., Eschelbach K. A., Drew A. C., Favreau J. M. (2006):<br />
Comparing the potential effectiveness <strong>of</strong> conservation planning <strong>approaches</strong> in central<br />
North Carolina, USA; Biological Conservation; 128:358-368<br />
Hess G. R., King T. J. (2002): Planning open spaces for wildlife; I. selecting focal species<br />
using a Delphi survey approach; Landscape and Urban Planning; vol. 58(1):25-40<br />
HCV Resource Network (2005-07): High Conservation Value Resource Network; (retrieved<br />
06. 2009 – 01.2010) http://www.hcvnetwork.org/<br />
115
REFERENCES<br />
Hill D. A., Fasham M., Tucker G., Shewry M., Shaw P. (2005): Handbook <strong>of</strong> biodiversity<br />
methods: survey, evaluation and moni<strong>to</strong>ring; Cambridge University Press<br />
Hockings M., S<strong>to</strong>l<strong>to</strong>n S., Levering<strong>to</strong>n F. (2006): Evaluating effectiveness: A framework for<br />
assessing management effectiveness <strong>of</strong> protected <strong>areas</strong>; 2 nd ed. Issue 14 <strong>of</strong> Best<br />
Practice protected area guideline series; IUCN<br />
Huggett, A. (2007): A review <strong>of</strong> the focal species approach in Australia; Land & Water<br />
Canberra; Australia<br />
IUCN (2009): The IUCN Red List <strong>of</strong> Threatened Species; Version 2009.2; (retrieved<br />
10.01.2010) http://www.iucnredlist.org<br />
IUCN (2001): IUCN Red List Categories and Criteria: Version 3.1; IUCN Species Survival<br />
Commission; IUCN, Gland, Switzerland and Cambridge UK. ii + 30pp<br />
IUCN - Protected Areas and World heritage Programme (1994): Guidelines for protected<br />
area management categories; (retrieved 15.08.2009) http://www.unepwcmc.org/protected_<strong>areas</strong>/categories/eng/c2.htm<br />
Jennings S., Nussbaum R., Judd N., Evans T. (2003): The High Conservation Value forest<br />
<strong>to</strong>olkit; Part 1; ProForest, Cambridge, UK<br />
Khanina L. (1998): Determining keys<strong>to</strong>ne species; Conservation Ecology; 2(2):1<br />
Knight A. T., Smith R. J., Cowling R. M., Desmet P. G., Faith D. P., Ferrier S., Gelderblom C.<br />
M., Grantham H., Lombard A. T., Maze K., Nel J. L., Parrish J. D., Pence G. Q. K.,<br />
Possingham H. P., Reyers B., Rouget M., Roux D., Wilson K. A. (2007): Improving Key<br />
Biodiversity Areas approach for effective conservation planning; BioScience;<br />
57(3):256-261<br />
Lambeck R. J. (1997): Focal species: A multi-species umbrella for nature conservation;<br />
Conservation Biology; 11(4):849-856<br />
Langhammer P. F., Bakarr M. I., Bennun L., Brooks T. M., Clay P. C., Darwall W., de Silva<br />
N., Edgar G. J., Eken G., Fishpool L. D. C., da Fonseca G. A. B., Foster M. N., Knox D.<br />
H., Matiku P., Radford E. A., Rodrigues A. S. L., Salaman P., Sechrest W., Tord<strong>of</strong>f A.<br />
W. (2007): Identification and analysis <strong>of</strong> key biodiversity <strong>areas</strong>: Targets for<br />
comprehensive protected <strong>areas</strong> system; IUCN, Gland<br />
Lombard A. T., Cowling R. M., Pressey R. L., Rebelo A. G. (2003): Effectiveness <strong>of</strong> land<br />
classes as surrogates for species in conservation planning for the Cape Floristic<br />
Region; Biological Conservation 112:45-62<br />
Lindhe, A. (2005-07): Extension from forests <strong>to</strong> other ecosystems and across landscapes;<br />
retrieved (07.06.2009) http://www.hcvnetwork.org/resources/comment-consultation<br />
Lindenmayer D., Burgman M. A. (2005): Practical conservation biology; CSIRO Publishing<br />
116
REFERENCES<br />
Lindenmayer D., Fischer J. (2003): Sound science or social hook—a response <strong>to</strong> Brooker’s<br />
application <strong>of</strong> the focal species approach; Landscape and Urban Planning 62(3):149-<br />
158<br />
Lindenmayer D., Manning A. D., Smith D. B., Possingham H. P., Fischer J., Oliver I., Carthy<br />
M. A. M. (2002): A Focal Species Approach and landscape res<strong>to</strong>ration critique;<br />
Conservation Biology; 16(2): 338-345<br />
Mace G. M., Balmford A., Boitani L., Cowlishaw G., Dobson A. P., Faith D. P., Gas<strong>to</strong>n K. J.,<br />
Humphries C. J., Vane-Wright R. I., Williams P. H., Law<strong>to</strong>n J. H., Margules C. R., May<br />
R. M., Nicholls A. O., Possingham H. P., Rahbek C., van Jaarsveld A. S. (2000): It's<br />
time <strong>to</strong> work <strong>to</strong>gether and s<strong>to</strong>p duplicating conservation efforts ...; Nature; 405(6785):<br />
393<br />
Mace G. M., Possingham H. P., Leader-Williams N. (2006): Prioritizing choices in<br />
conservation; In: D MacDonald and K. Service (Edi<strong>to</strong>rs); Key Topics in Conservation<br />
Biology, Blackwell Publishing; 17-34<br />
Margules C. R., Pressey R. L. (2000): Systematic conservation planning; Nature; 405:243-<br />
253<br />
Marshall R. M., Turner D., Gondor A., Gori D., Enquist C., Luna G., Paredes Aguilar R.,<br />
Anderson S., Schwartz S., Watts C., Lopez E., Comer P. (2004): An ecological<br />
analysis <strong>of</strong> conservation priorities in the Apache Highlands; prepared by The Nature<br />
Conservancy <strong>of</strong> Arizona, Institu<strong>to</strong> del Medio Ambiente y el Desarrollo Sustentable del<br />
Estado de Sonora; agency and institutional partners<br />
Marshall, R. M., Anderson S., Batcher M., Comer P., Cornelius S., Cox R., Gondor A., Gori<br />
D., Humke J., Paredes Aguilar R., Parra I. E., Schwartz S. (2000): An ecological<br />
analysis <strong>of</strong> conservation priorities in the Sonoran Desert Ecoregion; prepared by The<br />
Nature Conservancy Arizona Chapter, Sonoran Institute, and Institu<strong>to</strong> del Medio<br />
Ambiente y el Desarrollo Sustentable del Estado de Sonora <strong>with</strong> support from<br />
Department <strong>of</strong> Defense Legacy Program, agency and institutional partners<br />
Meerman J. C., Holland B., Howe A., Jones H. L., Miller B. W. (2003): Rapid ecological<br />
assessment: Mayflower Bocawina National Park Volume I; prepared for: Friends <strong>of</strong><br />
Mayflower under a grant provided by PACT & UNDP/GEF<br />
Mieg H. A., Näf M. (2005): Experteninterviews in den Umwelt- und Planungswissenschaften;<br />
eine Einführung und Anleitung – Skript;<br />
Millennium Ecosystem <strong>Assessment</strong> (2005a): Ecosystems and human well-being: Biodiversity<br />
synthesis; World Resources Institute, Washing<strong>to</strong>n DC<br />
Millennium Ecosystem <strong>Assessment</strong> (2005b): Ecosystems and human well-being: current<br />
state and trends; report chapter 4; (retrieved 12.12.2009)<br />
http://www.millenniumassessment.org/en/Condition.aspx<br />
117
REFERENCES<br />
Mills L. S., Soule M. E., Doak D. F. (1993): The keys<strong>to</strong>ne-species concept in ecology and<br />
conservation; Bioscience; 43(4):219-225<br />
Millspaugh J. J., Thompson F. R. (ed.) (2008): Models for planning wildlife conservation in<br />
large landscapes; Academic Press; Ch.3:51<br />
Mittermeier R. A., Myers N., Thomsen J. B., Fonseca G. A. B., Olivieri S. (1998): Biodiversity<br />
Hotspots and Major Tropical Wilderness Areas: Approaches <strong>to</strong> Setting Conservation<br />
Priorities; Conservation Biology; 12(3):516-520<br />
Mittermeier R. A., Mittermeier C. G., Brooks T. M., Pilgrim J. D., Konstant W. R., da Fonseca<br />
G. A. B., Kormos C. (2003): Wilderness and biodiversity conservation; Proceedings <strong>of</strong><br />
the National Academy <strong>of</strong> Sciences <strong>of</strong> the United States <strong>of</strong> America; 100:10309-10313<br />
Moore, J. E., Kitchener, D. J., Salim, A., Pollard, E. H. B., Stanley, S. A. (2004): Ecoregional<br />
<strong>Assessment</strong> <strong>of</strong> Biological Diversity conservation in East Kalimantan, Indonesia;<br />
Volume I - Report; The Nature Conservancy Asia/Pacific Region: Indonesia Program<br />
East Kalimantan Portfolio Office<br />
Myers N., Mittermeier R. A., Mittermeier C. G., da Fonseca G. A. B., and Kent J. (2000):<br />
Biodiversity hotspots for conservation priorities; Nature 403:853-858<br />
Noss R. F., O’Connell M. A., Murphy D. D. (1997): The science <strong>of</strong> conservation planning:<br />
habitat conservation under the Endangered Species Act; Island Press, Washing<strong>to</strong>n<br />
D.C.<br />
Organisation for Economic Cooperation and Development (OECD) Statistical Portal (1997):<br />
Glossary <strong>of</strong> statistical terms; (retrieved 30.10.2009)<br />
http://stats.oecd.org/glossary/search.asp<br />
Organisation for Economic Cooperation and Development (OECD) (1993): OECD core set <strong>of</strong><br />
indica<strong>to</strong>rs for environmental performance reviews, Environmental Monographs No.83,<br />
Paris; (retrieved 20.02.2010)<br />
http://www.fao.org/ag/againfo/programmes/en/lead/<strong>to</strong>olbox/Refer/Envindi.htm#psr<br />
Oliver I., Beattie A. J. (1993): A possible methods for rapid assessment <strong>of</strong> biodiversity;<br />
Conservation Biology; 7(3):562-568<br />
Olson D. M., Dinerstein E. (1998): The Global 200: a representation approach <strong>to</strong> conserving<br />
the Earth’s most biologically valuable ecoregions. Conservation Biology; 12(3):502-515<br />
Oxford Dictionary (2006): Concise Oxford English Dictionary; 11 th<br />
University Press<br />
ed. Revised; Oxford<br />
PlantLife International (2009): Important plant <strong>areas</strong>; (retrieved: 18.08.2009)<br />
http://www.plantlife.org.uk/<br />
Pollard E. H. B. (2005): Preliminary High Conservation Value Forest assessment for Ha<br />
Nung state forest enterprise; WWF Greater Mekong<br />
118
REFERENCES<br />
Pressey R. L. (2004): Conservation planning and biodiversity: assembling the best data for<br />
the job; Conservation Biology; 18(6):1677-1681<br />
Pressey R. L., Taffs K. H. (2001): Scheduling conservation action in production landscapes:<br />
priority <strong>areas</strong> in western New South Wales defined by irreplaceability and vulnerability<br />
<strong>to</strong> vegetation loss; Biological Conservation; 100:355-376<br />
Pressey R. L., Ferrier S., Hager T. C., Woods C. A., Tully S. L., Weinman K. M. (1996): How<br />
well protected are the forests <strong>of</strong> north-eastern New South Wales? - Analyses <strong>of</strong> forest<br />
environments in relation <strong>to</strong> formal protection measures, land tenure, and vulnerability<br />
<strong>to</strong> clearing; Forest Ecology and Management; 85(1-3):311-331<br />
Pressey R. L. (1994): Ad Hoc Reservations: Forward or Backward Steps in Developing<br />
Representative Reserve Systems? Conservation Biology; 8(3):662-668<br />
Pressey R. L., Johnson I. R., Wilson P. D. (1994): Shades <strong>of</strong> irreplaceability: <strong>to</strong>wards a<br />
measure <strong>of</strong> the contribution <strong>of</strong> sites <strong>to</strong> a reservation goal; Biodiversity and<br />
Conservation; 3(3): 242-262<br />
Pressey R. L., Humphries C. J., Margules C. R., Vane-Wright R. I., Williams P. H. (1993):<br />
Beyond opportunities: Key principles in systematic reserve selection; Trends in<br />
Ecology & Evolution; 8(4):124-128<br />
Pr<strong>of</strong>orest (2005-07): Part 2: Defining High Conservation Values at national level: a practical<br />
guide; (retrieved 05.06.2009) http://www.hcvnetwork.org/resources/global-hcv-<strong>to</strong>olkits;<br />
Rainforest Alliance SmartWood Program (2005): High Conservation Value Forest (HCVF)<br />
<strong>Assessment</strong> Report for: Serapung Unit final report; Rainforest Alliance; New York<br />
Rayden T., Kruglianskas I., Stewart C. (2009): An assessment <strong>of</strong> potential High<br />
Conservation Values <strong>with</strong>in Cabo Delgado Province, Mozambique; Testing the<br />
implementation <strong>of</strong> HCV criteria for bi<strong>of</strong>uels feeds<strong>to</strong>ck developments in Southern Africa;<br />
Redford K., Coppolillo P., Sanderson E. W., da Fonseca G. A. B., Dinerstein E., Groves C.,<br />
Mace G., Maginnis S., Mittermeier R. A., Noss R., Olson D., Robinson J. G., Vedder<br />
A., Wirght M., (2003): Mapping the Conservation Landscape; Conservation Biology;<br />
17(1):116-131<br />
Robinson G. R., Holt R. D., Gaines M. S., Hamburg S. P., Johnson M. L., Fitch H. S.,<br />
Martinko E. A. (1992): Diverse and contrasting effects <strong>of</strong> habitat fragmentation;<br />
Science; 257(5069):524-526<br />
Rodrigues A. S. L., Akçakaya H. R., Andelman S. J., Bakarr M. I., Boitani L., Brooks T. M.,<br />
Chanson J. S., Fishpool L. D. C., da Fonseca G. A. B., Gas<strong>to</strong>n K. J., H<strong>of</strong>fmann M.,<br />
Marquet P. A., Pigrim J. D., Pressey R. L., Schipper J., Sechrest W., Stuart S. N.,<br />
Underhill L. G., Waller R. W., Watts M. E. J., Yan X. (2003): Global gap analysis:<br />
<strong>to</strong>wards priority regions for expanding the global protected area network; Bioscience;<br />
54(12):1092-1100<br />
119
REFERENCES<br />
Sanderson E. W., Jaiteh M., Levy M. A., Redford K. H., Wannebo A. V., Woolmer G. (2002):<br />
The human footprint and the last <strong>of</strong> the wild; BioScience; 52(10):891-904<br />
Sayre R., Rocca E., Sedaghatk Young B., Keel S., Rocca R. L., Shepard S. (2000): Nature<br />
in Focus: Rapid ecological assessment; The Nature Conservancy; Island Press;<br />
Washing<strong>to</strong>n D.C<br />
Smith R. J., Veríssimo D., Leader-Williams N., Cowling R. M., Knight A. T. (2009): Let the<br />
locals lead; Nature 462(7271):280-281<br />
Stattersfield A. J., Crosby M. J., Long A. J., Wege D. C. (1998): Endemic Bird Areas <strong>of</strong> the<br />
World: Priorities for Biodiversity Conservation; Cambridge, UK: BirdLife International<br />
Stewart C., George P., Rayden T., Nussbaum R. (2008): Good Practice Guidelines for High<br />
Conservation Value <strong>Assessment</strong> - A practical guide for practitioners and audi<strong>to</strong>rs;<br />
Pr<strong>of</strong>orest; Oxford<br />
Stewart C., Rayden T. (2009): Mapping High Conservation Values at large scales for<br />
effective site-level management; public consultation draft 1, HCV Resource Network<br />
Stewart C. (2009): HCV assessment for bi<strong>of</strong>uel feeds<strong>to</strong>ck applications - summary <strong>of</strong> lessons<br />
learned, final report; Pr<strong>of</strong>orest; Oxford<br />
The Free Dictionary by Farlex (2009): Ecosystem; (retrieved 15.11.2009)<br />
http://encyclopedia2.thefreedictionary.com/Ecosystem<br />
The Royal Society (2003): Measuring Biodiversity Conservation;<br />
The World Resources Institute (2010): The strategy for biodiversity conservation; (retrieved<br />
13.01.2010) http://www.wri.org/publication/content/8517<br />
Turner W., Spec<strong>to</strong>r S., Gardiner N., Fladeland M., Sterling E., Steininger M. (2003): Remote<br />
sensing for biodiversity science and conservation; Trends in Ecology & Evolution;<br />
18(6):306-314<br />
USAID (2005): Biodiversity Conservation: A guide for UASIAD staff and partners; US Agency<br />
for International Development; Washing<strong>to</strong>n D. C.<br />
USAID-Centre for Development Information and Evaluation (1996): Performance, moni<strong>to</strong>ring<br />
and evaluation tips: conducting key informant interviews; (retrieved 04.08.2009)<br />
http://www.usaid.gov/pubs/usaid_eval/ascii/pnabs541.txt<br />
Warman L. D., Sinclair A. R. E. (2000): A systematic method for <strong>identify</strong>ing priority<br />
conservation <strong>areas</strong> using wildlife habitat relationships and observed locations <strong>of</strong> rare<br />
species; In Proceedings, From science <strong>to</strong> management and back: a science forum for<br />
southern interior ecosystems <strong>of</strong> British Columbia; Hollstedt C., Sutherland K., Innes T.<br />
(edi<strong>to</strong>rs); Southern Interior Forest Extension and Research Partnership<br />
Webopedia (05.04.2005): What is?com; (retrieved 17.10.09)<br />
http://www.webopedia.com/TERM/U/user_group.html<br />
120
REFERENCES<br />
WWF and IUCN (1994–97): Centres <strong>of</strong> Plant Diversity: a guide and strategy for their<br />
conservation; Gland, Switzerland and Cambridge, UK; World Wide Fund for Nature<br />
and IUCN; 3 volumes<br />
Younge A., Fowkes S. (2003): The Cape Action Plan for the environment: overview <strong>of</strong> an<br />
ecoregional planning process; Biological Conservation; 112(1-2):15-28<br />
121
APPENDIX<br />
Appendices<br />
A1<br />
Explanations <strong>to</strong> Key Questions, Criteria and Sub-Criteria<br />
A. Are all levels <strong>of</strong> biodiversity addressed? Genetic diversity (C1), species diversity (C2),<br />
ecosystem diversity (C3)<br />
In order for the sub-criterion ecosystem diversity <strong>to</strong> be addressed fully, the approach should <strong>identify</strong><br />
<strong>areas</strong> containing globally, regionally or locally rare, threatened or endangered ecosystems.<br />
For species richness <strong>to</strong> be addressed completely, the approach should <strong>identify</strong> <strong>areas</strong> containing<br />
several globally, regionally or locally rare, threatened, endangered and/or endemic species. Speciesrich<br />
<strong>areas</strong> <strong>with</strong>out these previously stipulated species will not be sufficient for the sub-criterion <strong>to</strong> be<br />
met, as these <strong>areas</strong> are less <strong>of</strong> a priority for conservation purposes due <strong>to</strong> the concept <strong>of</strong><br />
irreplaceability (Langhammer et al. 2007, 7, 9).<br />
Genetic diversity provides the full range <strong>of</strong> resources for species <strong>to</strong> adapt <strong>to</strong> human impact and<br />
environmental change. Thus, conservation strategies should aim <strong>to</strong> include genetic diversity<br />
(Lindenmayer and Burgman 2005, 28, 29). However, since it is difficult <strong>to</strong> consider genetic diversity in<br />
conservation strategies (Lindenmayer and Burgman 2005, 30), the sub-criterion can still be met<br />
partially and/ or indirectly <strong>with</strong> the approach still being classified as very strong. The sub-criterion can<br />
be met indirectly through large intact landscapes 83 , as these maintain viable populations or<br />
metapopulations (groups <strong>of</strong> spatially separated populations) (HCV Resource Network 2005-07).<br />
Populations are the smallest demographic unit <strong>with</strong>in which the exchange <strong>of</strong> genetic material is more<br />
or less unrestricted. By providing suitable habitat for populations or megapopulations, genetic<br />
variation is conserved (Lindenmayer and Burgman 2005, 31). It can also be met partially, for example,<br />
if the approach specifically incorporates some species genetic data and includes this in the<br />
conservation strategy. It is, however, only met partially, as it is assumed that those few species, for<br />
which genetic data exists, will cover the needs <strong>to</strong> maintain or enhance the genetic diversity <strong>of</strong> all other<br />
species <strong>with</strong>in the area (Interview Partner J).<br />
B. Are all ecosystem types addressed? Terrestrial (C4), aquatic (C5)<br />
For all ecosystem types <strong>to</strong> be addressed, the approach has <strong>to</strong> be designed <strong>to</strong> be implemented in<br />
different types <strong>of</strong> terrestrial and aquatic ecosystems. Due <strong>to</strong> time limitations, this thesis has not<br />
distinguished between fresh and salt water ecosystems. The sub-criteria can be partially addressed if<br />
the approach has been designed <strong>to</strong> be implemented in a few different ecosystems.<br />
C. At which geographic scale is the approach applicable? Local (C6), regional (C7), global<br />
(C8) 84<br />
Approaches implemented on a larger scale, in many <strong>areas</strong> <strong>of</strong> the world, across multiple landscapes,<br />
allow for applicability and allow one <strong>to</strong> learn how the <strong>approaches</strong> function in different <strong>areas</strong> and<br />
countries (Interview Partner K). For the sub-criteria <strong>to</strong> be addressed, the approach has <strong>to</strong> be designed<br />
for application at each scale. Thus, <strong>to</strong> say an approach has been replicated on a global scale, it must<br />
have been performed in several different <strong>areas</strong> worldwide. The sub-criteria local and regional are<br />
addressed fully, if an approach has been implemented in several different local and regional <strong>areas</strong>,<br />
83 Please refer <strong>to</strong> chapter 4.1.1.2, Ecosystem Specific Criteria, for a detailed explanation.<br />
84 Please refer <strong>to</strong> chapter 7, General Terms, for precise definitions <strong>of</strong> local, regional and global.<br />
123
espectively. For a conservation strategy <strong>to</strong> be effective, the wider landscape context should always<br />
be considered (Interview Partner D and K). Thus, the local sub-criterion has been weighted less<br />
important than the other two sub-criteria. The local scale on its own will not be as effective as a local<br />
level analysis taking the regional context in<strong>to</strong> consideration. Furthermore, it has been assumed that<br />
the regional level should always encompass the local level. Therefore, for the approach <strong>to</strong> be<br />
classified as very strong either all sub-criteria are met fully or only the sub-criteria regional and global<br />
are met fully <strong>with</strong> the local being partially addressed. In addition, any weakness <strong>of</strong> the scales will<br />
result in the sub-criteria being only partially addressed.<br />
D. At which level has the approach been implemented? Private sec<strong>to</strong>r level (C9), public sec<strong>to</strong>r<br />
level (C10)<br />
The sub-criterion private sec<strong>to</strong>r level is classified as being addressed fully if the approach has been<br />
designed <strong>to</strong> be implemented by and/ or <strong>with</strong>in the private sec<strong>to</strong>r. If weaknesses in implementation<br />
exist, then this sub-criterion will only be addressed partially. The sub-criterion, public sec<strong>to</strong>r level, is<br />
classified as being captured fully, if the approach has been designed <strong>to</strong> be implemented by and/ or<br />
<strong>with</strong>in the public sec<strong>to</strong>r. Again, any weaknesses will classify the sub-criterion as being partially met.<br />
E. Which style <strong>of</strong> implementation does the approach apply? 85 Top-down (C11), bot<strong>to</strong>m-up (C12)<br />
Ideally, any approach should incorporate both a <strong>to</strong>p-down and bot<strong>to</strong>m-up approach (Interview Partner<br />
C). The sub-criterion <strong>to</strong>p-down has been captured if a conservation project originated at a national or<br />
international level and then focused on a local level. This can refer <strong>to</strong> two different aspects. Firstly, it<br />
may mean the enforcement <strong>of</strong> a project by a government or intergovernmental institution on the local<br />
level. However, it can also refer <strong>to</strong> international indices, criteria, thresholds or data being incorporated<br />
in<strong>to</strong> implementation. One <strong>of</strong> these aspects is sufficient for the sub-criterion <strong>to</strong> be addressed fully.<br />
Nevertheless, any identifies weaknesses for one <strong>of</strong> these aspects result in the sub-criterion being<br />
partially met. In contrast, the sub-criterion bot<strong>to</strong>m-up has been captured if a conservation project<br />
originates at the local level through the involvement <strong>of</strong> local stakeholders and through the<br />
establishment <strong>of</strong> user groups. In addition, indices, criteria, thresholds or data determined at a local<br />
level, <strong>with</strong> the subsequent adoption at a national or international level, is also sufficient for this subcriterion<br />
<strong>to</strong> have been met fully. Again, if any weakness exists the sub-criterion will only be partially<br />
addressed.<br />
F. For whom is the approach suitable? International experts (C13), national experts (C14), local<br />
user groups (C15)<br />
Ideally an approach employs a wide range <strong>of</strong> practitioners, confirming the user friendliness and<br />
practicality <strong>of</strong> the approach, thus ensuring a broader range <strong>of</strong> implementation (Interview Partner K).<br />
The sub-criteria should determine which users are able <strong>to</strong> implement an approach. This thesis has<br />
specified that a balance <strong>of</strong> international and national experts, as well as local user groups, would be<br />
best <strong>to</strong> ensure wide application and successful implementation (i.e. <strong>to</strong>p down and bot<strong>to</strong>m up). National<br />
experts are essential for the implementation <strong>of</strong> any approach, as they ensure a high level <strong>of</strong> rigour and<br />
indicate that the approach is based on best understanding <strong>of</strong> conservation science (Interview Partner<br />
K). If only a few highly skilled experts (i.e. international experts) are able <strong>to</strong> use the approach, this<br />
shows it <strong>to</strong> be not only archaic, as the trend is moving away from relying purely on international<br />
experts, but also complex and generally aligned <strong>with</strong> high cost. Thus, the sole use <strong>of</strong> international<br />
experts results in limited impact and utility and less effectiveness (Interview Partner K). The inclusion<br />
<strong>of</strong> local user groups in the process encourages ownership and therefore also implementation success<br />
at the local level (Interview Partner M). However, this purely bot<strong>to</strong>m-up approach may lack credibility<br />
at a regional or global scale (Interview Partner O). An approach is classified as strong, if an even<br />
A1<br />
85 For a more accurate result, criterion E should have rather been divided in<strong>to</strong> two criteria, separating<br />
the governance aspect <strong>of</strong> <strong>to</strong>p-down and bot<strong>to</strong>m-up from the data aspect.<br />
124
APPENDIX<br />
spread <strong>of</strong> national and international experts work <strong>to</strong>gether <strong>with</strong> local user groups. In contrast, it is<br />
classified as weak if national experts are not included in the identification phase.<br />
G. Which methods were employed for site choice? Site visits (C15), surveys (C16), additional<br />
methods (C17)<br />
In order <strong>to</strong> determine the appropriate site for conservation action, biodiversity needs <strong>to</strong> be evaluated<br />
(Hill et al. 2005, 65). The exact methodology implemented will change according <strong>to</strong> the goal and the<br />
available resources. For instance, if an approach aims <strong>to</strong> gain political support, stakeholder and expert<br />
surveys would be sufficient. These methodologies require less time and finance than, for example,<br />
detailed inven<strong>to</strong>ries as part <strong>of</strong> site visits. In contrast, for university support, long term inven<strong>to</strong>ries would<br />
be required. Furthermore, resources, such as personnel, cost, time and available data, will all dictate<br />
the choice <strong>of</strong> methodology for site identification (Interview Partner L). For an approach <strong>to</strong> have<br />
implementation success, stakeholder involvement, for example through surveys, is essential<br />
(Interview Partner M). Expert surveys have been included in this sub-criterion, since it is assumed that<br />
experts <strong>with</strong> knowledge <strong>of</strong> a given area will have a direct or indirect interest in the use and<br />
management <strong>of</strong> some aspect <strong>of</strong> its biodiversity (see General Terms). Where time is <strong>of</strong> an essence, a<br />
rapid assessment may be the preferred choice, however, high financial resources may be required<br />
(Interview Partner I). Since the available resources and the objective <strong>of</strong> the approach will dictate the<br />
choice <strong>of</strong> methodology for site identification (CBD 2005, 11), this thesis has firstly established a list <strong>of</strong><br />
differences between, and strengths and weaknesses <strong>of</strong> <strong>approaches</strong> in their choice <strong>of</strong> methods, but<br />
does not establish precise implementation rigour there<strong>of</strong>. Secondly, it has determined that a broad<br />
range <strong>of</strong> applicable methods, endows flexibility and versatility on<strong>to</strong> the approach.<br />
H. Which resources are required for identification <strong>of</strong> important <strong>areas</strong> for biodiversity<br />
conservation? Financial resources (C18), human resources (C19), required time (C20)<br />
Ideally, the required financial and human resources and the time needed for project implementation<br />
should be kept <strong>to</strong> a minimum, <strong>with</strong>out compromising the quality <strong>of</strong> the outcome. However the financial<br />
resources available will dictate the amount <strong>of</strong> time and the personnel one has at one's disposal.<br />
Additionally, available experts will alter the cost and time required for any project. For example, in the<br />
absence <strong>of</strong> national experts, international experts will be needed, thus, further increasing personnel<br />
costs. Moreover, other aspects such as the goal and size <strong>of</strong> the project, available data, use <strong>of</strong> remote<br />
sensing imagery and so on, will alter all three sub-criteria (Stewart 2009, 11). Therefore, this thesis<br />
aims <strong>to</strong> <strong>identify</strong> and list the differences in financial, human and time resources that may be required by<br />
the different <strong>approaches</strong>, in order <strong>to</strong> provide an overview <strong>of</strong> these sub-criteria.<br />
I. Which data is required for the identification <strong>of</strong> important <strong>areas</strong>? Use <strong>of</strong> existing data (C21),<br />
data acquisition (C22), data validation (C23), use <strong>of</strong> remote sensing (C24)<br />
Data requirements will foremost depend on the objective <strong>of</strong> the approach (Interview Partner L). In<br />
addition, the methodology <strong>of</strong> data acquisition and validation will depend on the urgency <strong>of</strong> the project,<br />
the availability and validity <strong>of</strong> existing data, the available resources (i.e. time, money and personnel)<br />
and the size <strong>of</strong> the project (Stewart 2009, 11, 12). Furthermore, the latter two fac<strong>to</strong>rs (resources and<br />
project size) will also dictate the use and extent <strong>of</strong> remote sensing technology (Hill et al. 2005, 155,<br />
156, 167). Therefore, this thesis aims <strong>to</strong> <strong>identify</strong> all sources that an approach may utilize and will not<br />
evaluate the exact procedure <strong>of</strong> implementing and obtaining data.<br />
125
J. Is a scoping assessment possible? Required resources (C26), required time (C27)<br />
A scoping assessment aims <strong>to</strong> <strong>identify</strong> existing data, data gaps needing <strong>to</strong> be filled (Stewart et al.<br />
2008, 8, 11), the assessment team required, the cost <strong>of</strong> the assessment (Dinerstein et al. 2000, 55;<br />
Groves et al. 2000, 2-1) and where, when and <strong>with</strong> whom field surveys are going <strong>to</strong> take place<br />
(Stewart et al. 2008, 15, 19). Thus, the sub-criteria have been addressed fully if the approach has<br />
been designed so that the required resources (data, personnel and cost) and the time needed <strong>to</strong><br />
complete implementation are identified during the scoping assessment. The required resources subcriterion<br />
has been partially addressed if two <strong>of</strong> the three aspects (eg. cost and data or personnel and<br />
data) have been addressed.<br />
K. Which threats are considered? What is their severity? Internal (C28), external (C29)<br />
Understanding threats, both internal and external, <strong>to</strong> a given area is critical in <strong>identify</strong>ing biodiversity<br />
relevant <strong>areas</strong> <strong>to</strong> be set-aside (Stewart et al. 2008, 31). These threats should then be ranked<br />
according <strong>to</strong> their severity. Thus, allowing conservation <strong>areas</strong> <strong>to</strong> be prioritised <strong>with</strong> regard <strong>to</strong> their<br />
ecological cost (Interview Partner J).<br />
L. Is guidance for appropriate moni<strong>to</strong>ring steps provided? Moni<strong>to</strong>ring recommendations (C30)<br />
The approach is considered strong if moni<strong>to</strong>ring recommendations are made at the end <strong>of</strong> the<br />
identification stage. These recommendations may include moni<strong>to</strong>ring activities such as social and<br />
biological surveys, as well as direct and indirect observation <strong>of</strong> indica<strong>to</strong>rs which should involve<br />
detailed data collection over the long term. Data should be analysed, reported and acted upon<br />
(Stewart et al. 2008, 37-39). This will determine whether the goals or the objectives <strong>of</strong> management<br />
have been, or are being, met.<br />
A1<br />
M. Is guidance for appropriate management steps provided? Management recommendations<br />
(C31)<br />
The approach is considered strong if management recommendations are made at the end <strong>of</strong> the<br />
identification stage. These should include the goals or objectives <strong>of</strong> the conservation project and ways<br />
<strong>of</strong> achieving them. The management recommendations may include proposals <strong>to</strong> maintain, res<strong>to</strong>re or<br />
enhance values, depending on what is required (Stewart et al. 2008, 31).<br />
N. How many different species are conserved? What is their status? Amount (C32), threat<br />
status (C33), irreplaceability (C34), sensitivity or <strong>to</strong>lerance <strong>to</strong> a threat (C35)<br />
To answer such questions and <strong>to</strong> evaluate the achievements <strong>of</strong> the approach’s objectives, moni<strong>to</strong>ring<br />
information based on reliable science would be highly desirable. However, due <strong>to</strong> the limited<br />
resources allocated <strong>to</strong> biodiversity conservation, this key question has not been addressed by any<br />
project using one <strong>of</strong> the chosen <strong>approaches</strong> for site identification (Interview Partners D, E and O). The<br />
eventual results <strong>of</strong> any approach will be entirely dependent on the goal and the region <strong>of</strong><br />
implementation (Interview Partner E). Furthermore the effectiveness (see General Terms) <strong>of</strong> an<br />
approach needs <strong>to</strong> be taken <strong>to</strong> the landscape level, in order <strong>to</strong> establish global results in terms <strong>of</strong><br />
biodiversity (Interview Partner K). Thus, considering the number <strong>of</strong> species is not really an appropriate<br />
measure <strong>of</strong> effectiveness, one should rather look at the project’s objective and from there determine<br />
whether the values are still present and whether management changes have been implemented<br />
(Interview Partner G and O). Specifically chosen indica<strong>to</strong>rs could be used <strong>to</strong> measure the<br />
effectiveness <strong>of</strong> an approach. These include threat abatement, increase in suitable habitat and/ or<br />
res<strong>to</strong>ration <strong>of</strong> natural habitat (Interview Partner O). As this is extremely difficult <strong>to</strong> assess and has not<br />
been done by any <strong>of</strong> the <strong>approaches</strong> (Interview Partner O), this thesis will not be able <strong>to</strong> discuss this<br />
point any further.<br />
126
APPENDIX<br />
O. How large is the protected area (PA)? Is this area connected <strong>to</strong> other PAs? Size (C36), state<br />
or naturalness (37), connectivity <strong>to</strong> other PAs (C38), representativeness (C39)<br />
The design <strong>of</strong> PAs is dependent on size, shape and boundaries. Information from the assessment <strong>of</strong><br />
reserve design can be used <strong>to</strong> <strong>identify</strong> ways <strong>to</strong> improve management effectiveness (Hockings et al.<br />
2006, 14). Thus, by understanding reserve design, biodiversity conservation can be optimised. The<br />
size <strong>of</strong> a PA will determine the viability or likelihood <strong>of</strong> long-term survival <strong>of</strong> many species, e<strong>special</strong>ly<br />
those that require large home ranges. Additionally, the shape <strong>of</strong> any PA is important, as a set-aside<br />
area <strong>with</strong> a lower boundary <strong>to</strong> area ratio is less exposed <strong>to</strong> edge effects. However, the integrity <strong>of</strong> a<br />
reserve and its insulation from outside influences depends not only on its size and shape, but also on<br />
the nature <strong>of</strong> the boundaries. PAs should not be seen as isolated entities, but rather be part <strong>of</strong> the<br />
broader conservation landscape (Hill et al. 2005, 85), as conservation goals will not be achieved<br />
through a single set-aside area or a single population. Rather, populations scattered across<br />
landscapes and connected by movement will be optimal. Maintaining connectivity is one <strong>of</strong> the most<br />
critical aspects <strong>of</strong> multiple species conservation (Millspaugh and Thompson 2008, 64). Since this is<br />
extremely difficult <strong>to</strong> measure and has not been done by any <strong>of</strong> the assessed <strong>approaches</strong> (Interview<br />
Partners D, E and O), this measure <strong>of</strong> effectiveness will not be addressed further in this thesis.<br />
127
A2<br />
A2<br />
Semi-structured Interview Guideline<br />
0 Background information:<br />
1. Detailed information <strong>to</strong> the interview can be found in the separate thesis outline.<br />
2. Depending on your area <strong>of</strong> expertise, certain questions will not be relevant and, therefore, will not<br />
have <strong>to</strong> be answered.<br />
3. The <strong>approaches</strong> relevant <strong>to</strong> the interview are as follows:<br />
HCV: High Conservation Value<br />
KBA: Key Biodiversity Areas<br />
ERBC: Ecoregion-based Conservation<br />
FSA: Focal Species Approach<br />
REA: Rapid Ecological <strong>Assessment</strong><br />
I<br />
Pr<strong>of</strong>essional background & relation <strong>to</strong> <strong>to</strong>pic<br />
• Name:<br />
• Do you have any questions <strong>to</strong> the purpose <strong>of</strong> this interview?<br />
• What is your current position?<br />
Since when have you worked for the organisation?<br />
What is your area <strong>of</strong> expertise?<br />
• Have you ever been involved in the process <strong>of</strong> <strong>identify</strong>ing <strong>areas</strong> important for biodiversity<br />
conservation?<br />
• If yes, in which regions have you worked so far?<br />
II<br />
Approaches & their characteristics<br />
• Which <strong>approaches</strong> used <strong>to</strong> <strong>identify</strong> <strong>areas</strong> relevant <strong>to</strong> biodiversity conservation do you know?<br />
• Can you describe any strengths or weaknesses for these <strong>approaches</strong>?<br />
Note: please consider the <strong>approaches</strong> relevant <strong>to</strong> this thesis<br />
• Are there other <strong>approaches</strong> that, in your opinion, may be important for <strong>identify</strong>ing <strong>areas</strong> <strong>of</strong> high<br />
biodiversity?<br />
• With regard <strong>to</strong> the criteria, can you think <strong>of</strong> any other criteria which may be important for comparing<br />
methods used <strong>to</strong> <strong>identify</strong> biodiversity relevant <strong>areas</strong>?<br />
• How would you measure the efficiency <strong>of</strong> the <strong>approaches</strong>?<br />
eg. cost; time required; benefit:cost ratio; any other<br />
• Do you have any recommendations/ ideas on how <strong>to</strong> improve the efficiency <strong>of</strong> the <strong>approaches</strong>?<br />
128
APPENDIX<br />
III<br />
Approaches & their requirements<br />
Note: The following questions predominantly serve <strong>to</strong> estimate the efficiency <strong>of</strong> the <strong>approaches</strong><br />
HCV; KBA; ERBC; Focal; REA. If you only have knowledge on one or some <strong>of</strong> the <strong>approaches</strong>,<br />
please answer the relating questions. Estimated values will be sufficient.<br />
A. Time:<br />
• How much time is required for implementing the <strong>approaches</strong>?<br />
eg. HCV; KBA; ERBC; Focal; REA or any others<br />
If possible, please state whether these figures are for the entire process or the identification<br />
phase only.<br />
• Should efforts rather concentrate on existing biodiversity conservation initiates?<br />
• Can the required time be reduced <strong>with</strong>out compromising the efficiency? Do you have any ideas<br />
on this?<br />
B. Cost:<br />
• How much does the implementation <strong>of</strong> the <strong>approaches</strong> cost?<br />
If possible, please state whether these figures are for the entire process or the identification<br />
phase only.<br />
• How could this amount be reduced <strong>with</strong>out compromising the efficiency? Do you have any ideas<br />
on this?<br />
C. Human Resources:<br />
• Which human resources are required for implementing the <strong>approaches</strong>?<br />
eg. international experts; national experts; local experts; non-<strong>special</strong>ist users <strong>with</strong> or <strong>with</strong>out<br />
training<br />
If possible, please state whether these figures are for the entire process or the identification<br />
phase only.<br />
• How could the required human resources best be decreased? Do you have any ideas on this?<br />
D. Data requirements:<br />
• How is data collection designed (easy/ complex)?<br />
eg. use <strong>of</strong> existing data; data acquisition; validation; use <strong>of</strong> remote sensing<br />
• Can the required data easily be used by non-<strong>special</strong>ist users?<br />
• How (easy/ complex) can the collected data be unders<strong>to</strong>od?<br />
E. Purpose <strong>of</strong> the approach:<br />
• How efficient is the approach for the conservation <strong>of</strong> biodiversity?<br />
For species:<br />
How many species on average are conserved?<br />
Can these estimations be used for a global comparison?<br />
For protected <strong>areas</strong>:<br />
What is the ideal reserve size? How would you best protect the naturalness <strong>of</strong> the identified<br />
area?<br />
129
A2<br />
F. Certification:<br />
• How do market based initiatives fare in biodiversity conservation?<br />
eg. efficiency; in comparison <strong>to</strong> governance <strong>approaches</strong><br />
• Are market based initiates efficient in biodiversity conservation?<br />
• How do they compare <strong>to</strong> classical protected <strong>areas</strong>?<br />
IV<br />
Summary, evaluation & outlook<br />
• How meaningful can <strong>approaches</strong> for <strong>identify</strong>ing valuable biodiversity regions be for biodiversity<br />
conservation at all?<br />
• Should efforts rather concentrate on existing biodiversity conservation initiates?<br />
eg. improving reserve design; improving connectivity; the "SLOSS debate": whether a Single<br />
Large or Several Small reserves are best for conservation?<br />
• Are there any current debates going on in your organisation on this <strong>to</strong>pic?<br />
• What is your personal opinion?<br />
• Are there any further points you would wish <strong>to</strong> add?<br />
• Could you recommend any further experts whom I could ask for an interview?<br />
eg. companies from the private sec<strong>to</strong>r<br />
130
APPENDIX<br />
A3<br />
List <strong>of</strong> Interview Partners<br />
Table 16: List <strong>of</strong> all interview partners and their organisations/ companies<br />
Name<br />
Organisation<br />
1. Dr. Brooks, Tom Conservation International<br />
2. Hayward, Jeff The Rainforest Alliance<br />
3. Dr. Hess, George<br />
4. Killeen, Timothey Conservation International<br />
5. Laporte, Jérôme TEREA Consulting<br />
6. Liedecker, Heiko Leading Standards Consulting<br />
7. Marshall, Rob The Nature Conservancy<br />
8. Moore, Jim The Nature Conservancy<br />
9. Nolte, Chris<strong>to</strong>ph University <strong>of</strong> Greifswald<br />
10. Pollard, Edward Wildlife Conservation Society<br />
11. Rayden, Tim Pr<strong>of</strong>orest<br />
12. Dr. Stewart, Chris<strong>to</strong>pher HCV Resource Network<br />
13. Vicariu, Kim Wildlands Network<br />
14. Wensing, Daan IUCN National Committee, NT<br />
Source: Own design<br />
NC State University; Department <strong>of</strong> Forestry & Environmental<br />
Resources<br />
131
A4-INTERVIEW PARTNER A<br />
A4<br />
Interview Reports<br />
A4-1 Interview Partner A<br />
II<br />
Approaches & their characteristics<br />
• Which <strong>approaches</strong> used <strong>to</strong> <strong>identify</strong> biodiversity relevant <strong>areas</strong> do you know?<br />
I am a practitioner in natural resource management and not a biologist <strong>with</strong> expert knowledge on<br />
specific species or taxa who, for instance, has been trained in implementing KBA. I analyse<br />
various <strong>approaches</strong> <strong>with</strong> respect <strong>to</strong> their relevance and how they can be implemented.<br />
The issue is presented <strong>to</strong> me somewhat differently. On the one hand, we already support large<br />
protected <strong>areas</strong>. The decision whether they are important from a biodiversity aspect has,<br />
therefore, already been made. On the other hand, the question, which <strong>areas</strong> should be protected<br />
for biodiversity conservation, arises in two different categories.<br />
The first category is again biodiversity in protected <strong>areas</strong>. When the 'Programme <strong>of</strong> Work' by the<br />
CBD was approved in 2004, a gap analysis formed an important element <strong>of</strong> the program. In other<br />
words, we dealt <strong>with</strong> the question <strong>of</strong> whether a representative system <strong>of</strong> protected <strong>areas</strong> exist or<br />
not, if not then proposals where developed <strong>to</strong> close these “gaps”. This analysis mostly follows the<br />
IUCN or TNC guidelines. Many NGOs, including Conservation International, Birdlife International,<br />
IUCN und UNEP <strong>with</strong> their Bird Conservation Moni<strong>to</strong>ring Set-Up have developed the Integrated<br />
Biodiversity <strong>Assessment</strong> Tool (IBAT). We are not much involved in the methodologies behind a<br />
GAP analysis, as they are implemented for national protected area systems.<br />
In the past, focus was on biodiversity <strong>with</strong>in protected <strong>areas</strong>. However, the second category,<br />
previously neglected, is biodiversity conservation outside <strong>of</strong> protected <strong>areas</strong>. This predominantly<br />
applies <strong>to</strong> forestry and agriculture <strong>with</strong> respect <strong>to</strong> issues <strong>of</strong> land-use. Here, a backlog still exists<br />
where <strong>areas</strong> important for biodiversity conservation still need <strong>to</strong> be identified in order <strong>to</strong><br />
additionally conserve biodiversity. In this category <strong>of</strong> sustainable forestry and/ or agriculture, as<br />
well as land-use classification systems, one needs <strong>to</strong> deal <strong>with</strong> criteria on a management level,<br />
as is the case <strong>of</strong> the HCV concept.<br />
KBA are identified on a national level. When working on a management level one is far closer <strong>to</strong><br />
the object <strong>of</strong> interest thus, additional classifications may be required.<br />
The ERBC is far more a macro-level approach.<br />
I have never heard <strong>of</strong> FSA. We have never worked <strong>with</strong> this approach.<br />
REAs are extremely elaborate and complex. They are called rapid, even though, the criteria are<br />
very difficult <strong>to</strong> analyse. A <strong>to</strong>ol becomes complex when it follows a multidisciplinary approach,<br />
e<strong>special</strong>ly at a management level. For example, people responsible for management plans in the<br />
ministry <strong>of</strong> forestry have a certain amount <strong>of</strong> biological know-how. However, due <strong>to</strong> the pressure<br />
under which these management plans are produced, it is difficult <strong>to</strong> look in<strong>to</strong> the various criteria<br />
required for an REA.<br />
• Will this problem be the same for the HCV concept?<br />
Yes, but a few <strong>of</strong> the HCV criteria are relatively easy <strong>to</strong> address. For instance, <strong>areas</strong> fundamental<br />
in meeting the needs <strong>of</strong> local communities are easily identified by speaking <strong>to</strong> the people. For<br />
this, one need not be a biologist.<br />
These <strong>areas</strong> which are important in terms <strong>of</strong> biodiversity are also either under specific protection<br />
or are <strong>of</strong> <strong>special</strong> interest. In the case <strong>of</strong> timber production, these <strong>areas</strong> are <strong>of</strong>ten also <strong>areas</strong> <strong>of</strong><br />
conflict. At the same time, one is still forced <strong>to</strong> map <strong>areas</strong> due <strong>to</strong> their fragility, such as wetlands<br />
(as logging is <strong>to</strong>o difficult/ damaging in these ecosystems), <strong>areas</strong> <strong>with</strong> steep slopes (as<br />
technology is unable <strong>to</strong> log and erosion risks are high) and certain requirements regarding entire<br />
water courses (<strong>to</strong> protect corridors along river banks). Thus, leading <strong>to</strong> the exclusion <strong>of</strong> <strong>areas</strong><br />
132
APPENDIX<br />
which can quite possibly reach a size <strong>of</strong> 20% <strong>of</strong> a concession. Of course, for all methods<br />
identification requires the input <strong>of</strong> biologists and <strong>special</strong>ists. Ideally enough orientation would be<br />
available, so that in a normal management situation the experts employed would be sufficient <strong>to</strong><br />
exclude <strong>areas</strong> from production.<br />
Land-use planning may also require the input <strong>of</strong> biologists. This is the case in Germany, but not<br />
necessarily a requirement in other countries. The use <strong>of</strong> biologists in land-use planning or spatial<br />
planning will depend on the authorities <strong>of</strong> the country in question and the specific regulations.<br />
Additionally, the question arises whether specific <strong>special</strong>ists are available or not. The approach<br />
here is about practicality.<br />
The important aspect is <strong>to</strong> be sure <strong>of</strong> the objectives for which the method is being implemented.<br />
Is the goal <strong>to</strong> <strong>identify</strong> <strong>areas</strong> under legal protection (i.e. national parks, this would involve<br />
extensive <strong>areas</strong>)? Or is the goal <strong>to</strong> conserve biodiversity in <strong>areas</strong> under sustainable use, such as<br />
forestry or agriculture? The HCV concept has arisen from the HCV forest concept (HCVF). The<br />
focus was on sustainable forestry and the general phrasing <strong>of</strong> 'Value' emerged, as one wanted <strong>to</strong><br />
expand this method for use in other <strong>areas</strong> under alternate land-usage, particularly <strong>with</strong> regard <strong>to</strong><br />
guidelines for agricultural land-use changes. Thus, the HCV concept is important <strong>with</strong> regards <strong>to</strong><br />
sustainable palm oil certification.<br />
We have had the most contact <strong>to</strong> the HCV concept in this context. The principles that succeed,<br />
such as water protection management, limiting landscape conversions and, most importantly, the<br />
debate between different local interest groups. With this in view, one should ask: Which <strong>special</strong><br />
biodiversity aspects should be considered? If <strong>areas</strong> <strong>with</strong> <strong>special</strong> values have not already been<br />
identified, at least at a national level, this is very unlikely <strong>to</strong> occur on a lower level where the<br />
focus is more on ecosystem services than biodiversity itself.<br />
• But this has already been done on a macro scale.<br />
One must always look <strong>to</strong> see whether these <strong>approaches</strong> have indeed been conducted. For<br />
example, one could then discover that 20% <strong>of</strong> the country's terri<strong>to</strong>ry had already been set aside<br />
for conservation and legally gazetted. Possibly, a GAP analysis had been performed <strong>with</strong> the<br />
outcome that specific ecosystem types were under represented. Therefore, further establishment<br />
<strong>of</strong> protected <strong>areas</strong> would be required. This however, does not necessarily mean that these<br />
additional processes were actually implemented (i.e. the establishment <strong>of</strong> further protected<br />
<strong>areas</strong>). This means that the high percentage <strong>of</strong> protected area in a given country would have <strong>to</strong><br />
be increased further, which given the pressure from an increasing population and demand for<br />
agricultural lands, would be impossible <strong>to</strong> realise. Thus, the question arises how far one<br />
integrates the GAP analysis recommendations in<strong>to</strong> an agriculture setting, <strong>with</strong>out setting aside<br />
still more strictly protected <strong>areas</strong>, according <strong>to</strong> the IUCN designation.<br />
It may be <strong>of</strong> interest <strong>to</strong> produce a process diagram <strong>of</strong> the different, useful implementation options<br />
for the various <strong>approaches</strong>. A country that has already set aside 20% <strong>of</strong> its terri<strong>to</strong>ry, according <strong>to</strong><br />
specific conservation categories, need not have identified these according <strong>to</strong> biodiversity values<br />
but for other reasons.<br />
Certain components <strong>of</strong> protected area systems are important at the global level, for example,<br />
Biospheres and World Heritage Sites. In contrast, many protected <strong>areas</strong> were established as<br />
they were the last remaining large intact ecosystems and this was only because they were<br />
subjected <strong>to</strong> the least settlement pressure or threat. This could result in a relatively large area<br />
being set aside, despite methods for <strong>identify</strong>ing and evaluating biodiversity having had nothing <strong>to</strong><br />
do <strong>with</strong> the identification.<br />
A biologist addresses the question differently. They focus on a specific outcome and the<br />
corresponding methodology. From my point <strong>of</strong> view, each <strong>of</strong> these methods is qualified. I would<br />
look <strong>to</strong> see which method has an acceptable level <strong>of</strong> input and the best result, possibly which<br />
method includes most experience <strong>with</strong> it or whether useful results have already been obtained.<br />
One very rarely finds a situation where one can start from scratch. For example, one has a<br />
handful <strong>of</strong> methods or instruments <strong>to</strong> choose from. Here one would be able <strong>to</strong> decide which<br />
133
A4-INTERVIEW PARTNER A<br />
method would deliver the best outcome. But rather, one arrives at a situation where something<br />
already exists and someone in the area or close by is already working on it. This person may<br />
already be in the process <strong>of</strong> mapping the area and working <strong>with</strong> a particular method, because<br />
they work for a specific organisation. And as I am glad that someone is already doing the work, I<br />
certainly will not start discussing their choice <strong>of</strong> methodology.<br />
As an example, some organisations which work well from a science point <strong>of</strong> view are:<br />
Conservation International regarding issues related <strong>to</strong> protected <strong>areas</strong>. They work <strong>with</strong> the KBA<br />
approach. If they have worked <strong>with</strong> this approach and submitted their results or outcomes, then I<br />
would definitely not tell them that they should rather have performed a REA.<br />
One is able <strong>to</strong> rank the methods according <strong>to</strong> scientific criteria <strong>with</strong> an end result that one <strong>of</strong> the<br />
methods is best. However, different criteria play an important role in which method should<br />
ultimately be implemented for various biodiversity aspects.<br />
This thesis is <strong>of</strong> interest from the aspect that the differences between various <strong>approaches</strong> are<br />
being investigated and what they can achieve and where they can be used. Thus, resulting in a<br />
ranking <strong>of</strong> the <strong>approaches</strong> <strong>with</strong> practitioners then being able <strong>to</strong> say why they chose a specific<br />
method, as the advantages and disadvantages are openly known. Possibly, one can also<br />
determine what cannot be achieved by these methods. However, it is <strong>of</strong>ten not possible <strong>to</strong><br />
choose completely free a method.<br />
National GAP analyses (funded through the adoption <strong>of</strong> the CBD 'Programme <strong>of</strong> Work') were<br />
performed in many countries by TNC. Thus, the location <strong>of</strong> existing protected <strong>areas</strong> was<br />
established and where additional <strong>areas</strong>, required for representation and minimal connectivity,<br />
should be. Connectivity plays an extremely important role in conservation planning. Alternative<br />
possibilities, other than the strict IUCN protected area categories (I-IV), allow for <strong>areas</strong> <strong>to</strong> remain<br />
intact, for instance, the sustainable use <strong>of</strong> an area. However, in line <strong>with</strong> a national protected<br />
area system, connectivity is <strong>of</strong> utmost <strong>importance</strong>. Particularly in view <strong>of</strong> adaptation <strong>to</strong> climate<br />
change, key protected <strong>areas</strong> exist which, under careful consideration, should be linked both<br />
horizontally and vertically. Again, further <strong>areas</strong> <strong>with</strong> a specific function (watershed protection)<br />
should also be set aside. These additional <strong>areas</strong>, need not necessarily have high biodiversity<br />
values, but have rather been selected due <strong>to</strong> their high level <strong>of</strong> intactness, thus enabling the<br />
formation <strong>of</strong> corridors for the movement <strong>of</strong> specific species.<br />
• Do the achievements <strong>of</strong> these methods relate <strong>to</strong> their efficiency?<br />
Yes, what the method achieves and which results one can obtain <strong>with</strong>in a specific time frame are<br />
related. How great is the effort that one must put in <strong>to</strong> get a specific outcome?<br />
The outcome <strong>of</strong> methods can also be ranked. I would look at both, the outcome weighed against<br />
the costs and effort.<br />
134
APPENDIX<br />
A4-2 Interview Partner B<br />
II<br />
Approaches & their characteristics<br />
• How would you measure the efficiency <strong>of</strong> <strong>approaches</strong> used <strong>to</strong> <strong>identify</strong> biodiversity relevant<br />
<strong>areas</strong>?<br />
Different organisations use many different <strong>approaches</strong>. The implementation <strong>of</strong> these <strong>approaches</strong><br />
is extremely interesting. However, in terms <strong>of</strong> their efficiency, no reliable data exists in the<br />
literature. It is easy <strong>to</strong> <strong>identify</strong> <strong>areas</strong> based on species, but then the approach might be hindered<br />
in the implementation phase. Organisations shy away from spending money for day <strong>to</strong> day<br />
management. In other words, incentives are only available <strong>to</strong> spend money on information<br />
management and not on management strategies. The <strong>areas</strong> <strong>of</strong> interest for biodiversity are<br />
predominantly already known. It is far more important <strong>to</strong> manage these <strong>areas</strong> more efficiently (in<br />
terms <strong>of</strong> moni<strong>to</strong>ring, law enforcement and so on). Unfortunately this is rarely the case. The<br />
efficient management <strong>of</strong> protected <strong>areas</strong> <strong>of</strong>ten leads <strong>to</strong> conflicts (e<strong>special</strong>ly due <strong>to</strong> stakeholders).<br />
Furthermore, identification and mapping is far easier <strong>to</strong> perform and <strong>to</strong> market.<br />
• How efficient is the evaluation?<br />
One looks at: how much did the project cost, how many hours <strong>of</strong> work were put in<strong>to</strong> the project<br />
and what did these cost?<br />
The end results <strong>of</strong> our evaluation: we focused on the social aspect <strong>of</strong> the management<br />
effectiveness and partially on the results which were not measured.<br />
Ideally, the results, for example, number <strong>of</strong> species or the goal <strong>of</strong> the approach, should be<br />
coupled <strong>to</strong> the management plan. In contrast, the Natura2000 report gave measurements on<br />
biological aspects, whereas effectiveness <strong>of</strong> protected area management was not considered.<br />
III Approaches & their requirements<br />
• F. Certification: Are market based initiatives efficient for biodiversity conservation? For<br />
example, in comparison <strong>to</strong> government based <strong>approaches</strong>.<br />
Many people act only due <strong>to</strong> initiatives and/ or laws. Strict nature conservation does not work,<br />
e<strong>special</strong>ly if people have <strong>to</strong> suffer or when there is no or little state support for conservation<br />
initiatives (i.e. international donors).<br />
135
A4-INTERVIEW PARTNER C<br />
A4-3 Interview Partner C<br />
II<br />
Approaches & their characteristics<br />
Which <strong>approaches</strong> do you know?<br />
There are many landscape <strong>approaches</strong>; KBA; IBAT; HCV; ERBC; AZE; Hotspots and many<br />
more.<br />
Have you worked <strong>with</strong> any <strong>of</strong> these?<br />
Yes, the HCV concept, <strong>with</strong> regard <strong>to</strong> conservation mapping.<br />
Could you list any strengths or weaknesses <strong>of</strong> the HCV concept?<br />
The strengths <strong>of</strong> this concept are: multi-stakeholder; it has support from both conservation and<br />
social NGOs; there is experience <strong>with</strong> it. It was developed in cooperation <strong>with</strong> the private sec<strong>to</strong>r<br />
and there is strong support for the concept from the public sec<strong>to</strong>r.<br />
The weaknesses: It can be a time consuming process and, as <strong>with</strong> all conservation mapping, it is<br />
very difficult <strong>to</strong> get all stakeholders involved in order <strong>to</strong> get their points across, thus, enabling<br />
them <strong>to</strong> be incorporated correctly in<strong>to</strong> the process. For the time being, there is not much<br />
experience in applying the concept <strong>to</strong> commodities, such as soy or sugarcane. Most experience<br />
<strong>with</strong> the concept has been made <strong>with</strong> forests.<br />
• Which criteria would be important for you, if you were <strong>to</strong> compare these <strong>approaches</strong>?<br />
Looking at the list you sent me: Point 1 is obviously very important. We focus on biodiversity<br />
conservation, although in an equitable manner.<br />
I would put an exclamation mark behind the business-management level point. We call this farm<br />
level and I think it is key if we want <strong>to</strong> involve companies and/ or producers. I'm thinking in terms<br />
<strong>of</strong> applying this concept specifically <strong>to</strong> commodity crops, such as soy, sugarcane, etc. Timber is<br />
also important, but my experience is <strong>with</strong> commodity crops. If one can't implement at the<br />
business-management level, then conservation planning will remain a bit vague and abstract.<br />
How is the approach implemented? There will always be a combination <strong>of</strong> bot<strong>to</strong>m-up and <strong>to</strong>pdown.<br />
Regarding the HCV concept, one <strong>of</strong> its strongest aspects is that all stakeholders are<br />
involved. So the decision on which <strong>areas</strong> can and cannot be used comes from <strong>with</strong>in each<br />
country. This is and always will be the only way <strong>to</strong> success. There is also a difference whether<br />
the <strong>to</strong>p-down decisions come from <strong>with</strong>in the country or some place else.<br />
Intended users should definitely also include governments and an international level, for<br />
example, CBD which uses conservation planning. It should go all the way from international <strong>to</strong><br />
farm level and back.<br />
Point 6: Which methods were employed for site choice? All <strong>of</strong> the criteria listed are important.<br />
You should also look at trends. For instance, the site we selected is right in an agricultural frontier<br />
zone. And this you can only determine when you look at the trends. For example, is there a lot <strong>of</strong><br />
deforestation going on? Are there new plantations being established? Etc. That really determines<br />
the exact location <strong>of</strong> the site. We do not look <strong>to</strong> see whether it is a hotspot <strong>of</strong> biodiversity, or<br />
anything similar. All we want <strong>to</strong> see is whether there is conflict in the area. An area <strong>with</strong> conflict is<br />
where you want conservation planning <strong>to</strong> kick in. One can also implement conservation planning<br />
in an area where nothing is happening, but one gets the most "Bang for your Buck" <strong>with</strong>in a<br />
conflict zone. Additionally, one needs <strong>to</strong> find a balance between regional development and<br />
conservation planning.<br />
Obviously financial and human resources play a big role. By human resources one means<br />
institutions that can actually carry out the work, but also institutions that have the right contact<br />
<strong>with</strong> the people in the area. People: meaning local communities, indigenous people, but also<br />
farmers. Institutional framework is a very important aspect <strong>with</strong> NGOs. We can do all the<br />
mapping we want, but you should have someone willing <strong>to</strong> use the map. Otherwise it will be just<br />
another map in a draw. Therefore it is very important for the people who want <strong>to</strong> use the map <strong>to</strong><br />
be involved from the beginning.<br />
136
APPENDIX<br />
Scoping assessments are possible. But they will just give you pointers. So, if you really want <strong>to</strong><br />
implement the concept, then it will not be sufficient.<br />
Moni<strong>to</strong>ring and management is part <strong>of</strong> the HCV concept. In the end, any conservation planning<br />
concept is meant <strong>to</strong> conserve biodiversity. In the case <strong>of</strong> HCV, it is biodiversity conservation,<br />
social aspects, etc. The map is only the beginning. You have <strong>to</strong> manage the area and you have<br />
<strong>to</strong> moni<strong>to</strong>r the area.<br />
• How would you best measure efficiency? Would you say the uptake <strong>of</strong> the HCV concept by<br />
governments, institutions and companies is one measure <strong>of</strong> efficiency?<br />
That would be one way. Companies can adopt the concept, but that does not mean anything will<br />
change. It has <strong>to</strong> be applied. For a concept <strong>to</strong> be effective, the identified area, values must<br />
indeed be maintained or enhanced. That is the efficiency you want <strong>to</strong> achieve. Yes, we definitely<br />
lobby <strong>with</strong> governments, institutions or companies <strong>to</strong> get the concept accepted. This being a very<br />
important and big step. It is about trying <strong>to</strong> find one another. But in the field, you need <strong>to</strong> measure<br />
what the real outcome is.<br />
• So you would go back and do field surveys, inven<strong>to</strong>ries, etc?<br />
If you go back in 5 years time and all the values are gone, then you did not achieve anything.<br />
• Do you think 5 years would be a realistic time frame <strong>to</strong> go back and measure efficiency in<br />
this way?<br />
Again it depends on the context <strong>of</strong> your mapping. Are you producing the map <strong>to</strong> feed in<strong>to</strong> a<br />
bigger process or are you mapping at farm-level? At farm level it would be a fairly easy process,<br />
<strong>to</strong> go back in 5 years and see if the <strong>areas</strong>, you previously identified, are still there. But if you feed<br />
them in<strong>to</strong> a larger process, then it becomes more difficult. So you should probably look at a more<br />
general scheme. Conservation is not really a clear-cut solution, there is not really one solution.<br />
III<br />
Approaches & their requirement<br />
• A. Time: You mentioned that the HCV may be a time consuming process. Could you give me<br />
an estimate <strong>of</strong> how long the approach takes <strong>to</strong> implement?<br />
This depends on the country or the region one works in. For instance, is there a lot <strong>of</strong> data readily<br />
available? What is the size <strong>of</strong> the area you are looking at? The project we worked on was 10 mill<br />
hectares large which takes quiet some time. But if you look at a smaller area you can complete<br />
the project faster. All in all, <strong>to</strong> map those 10 million hectares it <strong>to</strong>ok about 3 months. That is not a<br />
lot <strong>of</strong> time. But the thing <strong>with</strong> the HCV concept is that you always start at a higher resolution<br />
(getting data and determining which stakeholders should be involved) and then you zoom in. The<br />
first phase will take some time, but as soon as that has been done, it becomes easier or it takes<br />
less time <strong>to</strong> zoom in on a finer level. First you must start by gathering existing data which,<br />
depending on the region, may be easy. But then you need <strong>to</strong> validate the data by going in<strong>to</strong> the<br />
field.<br />
It also went quickly as there was a lot <strong>of</strong> data already available at the beginning <strong>of</strong> the project. In<br />
addition, the entire area was not mapped in much detail. This would have required far more time.<br />
Field sampling for both environmental and social data was performed, but not for the entire 10<br />
million hectares.<br />
HCV has <strong>to</strong> deal <strong>with</strong> both social and environmental issues. The social issues cannot be<br />
determined from existing data sets, satellite images, etc. One has <strong>to</strong> talk <strong>to</strong> people which will take<br />
some time.<br />
• B. Cost: What was the cost involved?<br />
The costs per hectare, I think are not <strong>to</strong>o high. But <strong>with</strong> every mapping exercise one needs<br />
financing <strong>to</strong> execute it.<br />
• Could you give me a rough estimate <strong>of</strong> how much the 10 million hectare project you worked<br />
on cost?<br />
137
A4-INTERVIEW PARTNER C<br />
It cost around 100,000€.<br />
• C. Human Resources: Would you say the HCV concept is human resource intensive?<br />
Yes. One needs knowledge; People trained in GIS, people that understand the socio-economic<br />
context, etc. So human resources are key <strong>to</strong> the end result.<br />
• D. Data requirements: Can non-expert users fulfil the data requirements?<br />
Again it depends on the project area. Some regions or countries have a lot <strong>of</strong> data publicly<br />
available. Some other <strong>areas</strong> do not. HCV combines all <strong>of</strong> the existing <strong>to</strong>ols. So one uses IBAT,<br />
KBA, Hotspots, Ecoregions, etc. Most <strong>of</strong> this data is available. This is the starting point and then<br />
you dig deeper which may be more difficult. But the project team consists <strong>of</strong> local individuals,<br />
know the area, know which data sets are and are not available. So they also know where <strong>to</strong><br />
obtain missing data. The project team is key. If you have the right experts, there is no problem.<br />
• Can data be collected by non-expert users?<br />
Yes, <strong>to</strong> a certain extent. Excellent initiatives around the globe exist where, for example,<br />
community members are given a GPS and map their own conservation <strong>areas</strong> or where they can<br />
just key in specific species they see. They can also indicate the use <strong>of</strong> the area. This is very<br />
valuable information.<br />
• Is this used a lot in implementing the HCV concept?<br />
For The HCV concept, I have not heard <strong>of</strong> it yet. But I have heard it being used in general for<br />
conservation planning. Not for any <strong>of</strong> the methods spoken about so far.<br />
• E. Purpose <strong>of</strong> the approach: How efficient is the concept in conserving biodiversity?<br />
We have only been involved <strong>with</strong> HCV over the past two years. Our first project is just about <strong>to</strong><br />
finish. So we have not been back <strong>to</strong> measure the effectiveness <strong>of</strong> the project. But it is definitely<br />
part <strong>of</strong> the plan. There are several levels <strong>of</strong> effectiveness. Promoting the HCV concept <strong>to</strong><br />
companies and governments<br />
Most people have a vague idea about conservation planning. But if one carries out a project and<br />
shows them what it is about, what it can actually achieve, then one can also change opinions.<br />
Our project achieved just that. It generated support <strong>with</strong> companies and politicians for HCV.<br />
• F. Certification: Do you think market based initiatives are more effective than governance<br />
based <strong>approaches</strong>?<br />
No, it is definitely the combination <strong>of</strong> the two. The distinction is a bit different. There are obviously<br />
protected <strong>areas</strong> at a federal level, state level, local level, etc. that already exist. If one takes<br />
certification schemes which are voluntary, such as RSPO, RTRS, BSI, etc they have criteria<br />
which need <strong>to</strong> be met. For example, the farmer cannot use a certain percentage <strong>of</strong> his land or<br />
must protect certain species, etc and also taking the landscape level in<strong>to</strong> account. That land is<br />
not legally protected, but the way forward would be <strong>to</strong> have this voluntary protection embedded in<br />
legislation. Or maybe, one could link it <strong>to</strong>, for example, <strong>to</strong> economic and ecological zoning, like<br />
what is happening in Brazil. As this will enforce methodology. A voluntary scheme can easily<br />
come up <strong>with</strong> sets <strong>of</strong> criteria, but <strong>with</strong> enforcement in place there will be a big difference, in the<br />
end obtaining more results which is what we are striving for.<br />
IV<br />
Summary, evaluation & outlook<br />
• Are there any current debates going on in your organisation on the HCV concept?<br />
Definitely. Together <strong>with</strong> other NGOs, institutions, we are talking about how <strong>to</strong> integrate different<br />
conservation planning <strong>approaches</strong>. The world is changing fast, nature is being lost. So we need<br />
<strong>to</strong> come up <strong>with</strong> practical solutions. Conservation planning must be in a context which allows for<br />
regional development and balances different stakes. Conserving biodiversity is never an isolated<br />
issue. The three P's: people, planet, pr<strong>of</strong>it.<br />
138
APPENDIX<br />
A3-4 Interview Partner D<br />
II<br />
Approaches & their characteristics<br />
• Which <strong>approaches</strong> do you know?<br />
I work extensively <strong>with</strong> the HCV approach which is a flexible framework that incorporates the use<br />
<strong>of</strong> a range <strong>of</strong> other methodologies. So I have had contact <strong>with</strong> some <strong>of</strong> the other methodologies,<br />
including KBA, FSA, REA.<br />
• Could you list any strengths or weaknesses <strong>of</strong> the methods you know?<br />
The HCV framework addresses biodiversity, as well as social aspects which are missing in the<br />
other <strong>approaches</strong>. This allows conservation planning strategies <strong>to</strong> include human needs - if these<br />
are not taken in<strong>to</strong> account, conservation efforts will run in<strong>to</strong> severe difficulties.<br />
It is also a flexible framework which can adopt appropriate existing initiatives and does not have a<br />
specific methodology that practitioners must follow. This may also be a weakness, as the strength<br />
<strong>of</strong> HCV also depends on the strength <strong>of</strong> the initiative it adopts, on the use <strong>of</strong> the precautionary<br />
principle, and on the recognition by users <strong>of</strong> gaps in understanding and knowledge.<br />
KBA approach: HCV1 is very similar or nearly identical <strong>to</strong> the KBA criteria. Both being about<br />
conservation <strong>of</strong> biodiversity.<br />
KBA concept has a lot <strong>of</strong> positive things going for it, including strong support for the initiative by<br />
leading NGOs (eg. IUCN, Birdlife International). It also has a mapping partner who has enabled<br />
local and or national level maps (KBA) for most <strong>of</strong> the globe <strong>to</strong> be produced.<br />
KBA maps are not always accurate. They are supposed <strong>to</strong> be relatively accurate for the local or<br />
provincial level priority <strong>areas</strong>, but in fact many less well described <strong>areas</strong> have insufficient data for<br />
good KBA mapping. Some KBA are based <strong>to</strong>o much on well known taxa e.g. birds. This lack <strong>of</strong><br />
detail causes difficulties for conservation planning. They sometimes do not reflect the truth on the<br />
ground, but rather just represent points on maps, lacking the detail needed for conservation<br />
planning. Thus, for conservation planning strategies in some <strong>areas</strong>, notably many tropical <strong>areas</strong>,<br />
KBA maps are not sufficient. One needs <strong>to</strong> go <strong>to</strong> another level <strong>of</strong> investigation.<br />
REA: This is a set <strong>of</strong> standardized <strong>to</strong>ols and is usually applied at a finer level. This approach can<br />
be adopted as an HCV assessment, but only addresses certain aspects. It does not address the<br />
full range <strong>of</strong> potential conservation values.<br />
Other assessment/prioritisation <strong>to</strong>ols address certain aspects <strong>of</strong> HCV and can be used by HCV,<br />
but they are not necessarily equivalent.<br />
• Which criteria would be important for you, if you were <strong>to</strong> compare these <strong>approaches</strong>?<br />
Looking at the list <strong>of</strong> criteria: Applications have been more concerned <strong>with</strong> species diversity than<br />
genetic diversity. This is not excluded by the methodology. It is rather that genetic diversity tends<br />
<strong>to</strong> have a lower pr<strong>of</strong>ile. We are also now focusing more on ecosystem diversity. A lot <strong>of</strong> the <strong>to</strong>ols<br />
developed specifically for HCV, address forests, their classifications and forest based values.<br />
HCV has also already been applied <strong>to</strong> grasslands and even coastal and marine <strong>areas</strong>. There is no<br />
reason why this flexible approach should not apply <strong>to</strong> other ecosystems. It is simply that some<br />
things are harder <strong>to</strong> measure for grasslands or aquatic systems. For instance, addressing the<br />
issue <strong>of</strong> high biodiversity grasslands is trickier than high biodiversity forests. Due <strong>to</strong> long standing<br />
interference <strong>of</strong> grasslands by humans (eg. burning), the management <strong>of</strong> them may be more<br />
critical. The HCV concept focuses on maintaining biodiversity and social values in a production<br />
landscape. Therefore, it has tended <strong>to</strong> be used at a site-management level, helping land<br />
managers <strong>to</strong> properly plan conservation strategies <strong>with</strong>in their sites. That is predominantly where<br />
most <strong>of</strong> the methodologies have been implemented, at a site-level. There is however another<br />
139
A4-INTERVIEW PARTNER D<br />
scale as well: mapping and understanding where values are at landscape level. We have started<br />
<strong>to</strong> work seriously on the landscape level, because one needs <strong>to</strong> make management decisions in<br />
the context <strong>of</strong> the wider landscape in order <strong>to</strong> help link up site-level decisions <strong>to</strong> landscape-level<br />
conservation priorities.<br />
Important criteria <strong>to</strong> compare <strong>approaches</strong> are:<br />
Who is the approach aimed at? What is the intention <strong>of</strong> the approach? Should this be for an<br />
academic audience or is it aimed at practical implementation by business and land use planners?<br />
What is the purpose <strong>of</strong> the approach? Is the aim <strong>of</strong> the approach <strong>to</strong> <strong>identify</strong> gaps in the protected<br />
area reserves <strong>to</strong> broaden the protected <strong>areas</strong> network? Or is the intention <strong>to</strong> address<br />
conservation <strong>with</strong>in production units/ production landscapes?<br />
Does the approach effectively include the range <strong>of</strong> stakeholders?<br />
Is the approach transparent?<br />
Does it have a defensible scientific basis?<br />
Is it proving genuinely effective in conserving biodiversity?<br />
• How would you measure the efficiency <strong>of</strong> <strong>approaches</strong> used <strong>to</strong> <strong>identify</strong> biodiversity relevant<br />
<strong>areas</strong>?<br />
One can get simple indica<strong>to</strong>rs: e.g. the number <strong>of</strong> projects using the approach, but this is an<br />
indica<strong>to</strong>r <strong>of</strong> ‘volume’ not quality. A better set <strong>of</strong> indica<strong>to</strong>rs would include a range <strong>of</strong> demonstrable<br />
conservation gains that have been reported from conservation projects using the specific<br />
approach. So one would do a survey <strong>of</strong> literature, and <strong>of</strong> conservation practitioners, <strong>to</strong> determine<br />
which <strong>approaches</strong> have played a key part in the decision making process. What is actually being<br />
used at what level?<br />
• Would you not take the time required or the cost <strong>of</strong> implementation in<strong>to</strong> account when<br />
measuring efficiency?<br />
Those do have an influence. It is very difficult <strong>to</strong> say which is better <strong>with</strong>out knowing ultimate goal<br />
<strong>of</strong> process. If one <strong>to</strong>ok a comparable REA, using REA and HCV on the same site, it would<br />
probably cost more and take longer <strong>to</strong> do an HCV assessment because one needs <strong>to</strong> consult <strong>with</strong><br />
local stakeholders, thus making it a more comprehensive assessment. There are various aspects<br />
<strong>of</strong> the HCV approach which are not necessarily part <strong>of</strong> a REA. But then the outcomes may well be<br />
different, as the social element is ignored. So perhaps resulting in a less effective <strong>to</strong>ol.<br />
III<br />
Approaches & their requirements<br />
• Time: Could you give me an estimate <strong>of</strong> how long the approach takes <strong>to</strong> implement?<br />
It depends where one are starting from. If one is starting from a blank slate, one has quite a bit <strong>of</strong><br />
work <strong>to</strong> do. Managers need <strong>to</strong> know what HCVs exist in their area i.e. it helps enormously <strong>to</strong> have a<br />
checklist <strong>of</strong> important ecosystems, species and social values which can be checked <strong>with</strong>in their site,<br />
and guidance on what <strong>to</strong> do if such HCVs are present. The ideal way <strong>to</strong> generate such a list is <strong>to</strong><br />
determine at a national or regional level what the HCVs are, based on stakeholder participation. One<br />
way <strong>of</strong> doing this from scratch is <strong>to</strong> convene an expert workshop trying <strong>to</strong> establish what the basic<br />
HCVs are, but a stronger approach is <strong>to</strong> get a number <strong>of</strong> credible organisations <strong>to</strong> agree on national<br />
thresholds. The advantage <strong>of</strong> this is that once one has the framework, then one can operate<br />
anywhere <strong>with</strong>in the country. This is somewhat different <strong>to</strong> some <strong>of</strong> the other <strong>approaches</strong>.<br />
140
APPENDIX<br />
If one needs <strong>to</strong> still define national thresholds, a large scale process <strong>with</strong> many stakeholders process<br />
can take up <strong>to</strong> 2 years, as the stakeholder consultation process is time consuming. For certification<br />
purposes and where no national interpretation exists, a manager can still take decisions for their site<br />
based on appropriate expert judgement and consultation, and will need <strong>to</strong> be able <strong>to</strong> defend these<br />
robustly <strong>to</strong> an audi<strong>to</strong>r. The more complex the system or the higher the stress on the system the wider<br />
the stakeholder consultation must be, thus resulting in more time needed <strong>to</strong> define thresholds and<br />
guidance on appropriate management.<br />
After thresholds have been defined, the time it takes <strong>to</strong> implement the HCV concept will depend on<br />
the size <strong>of</strong> the operation, the complexity <strong>of</strong> the area/ site / region: eg For small scale or low impact<br />
operations the whole thing should only take a few days. For management units/ FMU few 100 -<br />
10.000 hectares, depending on the location, field surveys may take 5 -10 days (might want <strong>to</strong> visit<br />
several times a year) and then one still has <strong>to</strong> do a social assessment. So a full assessment could<br />
take between 6 months - 1 year (including e.g. seasonally based visits)<br />
• B. Cost: Could you give me an estimate <strong>of</strong> how much it costs <strong>to</strong> implement the HCV approach?<br />
A site based HCV assessment in developing countries for medium- sized operations could cost<br />
between £7,000 and £10,000 (<strong>with</strong>out defining national thresholds). Costs for small or low impact<br />
operations could be a fraction <strong>of</strong> this.<br />
In developing countries, if national experts are present, the cost can be decreased.<br />
In developed countries, the cost can be asked for this is less, e.g. if social values are less important<br />
or not present.<br />
The minimum cost for medium <strong>to</strong> large forestry operations will be around $5,000 or more.<br />
• C. Human resources: Which type experts are required <strong>to</strong> perform an assessment? Are nonexpert<br />
users able <strong>to</strong> perform an assessment?<br />
National experts know the data very well and international experts have built up knowledge in their<br />
respective field <strong>of</strong> expertise. Low-impact operations do not need national experts (e.g. local<br />
institutions may provide appropriate staff/expertise).<br />
If company has credible, qualified staff, the assessment can be performed internally by non-expert<br />
users, if not the company must hire someone, e<strong>special</strong>ly for high impact operations.<br />
Yes there are circumstances where it is appropriate for a company <strong>to</strong> perform an assessment<br />
internally, but a consultation will always need <strong>to</strong> be performed, in order <strong>to</strong> ask experts for their<br />
opinion and <strong>to</strong> verify the data.<br />
• D. Data requirements: Is the required data easy <strong>to</strong> collect? How do national experts or nonexperts<br />
cope <strong>with</strong> data requirements?<br />
Every case is different.<br />
Because HCV is not an exclusive methodology (data requirements are also not exclusive), one can<br />
bring in national experts who work well <strong>with</strong> the data framework. Normally one can build up lots <strong>of</strong><br />
data through desk based analysis and in brief field visits. What will be necessary is <strong>to</strong> then verify the<br />
data. However some things do require gathering large amounts <strong>of</strong> new data, e<strong>special</strong>ly if proposed<br />
operations are <strong>of</strong> a potentially high impact.<br />
• E. Purpose <strong>of</strong> the approach: How efficient is the concept in conserving biodiversity?<br />
This still needs <strong>to</strong> be measured and analysed in peer reviewed comparative studies.<br />
Proxy data exist on the usefulness <strong>of</strong> certification where a large number <strong>of</strong> FSC companies were<br />
surveyed and the conservation outcome was looked at. What came out <strong>of</strong> the certification process?<br />
In some <strong>areas</strong> one might be able <strong>to</strong> say: x amount <strong>of</strong> land is being sustainably managed for<br />
conservation purpose, and management plans <strong>of</strong> certified operations should list conservation targets<br />
141
A4-INTERVIEW PARTNER D<br />
(e.g. species, habitats etc), indica<strong>to</strong>rs and moni<strong>to</strong>ring processes. This is what can be determined<br />
otherwise the question cannot be answered.<br />
This does need <strong>to</strong> be looked at by building up a matrix, but it is very complex question<br />
• F. Certification: Do you think market based initiatives are more effective than governance<br />
based <strong>approaches</strong>?<br />
Do you mean government based e.g. protected <strong>areas</strong>?<br />
Market based initiatives need <strong>to</strong> be governed. The HCV approach comes embedded <strong>with</strong>in a<br />
certification system which is a voluntary set <strong>of</strong> rules (that companies have agreed <strong>to</strong> abide by). Those<br />
rules can be as/ more effective than legal frameworks. The certification systems <strong>of</strong>ten go beyond<br />
basic legal requirements. From this point market based <strong>approaches</strong> can be a stronger system than<br />
legal compliance.<br />
There may be conflicts <strong>with</strong> the law and a voluntary approach. So I think we need a combination <strong>of</strong><br />
both. We need the support <strong>of</strong> a legal framework for voluntary <strong>approaches</strong> <strong>to</strong> be effective. If legal<br />
framework is not supportive, then voluntary <strong>approaches</strong> become a deal great more difficult. One <strong>of</strong><br />
the big advantages <strong>of</strong> certification processes is that they bring <strong>to</strong>gether a range <strong>of</strong> stakeholders <strong>to</strong><br />
discuss problems that have not been thought <strong>of</strong>/ discussed in a way that many other <strong>approaches</strong><br />
have not done. This is because they are linked <strong>to</strong> economic drivers.<br />
There are some limitations <strong>to</strong> the market-based <strong>approaches</strong>. They have <strong>to</strong> be supported by legal<br />
framework <strong>to</strong> work well. They work much better if land-use planning allows conservation measures<br />
such as voluntary set aside <strong>areas</strong> or reduced <strong>of</strong>f take in some <strong>areas</strong> <strong>of</strong> leased land. In some cases<br />
that does not work well, because government takes away voluntary set asides or taxes companies<br />
based on <strong>areas</strong> rather than volumes <strong>of</strong> production, making it very difficult for companies <strong>to</strong> apply<br />
conservation measures effectively.<br />
IV<br />
Summary, evaluation & outlook<br />
• How meaningful can <strong>approaches</strong> used for the identification <strong>of</strong> biodiversity relevant <strong>areas</strong> be for<br />
biodiversity conservation?<br />
There are two main ways for conserving biodiversity. The first is <strong>to</strong> protect representative samples <strong>of</strong><br />
habitats and their constituents in a network <strong>of</strong> protected <strong>areas</strong>. That is a very important part <strong>of</strong><br />
conservation and is the his<strong>to</strong>rical approach. The second part is conserving biodiversity in nonprotected<br />
<strong>areas</strong> (i.e. mixed use and production <strong>areas</strong>). This is an increasingly important part <strong>of</strong><br />
modern conservation efforts.<br />
A lot <strong>of</strong> the protected <strong>areas</strong> networks were set up quiet a long time ago and are not fully<br />
representative, over-representing <strong>areas</strong> that are unproductive or sparsely inhabited. Therefore they<br />
do not really protect the national range <strong>of</strong> biodiversity. Thus, it is very important <strong>to</strong> conserve<br />
biodiversity in production land.<br />
One can either protect those values by setting up more (i.e. voluntary) protected <strong>areas</strong> or one finds<br />
ways <strong>of</strong> managing production land <strong>to</strong> conserve those values. There is not one way <strong>of</strong> doing it.<br />
142
APPENDIX<br />
A4-5 Interview Partner E<br />
II<br />
Approaches & their characteristics<br />
Which <strong>approaches</strong> do you know?<br />
There are many. These can be classified in terms <strong>of</strong> their objectives:<br />
"Where <strong>approaches</strong>" - aimed at highlighting <strong>areas</strong> important for biodiversity.<br />
Eg. - large scale prioritising <strong>approaches</strong>: Priority Ecoregions, Biodiversity Hotspots<br />
- large scale prioritising <strong>approaches</strong>: IBA, KBA, AZE<br />
These say nothing about management options. The process <strong>of</strong> delineation does not consider existing<br />
land use, or how <strong>to</strong> work <strong>with</strong> land users <strong>to</strong> deliver the conservation objective.<br />
"How <strong>approaches</strong>" - figure out how best <strong>to</strong> manage <strong>areas</strong> <strong>to</strong> promote or maintain biodiversity.<br />
Eg. frameworks such as the HCV framework: HCV framework is the only approach that explicitly<br />
links the where part <strong>to</strong> the how part. Because the land user is the one carrying out the HCV<br />
assessment, the obligation is on the land user <strong>to</strong> come up <strong>with</strong> the 'how' (<strong>to</strong> maintain or enhance the<br />
conservation value).<br />
Any <strong>of</strong> the above <strong>approaches</strong> are useful in <strong>identify</strong>ing the <strong>importance</strong> <strong>of</strong> the <strong>areas</strong>. The key question<br />
is what one does <strong>with</strong> the information <strong>to</strong> steer management on the ground <strong>to</strong> inform land-use<br />
decisions. That is a different kind <strong>of</strong> question.<br />
• This thesis has been limited <strong>to</strong> the assessment <strong>of</strong> site based <strong>approaches</strong>.<br />
• Could you list any strengths or weaknesses <strong>of</strong> the <strong>approaches</strong> you know? Do you know<br />
anything about the KBA approach?<br />
The KBA approach aims <strong>to</strong> <strong>identify</strong> sites that contain high concentrations <strong>of</strong> threatened or endemic<br />
species. It uses, more or less, the same criteria as IBA, both being species based and both relying<br />
on the presence or potential presence <strong>of</strong> threatened, endangered or migra<strong>to</strong>ry species. The<br />
delineation <strong>of</strong> sites that are going <strong>to</strong> be called KBA is based on existing species data. In the absence<br />
<strong>of</strong> these distribution maps, one must fall back on expert opinion, taxonomists or ecologists who say<br />
that a species may be found in a particular region. For example, in Africa where it has been applied<br />
and where there is very little actual data, such as species distribution and abundance maps, the<br />
designation <strong>of</strong> those sites becomes a bit <strong>of</strong> a guessing game. It is always expert led, but it still<br />
becomes very difficult <strong>to</strong> delineate the actual boundaries for a KBA, because any suitable habitat<br />
could be designated equally.<br />
• So that would be one <strong>of</strong> its major weaknesses?<br />
It is similar for all <strong>of</strong> these <strong>approaches</strong>. One tries <strong>to</strong> use hard scientific data <strong>to</strong> indicate a place on the<br />
map that is thought <strong>to</strong> be important. But very <strong>of</strong>ten the data does not support the precise delineation<br />
<strong>of</strong> an area. So one has a choice, whether <strong>to</strong> try and define an area or whether <strong>to</strong> talk about a more<br />
vague wider area that is <strong>of</strong> general <strong>importance</strong> <strong>with</strong>out trying <strong>to</strong> delineate the boundary. One <strong>of</strong> the<br />
main weaknesses <strong>of</strong> the KBA approach is that it tries <strong>to</strong> delineate the boundary <strong>with</strong>out the data <strong>to</strong><br />
support that.<br />
• And in comparison <strong>to</strong> the HCV framework? Is this a weakness <strong>of</strong> the HCV approach?<br />
Yes it is. In the sense that if one only talks about the delineation stage or if one uses the data <strong>to</strong><br />
<strong>identify</strong> an area, then it is exactly the same problem, because it is based on the same criteria. The<br />
advantage <strong>of</strong> the HCV approach is that one is explicitly trying <strong>to</strong> get <strong>to</strong> a land-management solution,<br />
so it is usually being used by the land-owner or user <strong>to</strong> try and decide where they can and cannot<br />
carry out activities. So it is a different type <strong>of</strong> process: yes one is limited by the data <strong>to</strong> begin <strong>with</strong>. But<br />
one also has <strong>to</strong> go further through this process <strong>to</strong> say what is known about the threats <strong>to</strong> these<br />
species, what is known about population viability in these <strong>areas</strong>, what is known about the extent <strong>of</strong><br />
143
A4-INTERVIEW PARTNER E<br />
plans compromising population viability and how plantation activities can be designed around the<br />
needs <strong>of</strong> specific species. So this boundary delineation context is in the context <strong>of</strong> active land-use.<br />
• Which criteria would be important for you, if you were <strong>to</strong> compare these <strong>approaches</strong>?<br />
If one focuses purely on biodiversity at the species level, it is good <strong>to</strong> integrate elements <strong>of</strong> several<br />
different criteria. It is important <strong>to</strong> recognise the aspect <strong>of</strong> concentrations which both the IBA and<br />
KBA have and which is repeated in the HCV criteria. Where several threatened species are found in<br />
one place. Other important <strong>approaches</strong> explicitly bring in questions <strong>of</strong> population viability, such as<br />
more traditional conservation planning <strong>to</strong>ols talk about how <strong>to</strong> maintain the population viability <strong>of</strong><br />
those species. Both concepts should be dealt <strong>with</strong>, ideally.<br />
Try <strong>to</strong> make an explicit link between those criteria (concentrations <strong>of</strong> threatened specie) and the<br />
more traditional conservation planning <strong>approaches</strong> (representation <strong>of</strong> habitats in protected <strong>areas</strong> and<br />
the irreplaceability <strong>of</strong> habitats and ecosystems). The HCV approach applied on its own does not deal<br />
<strong>with</strong> the concept <strong>of</strong> representativeness. Within the FSC standard there are elements contained in<br />
Principle 6 which requires one <strong>to</strong> establish representative samples <strong>of</strong> different ecosystems. So under<br />
the FSC system both <strong>of</strong> those issues are addressed in different standards. However, if one takes the<br />
HCV criteria out <strong>of</strong> the FSC standard and apply them on their own, then one looses the need <strong>to</strong><br />
establish representative conservation <strong>areas</strong>. So on its own it is not such a robust framework for<br />
conservation management.<br />
• How <strong>of</strong>ten has it been used on its own?<br />
There is some interest in using it as a conservation planning <strong>to</strong>ol. (WWF has tried this in Indonesia<br />
and PNG and IUCN have recently tried it in Brazil.) For example at a government level, HCV <strong>areas</strong><br />
will be identified at the national level and then allow plantation development in everything else. There<br />
is some interest in using this, because the criteria are well-known and are generally supported by<br />
industry. (Which means the results could be more acceptable <strong>to</strong> all parties) because HCV on its own<br />
may give a smaller area than traditional conservation planning <strong>approaches</strong>. Traditional conservation<br />
planning is asking what kind <strong>of</strong> landscape is wanted. It is an aspirational process. The process asks,<br />
how the landscape can be designed <strong>to</strong> maximise biodiversity conservation. The HCV or KBA<br />
<strong>approaches</strong> ask where the small <strong>areas</strong> are which contain concentrations <strong>of</strong> species which are<br />
already threatened. At least these must be saved. For example, if one uses the AZE process as the<br />
basis for a national level conservation plan, one would end up <strong>with</strong> only small <strong>areas</strong> being conserved.<br />
The same case would occur if one used HCV or KBA on its own.<br />
• So do think that is a weakness?<br />
It is a weakness if the approach is used as a conservation <strong>to</strong>ol in the traditional sense. It needs <strong>to</strong> be<br />
widely unders<strong>to</strong>od that the HCV criteria work quite well as a land management <strong>to</strong>ol <strong>with</strong>in the context<br />
<strong>of</strong> private sec<strong>to</strong>r land use. But for national scale conservation planning protected area design a more<br />
traditional conservation planning <strong>approaches</strong> is needed. One needs <strong>to</strong> ask different types <strong>of</strong><br />
questions: what is the best possible landscape design for the maximum amount <strong>of</strong> biodiversity<br />
conservation? Not, what is the smallest area one can possibly set aside <strong>to</strong> maintain the last<br />
threatened species?<br />
A <strong>to</strong>ol like the HCV framework works well in the private sec<strong>to</strong>r <strong>to</strong> compliment existing systematic<br />
conservation planning at a national level.<br />
• How would you best measure efficiency?<br />
Uptake: the same measure used for certification; demand for certification. People are interested in<br />
using that approach.<br />
Actual <strong>areas</strong> that become designated as HCV <strong>areas</strong> in a certified land management scheme.<br />
Although in forestry, there sometimes is not much difference in how the HCV area is being used and<br />
how it would have been used previously. In some cases logging may be compatible <strong>with</strong> maintaining<br />
144
APPENDIX<br />
HCV. Thus making it harder <strong>to</strong> measure how much <strong>of</strong> the world has been designated as HCV,<br />
because this would not be the same as a protected area.<br />
The most important measure <strong>of</strong> effectiveness is the degree <strong>to</strong> which the criteria and the approach is<br />
unders<strong>to</strong>od by those who pursue certification. This is the major problem at the moment. For example,<br />
in Indonesia one is obliged by law <strong>to</strong> set aside a percentage <strong>of</strong> land for conservation. People have<br />
used the HCV criteria <strong>to</strong> determine where that percentage should be put. That is not an appropriate<br />
use <strong>of</strong> the concept. The concept is basically saying: any <strong>of</strong> this area could be high conservation area<br />
from 0 -100%. One has <strong>to</strong> assess the area against the criteria <strong>to</strong> determine which parts <strong>of</strong> the<br />
concession one can use and which parts not. A true interpretation <strong>of</strong> the criteria would very <strong>of</strong>ten<br />
result in a much larger <strong>areas</strong> being set aside for conservation. But due <strong>to</strong> a lack <strong>of</strong> an understanding<br />
<strong>of</strong> the concept the eventual set aside area is actually <strong>to</strong>o small.<br />
• For it <strong>to</strong> be an effective HCV area?<br />
Yes, <strong>to</strong> be effective in conserving or maintaining the values present.<br />
• This lack <strong>of</strong> understanding is found in non-expert users, forestry opera<strong>to</strong>rs?<br />
Yes, but crucially the problem is also for the certifying agencies. If they do not understand that some<br />
<strong>of</strong> these <strong>areas</strong> would definitely be designated HCV <strong>areas</strong>, if they do not understand how <strong>to</strong> evaluate<br />
the HCV criteria, then the system is not sufficiently strong. One major problem at the moment is the<br />
lack <strong>of</strong> understanding <strong>of</strong> the certification agencies which are holding back the effective use <strong>of</strong> the<br />
HCV concept and delivering good conservation.<br />
• How would you deal <strong>with</strong> this problem?<br />
It has <strong>to</strong> be through training. In an ideal world the certification system (FSC or RSPO) would be able<br />
<strong>to</strong> support better training for the certification bodies and also the accreditation system which they use<br />
<strong>to</strong> check on the competence <strong>of</strong> the audi<strong>to</strong>rs would be stronger on that issue. They would demand<br />
higher levels <strong>of</strong> competence and skills form the audi<strong>to</strong>rs.<br />
III<br />
Approaches & their requirements<br />
• A. Time: As an estimate, how much time is required for implementation?<br />
It depends on the context one is operating in. For example in the concession in Central Africa, the<br />
HCV identification process will be part <strong>of</strong> the detailed management planning process which is<br />
required by governments prior <strong>to</strong> logging. Normally this takes a couple <strong>of</strong> years (up <strong>to</strong> 2 years) <strong>to</strong><br />
survey the forest in detail and <strong>to</strong> prepare the management plan.<br />
However, it is also possible <strong>to</strong> complete an HCV report <strong>with</strong>in a couple <strong>of</strong> weeks in the field. As long<br />
as the forest data already exists, thus using the inven<strong>to</strong>ry data one could write an HCV management<br />
plan fairly quickly (a couple <strong>of</strong> weeks) by carrying out rapid field work, consulting <strong>with</strong> experts and<br />
regional maps. It is possible <strong>to</strong> do an assessment in this way as well.<br />
Many companies also first write the management plan and then decide <strong>to</strong> go the route <strong>of</strong> certification.<br />
So they the hire a consultant or expert <strong>to</strong> do another assessment <strong>of</strong> the forest for a specific HCV plan<br />
which is then completed in 2-4 weeks on sites and weeks <strong>to</strong> months compiling data and writing the<br />
report.<br />
Reasonable time frame: 3 months<br />
145
A4-INTERVIEW PARTNER E<br />
• B. Cost: How much does the HCV process cost?<br />
It depends on how much field work is necessary. For example in Central Africa where a management<br />
plan is already compiled and there is no need for extensive field work, the cost can be reduced <strong>to</strong><br />
US$10 000 - $15 0000 (similar <strong>to</strong> an EIA).<br />
If a detailed assessment is required then the cost can rise <strong>to</strong> US$30 000 - $40 000 where more time<br />
in the field is needed <strong>with</strong> more experts required <strong>to</strong> be involved in the assessment and more detailed<br />
local consultation is required.<br />
• D. Data requirements: Can non-expert users fulfil the data requirements?<br />
Usually yes, because the people implementing the results will always be non-experts (forest<br />
managers, palm oil managers), so the results will always have <strong>to</strong> be formulated in a way that nonexperts<br />
can understand them. However, expert input is always going <strong>to</strong> be necessary, so the<br />
assessment can be led by a non-expert, but they would need <strong>to</strong> involve an expert ecologist, socioeconomist,<br />
botanist in order <strong>to</strong> effectively evaluate the biodiversity and social aspects <strong>of</strong> the area <strong>to</strong><br />
come up <strong>with</strong> appropriate management measures.<br />
• E. Purpose <strong>of</strong> the approach: How efficient is the concept in conserving biodiversity?<br />
There are no studies that looked at the efficiency <strong>of</strong> the approach. There are no studies that have<br />
looked at the results <strong>of</strong> the approach. The eventual result <strong>of</strong> any assessment will be entirely<br />
dependant on the situation. For example in a Central African forestry concession: most <strong>of</strong> the area is<br />
still available for logging. Whereas in a palm oil context, the <strong>areas</strong> set aside could be quite big. In<br />
forestry the actual set aside <strong>areas</strong> might only be 5-10% <strong>of</strong> the <strong>to</strong>tal forest area. Whereas in a<br />
potential palm oil plantation, HCV is unlikely <strong>to</strong> be conserved in such a small area set aside.<br />
How long has the HCV approach been implemented?<br />
Since about 2002, so there is not a great deal <strong>of</strong> experience <strong>with</strong> implementing the approach and<br />
there are no studies that have looked at the effectiveness, yet.<br />
• Is the HCV network looking in <strong>to</strong> this at all?<br />
Yes, they are thinking about ways <strong>to</strong> measure and how <strong>to</strong> compile data <strong>to</strong> look at effectiveness. But<br />
one would need <strong>to</strong> look at different contexts, such as plantation forestry in South Africa, palm oil in<br />
South East Asia and tropical forest logging in Central Africa and Brazil and then compare the way the<br />
approach is used in each case.<br />
• F. Certification: Do you think market based initiatives are more effective than governance<br />
based <strong>approaches</strong>?<br />
It really depends on the perspective from where one is coming. KBA approach has been used very<br />
<strong>of</strong>ten <strong>to</strong> try and stimulate the formation <strong>of</strong> a protected area. A lot <strong>of</strong> traditional conservation planning<br />
is done in that way: <strong>to</strong> <strong>identify</strong> priority sites for the creation <strong>of</strong> new protected <strong>areas</strong>. That is one type<br />
<strong>of</strong> question: What is the optimal location and size for a protected area network <strong>to</strong> maximise<br />
biodiversity conservation?<br />
Whereas the HCV approach is usually applied in the context <strong>of</strong> productive landscape where the landuse<br />
objective is commercial. So one might get some more conservation <strong>areas</strong> <strong>with</strong>in the commercial<br />
land, but will not result in the creation <strong>of</strong> new government protected <strong>areas</strong>.<br />
• How do market based initiatives compare <strong>to</strong> governance <strong>approaches</strong>?<br />
They are quite complimentary. It is not really a question <strong>of</strong> which is better. The reach and the<br />
influence <strong>of</strong> a market based approach is potentially bigger, but it is limited by the willingness <strong>of</strong> the<br />
market <strong>to</strong> promote that type <strong>of</strong> approach and the willingness <strong>of</strong> the private sec<strong>to</strong>r <strong>to</strong> adopt that sort <strong>of</strong><br />
approach. It always comes back <strong>to</strong> how much influence you have or how much leverage you have <strong>of</strong><br />
the private sec<strong>to</strong>r land owner <strong>to</strong> deliver your set <strong>of</strong> objectives. It is potentially a very powerful <strong>to</strong>ol for<br />
this voluntary initiative.<br />
146
APPENDIX<br />
• Is there demand for certification?<br />
Certainly there is, although it has taken many years <strong>to</strong> establish. In the case <strong>of</strong> palm oil the growth in<br />
interest for certified projects was much quicker. There the issue was more obvious. It is easier <strong>to</strong><br />
market. With forestry it is less clear cut, a reason why it was slower <strong>to</strong> grow. Certified products are<br />
helping <strong>to</strong> drive the uptake <strong>of</strong> something like HCV.<br />
This demand is difficult <strong>to</strong> quantify. Certified forestry now accounts for about ¼ <strong>of</strong> the world's<br />
industrial timber trade. That is quite a substantial portion, predominantly driven by Europe and the<br />
United States.<br />
IV<br />
Summary, evaluation & outlook<br />
• How meaningful can <strong>approaches</strong> used for identification <strong>of</strong> biodiversity relevant <strong>areas</strong> be for<br />
biodiversity conservation?<br />
It can be meaningful particularly the market based <strong>approaches</strong> have done an enormous amount <strong>to</strong><br />
raise awareness amongst land users and producers that there are benefits from engaging <strong>with</strong><br />
conservation. However, making those <strong>approaches</strong> really meaningful, it may be necessary <strong>to</strong> link<br />
them <strong>to</strong> some kind <strong>of</strong> payment mechanism, such as carbon or biodiversity credits where there would<br />
also be a direct financial incentive for the companies <strong>to</strong> go done that road.<br />
Having an approach sitting very firmly in certification schemes, and thus, targeting productive users<br />
<strong>of</strong> land, has been very effective in doing conservation.<br />
• So you think efforts should rather not concentrate on existing biodiversity initiatives, but<br />
instead <strong>of</strong> <strong>identify</strong> new <strong>areas</strong>?<br />
All <strong>of</strong> the research that goes on, on protected area design is extremely important. But there is not<br />
enough effort placed on how you change land management practices in <strong>areas</strong> outside <strong>of</strong> protected<br />
area. I don't think we are going <strong>to</strong> achieve sufficient conservation efforts through the establishment <strong>of</strong><br />
protected <strong>areas</strong>. Too much <strong>of</strong> the research on protected <strong>areas</strong> focuses on the 'where' and not<br />
enough is done on 'how' the protected area should be managed and 'how' the land around the<br />
protected area should be managed <strong>to</strong> maintain the biodiversity or the conservation value.<br />
147
A4-INTERVIEW PARTNER F<br />
A4-6 Interview Partner F<br />
II<br />
Approaches & their characteristics<br />
• Which <strong>approaches</strong> used <strong>to</strong> <strong>identify</strong> <strong>areas</strong> relevant <strong>to</strong> biodiversity conservation do you know?<br />
The conventional forest management plan and the HCV <strong>to</strong>olkit made by Pr<strong>of</strong>orest in Libreville.<br />
• Can you describe any strengths or weaknesses for these <strong>approaches</strong>?<br />
Conventional forest management plan: good identification <strong>of</strong> study area. However, if the company<br />
does not want certification (e<strong>special</strong>ly FSC), then it might only look at timber harvesting <strong>with</strong> almost<br />
no ecological aspect.<br />
HCV <strong>to</strong>olkit: The titles for each HCV are good, but the guidelines <strong>to</strong> <strong>identify</strong> them are very vague.<br />
This is a weakness (if one is not serious about the work, then one just does the minimum) and a<br />
strength (if one is serious, then one has more freedom <strong>to</strong> develop one's own technique).<br />
• Are there other <strong>approaches</strong> that, in your opinion, may be important for <strong>identify</strong>ing <strong>areas</strong> <strong>of</strong> high<br />
biodiversity?<br />
Certified companies are obliged <strong>to</strong> make both reports and many points are very redundant. The laws<br />
cannot easily be changed, so it might be interesting <strong>to</strong> develop HCV <strong>to</strong>olkits on a real scientific basis.<br />
One could keep the six points, but develop methods <strong>to</strong> <strong>identify</strong> them.<br />
• Can you think <strong>of</strong> any other criteria which may be important for comparing methods used <strong>to</strong><br />
<strong>identify</strong> biodiversity relevant <strong>areas</strong>?<br />
A conventional forest management plan and the HCV assessment are complimentary, thus, they do<br />
not need <strong>to</strong> be compared. It would be good <strong>to</strong> produce a single report integrating the HCV<br />
assessment. This would need for the laws <strong>to</strong> be changed in Central Africa.<br />
III<br />
Approaches & their requirements<br />
• A. Time: How much time is required for implementing the <strong>approaches</strong>?<br />
When working in timber logging, a management plan based on socio-economic surveys (from 2 - 6<br />
months depending on the area) and management inven<strong>to</strong>ries (botanic, animal, social) on about 1%<br />
<strong>of</strong> the concession (2-3 years <strong>of</strong> work <strong>with</strong> 1 - 2 teams) has already been produced. Most <strong>of</strong> the<br />
conservation measures have already been made in the management plan (field work + writing = 2-3<br />
years). So the HCV assessment itself takes only 2 weeks.<br />
When working in other <strong>areas</strong> (eg. palm oil), the required time will depend on inven<strong>to</strong>ries in the field.<br />
Although these inven<strong>to</strong>ries are not requested by the <strong>to</strong>olkit.<br />
• Should efforts rather concentrate on existing biodiversity conservation initiates?<br />
I believe, one should start <strong>with</strong> what is already known (biodiversity conservation initiates), however a<br />
real systematic inven<strong>to</strong>ry should also be completed.<br />
• Can the required time be reduced <strong>with</strong>out compromising the efficiency? Do you have any ideas<br />
on this?<br />
No<br />
• B. Cost: How much does the implementation <strong>of</strong> the <strong>approaches</strong> cost?<br />
Not easy <strong>to</strong> say: management plan vs HCV. It depends on what has already been done. For<br />
instance, have inven<strong>to</strong>ries and analyses been performed by the logging company or must<br />
consultants still complete these.<br />
148
APPENDIX<br />
• C. Human Resources: Which human resources are required for implementing the <strong>approaches</strong>?<br />
Again: Not easy <strong>to</strong> say: management plan vs HCV. The same reasons as above (see cost).<br />
One needs at least one international expert for the report, one team for inven<strong>to</strong>ries and another team<br />
for the socio-economic assessment.<br />
• D. Data requirements: How is data collection designed (easy/ complex)?<br />
The data collected in the field remains the same. This is fixed by legislation, although elements can<br />
always be added if needed. The use <strong>of</strong> existing data (bibliography and satellite images if available)<br />
depends on the assessment team. Thus, for the team it is not really complex.<br />
• Can the required data easily be used by non-<strong>special</strong>ist users?<br />
Not really<br />
• E. Purpose <strong>of</strong> the approach: How efficient is the conservation <strong>of</strong> biodiversity?<br />
This is impossible <strong>to</strong> answer: the idea is <strong>to</strong> <strong>identify</strong> everything that might be sensitive and <strong>to</strong> propose<br />
measures that will keep all the different species and forest types. For your information, on average, a<br />
logging company (in Central Africa) will only cut one tree per hectare and per 25 years. So the risks<br />
<strong>of</strong> species extinction in that particular area are low.<br />
We work on huge <strong>areas</strong> (generally more than 200,000 ha for logging concessions), so the first thing<br />
is <strong>to</strong> <strong>identify</strong> really sensitive <strong>areas</strong> (swamps, mountainous forest, high slopes) where no logging will<br />
occur. It is rare that we conserve less than 5% <strong>of</strong> the concession. Next we determine the measures<br />
specific for every species (low regeneration commercial tree species, endemic species, hunting<br />
rules) which are fixed for the entire rotation.<br />
Every forest type is different, every situation is different. For example, if one develops a oil plantation<br />
in a degraded forest, one would only protect the swamps and the buffer <strong>areas</strong> <strong>of</strong> national parks,<br />
rivers, streams, etc<br />
• F. Certification: How do market based initiatives fare in biodiversity conservation?<br />
• Are market based initiatives efficient in biodiversity conservation?<br />
Yes<br />
• How do they compare <strong>to</strong> classical protected <strong>areas</strong>?<br />
In our context, private companies <strong>of</strong>ten have more means and motivation in conservation than<br />
government. More and more <strong>of</strong>ten, timber logging concessions are considered as links <strong>to</strong> the<br />
national parks.<br />
<br />
IV Summary, evaluation & outlook<br />
• How meaningful can <strong>approaches</strong> used <strong>to</strong> <strong>identify</strong> valuable biodiversity regions be for<br />
biodiversity conservation?<br />
It is important <strong>to</strong> <strong>identify</strong> all the HCV. For biodiversity in itself and <strong>to</strong> have a better control over what<br />
the companies are doing. So one has a better idea <strong>of</strong> what is threatened by logging, e<strong>special</strong>ly<br />
regarding a species based management.<br />
• Should efforts rather concentrate on existing biodiversity conservation initiatives?<br />
The efforts should go <strong>to</strong> every sec<strong>to</strong>r. National parks, concessions, etc. It is really important <strong>to</strong><br />
consider logging concessions as links because they cover almost all the central African terri<strong>to</strong>ry that<br />
is not protected.<br />
• Are there any current debates going on in your organisation on this <strong>to</strong>pic?<br />
Every new HCV assessment is a new debate. The context is always different.<br />
149
A4-INTERVIEW PARTNER G<br />
A4-7 Interview Partner G<br />
II<br />
Approaches & their characteristics<br />
Which <strong>approaches</strong> do you know?<br />
I have been most actively involved <strong>with</strong> HCV, ERBC <strong>approaches</strong>, a little bit on KBA, not directly<br />
involved in focal species or REAs.<br />
Last <strong>of</strong> the Wild <strong>areas</strong> are identified by looking for the <strong>areas</strong> least impacted by human development.<br />
It’s a GIS based system using data on roads, rail, settlements etc, and then looking for the <strong>areas</strong> that<br />
have the lowest impact from them (Sanderson et al. 2002. Bioscience Vol. 52 No. 10, P891).<br />
But I have also helped <strong>with</strong> species specific priority-setting exercises, range-wide stuff.<br />
Could you list any strengths and weaknesses <strong>of</strong> <strong>approaches</strong> you know?<br />
They all address slightly different aspects. A broad issue is that there are so many different ways <strong>of</strong><br />
looking at this. Every NGO wants <strong>to</strong> do it in their own way, so that they have something they can sell<br />
<strong>to</strong> donors or market as being there approach.<br />
ERBC: The biggest flaw, I have felt, for ERBC was the definition <strong>of</strong> an ecoregion which is extremely<br />
problematic. There were difficulties in finding a coherent and replicable definition <strong>of</strong> an ecoregion.<br />
Thus, making it very difficult <strong>to</strong> set priorities <strong>with</strong>in an ecoregion.<br />
KBA: I think is an interesting process. The way it has been explained <strong>to</strong> me - The problem is that it<br />
takes an area defined by existing land use boundaries and then looks <strong>to</strong> see what is in the area. It is<br />
not necessarily highlighting anything different, but one looks at a national park and then looks at what<br />
is in it. Rather than taking an objective view <strong>of</strong> a whole country or landscape and then drawing<br />
boundaries based on the values. It is looking at pre-existing value in pre-existing boundaries and<br />
seeing what exist <strong>with</strong>in those. This seems <strong>to</strong> weaken the concept for me. I think it would be useful if<br />
one looked at a blank slate and said: where these values are found, where these attributes <strong>of</strong> KBA<br />
are held and then drew boundaries.<br />
• Are biodiversity values likely <strong>to</strong> be found in <strong>areas</strong> where major land use changes have<br />
occurred?<br />
Yes, even in South East Asia where huge development has occurred, vast <strong>areas</strong> outside <strong>of</strong> protected<br />
<strong>areas</strong> exist. These values are either dropped from the KBA system. Alternatively, if one simply looks<br />
at biodiversity, one has <strong>to</strong> try and agree on boundaries. But in a country like Cambodia there are no<br />
obvious, easy units <strong>to</strong> divide the country up in<strong>to</strong>. This however, does not mean that no <strong>areas</strong> exist<br />
that absolutely qualify as KBA. In fact just the contrary is true. The problem is that these <strong>areas</strong> do not<br />
qualify, as they do not have a divide around them. It is the wrong way round.<br />
Another problem is that the objectives or thresholds are set at a global level and can not be changed<br />
<strong>to</strong> make them more relevant for Cambodia or South East Asia where at the moment every large<br />
mammal is on the Red List. Therefore a few individuals <strong>of</strong> some red listed, but <strong>to</strong>lerant species (eg<br />
samba, sunbear) <strong>to</strong> be present and it <strong>of</strong>ficially counts as KBA. Those species could be present in any<br />
forest block in South East Asia and therefore <strong>to</strong> follow the thresholds exactly, as is required, any<br />
significant forest block is KBA. Thus, following the criteria, priorities will not be identified as<br />
everything is KBA. This problem is the same for HCV except the other way round.<br />
The one I have worked <strong>with</strong> most closely is HCV. I view HCV as slightly different <strong>to</strong> the other<br />
<strong>approaches</strong>. I find it interesting <strong>to</strong> get a sense <strong>of</strong> how people from the outside view HCV, placing it in<br />
the same category as the other <strong>approaches</strong>.<br />
The most important, in my opinion, about HCV is not only defining <strong>areas</strong> (not drawing boundaries<br />
around HCV <strong>areas</strong>), but rather what the values are and how they are managed. It is a much more<br />
management orientated process, producing management plans or recommendations for the<br />
150
APPENDIX<br />
identified values. This makes it a slightly stronger system and a reason why it is far more popular<br />
<strong>with</strong> the private sec<strong>to</strong>r than the other <strong>approaches</strong>. It helps managers find ways <strong>to</strong> manage their land<br />
<strong>with</strong>out affecting the biodiversity or environmental and social values. Identifying <strong>areas</strong> and drawing a<br />
circle on a map is just the beginning <strong>of</strong> the process.<br />
• Which criteria would you use <strong>to</strong> compare the various <strong>approaches</strong>?<br />
In the end, it is easiest <strong>to</strong> look at species. But it has <strong>to</strong> be done sensibly and not just <strong>to</strong> <strong>identify</strong> the<br />
<strong>areas</strong> <strong>with</strong> the largest number <strong>of</strong> species. Proxies such as forest cover and forest condition can be<br />
used in large <strong>areas</strong> <strong>with</strong> little <strong>to</strong> no available data. This can be extremely useful and valuable.<br />
In a lot <strong>of</strong> cases, it is a case <strong>of</strong> what can be practically done, rather than what is scientifically best. It<br />
would be great <strong>to</strong> do huge extensive inven<strong>to</strong>ries <strong>of</strong> everything living in an area. It is more practical <strong>to</strong><br />
first <strong>identify</strong> <strong>areas</strong> that appear <strong>to</strong> be relatively undisturbed and then from there start <strong>identify</strong>ing target<br />
species. During the whole process considering threat: which is the area <strong>with</strong> a large number <strong>of</strong><br />
species and are those species under threat. Otherwise incredibly important species will be<br />
overlooked.<br />
Target species, habitat quality, etc.<br />
Whether or not these places get some form <strong>of</strong> formal protection. However, more <strong>of</strong>ten than not this<br />
tends <strong>to</strong> a decision <strong>of</strong> politics.<br />
• How would you best measure efficiency?<br />
Cost is definitely an important issue and man power needed <strong>to</strong> do an assessment. The ecoregional<br />
projects <strong>to</strong>ok and enormous amount <strong>of</strong> time and an enormous amount <strong>of</strong> money <strong>to</strong> complete the<br />
identification <strong>of</strong> priority <strong>areas</strong>. Again this is only the beginning <strong>of</strong> the process. A form <strong>of</strong> protection<br />
needs <strong>to</strong> be implemented.<br />
As for trying <strong>to</strong> think: are any <strong>of</strong> these processes quicker and cheaper than others? The HCV process<br />
can be quick and dirty or can be very laborious and intensive. It depends a great deal on the people<br />
performing the assessment. I think this can be the case for all <strong>of</strong> them. It depends on the available<br />
time and resources. However, there are always ways <strong>of</strong> implementing any process faster and or<br />
cheaper. It boils down <strong>to</strong> the quality <strong>of</strong> outcome required.<br />
• That would then reduce the efficiency or the quality <strong>of</strong> the outcome?<br />
Yes, it would. They are all fairly intensive processes. I don't think any process is any more or less<br />
efficient or better than the others.<br />
III<br />
Approaches & their requirements<br />
• A. Time: How much time is required for the implementation?<br />
The HCV work covers a lot more than the other <strong>approaches</strong>. This needs <strong>to</strong> be considered when<br />
comparing time and cost. The full HCV process requires a soil scientist, an ecologist, a hydrologist,<br />
an anthropologist and a social scientist. Thus, they take much longer and are more expensive, but<br />
one ends up <strong>with</strong> a more comprehensive output.<br />
• So you would say HCV takes longer than ERBC?<br />
I would not be able <strong>to</strong> say. It probably depends on the sort <strong>of</strong> scale looked at. ERBC looks at a<br />
landscape or even greater than landscape scale which will take a very long time, whereas an HCV<br />
assessment might only be a couple <strong>of</strong> thousand hectares <strong>of</strong> forest. The resolution <strong>of</strong> information is<br />
also very different. They are two very different things. ERBC can be very time-consuming. An<br />
ecoregional plan takes about two years <strong>to</strong> complete.<br />
151
A4-INTERVIEW PARTNER G<br />
• C. Human Resources: How many people are required <strong>to</strong> perform the <strong>approaches</strong>?<br />
One does not necessarily need so many people for ERBC. Also HCV work can be done <strong>with</strong> 3-4<br />
people: 1 soil scientist, 1 biologist and 1 social scientist.<br />
• The less people one needs in a team, the more information is already available?<br />
Not necessarily, the amount <strong>of</strong> people in a team is simply a reflection <strong>of</strong> the resources available. How<br />
much one has <strong>to</strong> spend on a project?<br />
• Would you say: <strong>to</strong> decrease the amount <strong>of</strong> people, you would decrease the quality <strong>of</strong> the<br />
assessment?<br />
It depends on who the people are and how much time and resources they have been given. It<br />
depends on how familiar they are <strong>with</strong> the framework they are following. Again, the quality <strong>of</strong> the<br />
output depends on the quality <strong>of</strong> the people.<br />
• But have all <strong>of</strong> the people you worked <strong>with</strong> been international experts? Or have you also<br />
worked <strong>with</strong> national experts?<br />
It is usually a combination <strong>of</strong> both. Particularly <strong>with</strong> the HCV concept looking at the social sciences<br />
and the biological aspects, as much as possible I always prefer <strong>to</strong> work <strong>with</strong> local people.<br />
One should try and work <strong>to</strong>gether <strong>with</strong> land managers so they can understand the process <strong>with</strong> the<br />
HCV concept or even the KBA approach. But the process is always led by an international expert.<br />
• And non-experts can they also be integrated in<strong>to</strong> the team?<br />
There should always be a consultation process where the results are discussed <strong>with</strong> local<br />
stakeholders. Other than that there is no situation were non-expert users are part <strong>of</strong> the process.<br />
• E. Purpose <strong>of</strong> the approach: How efficient is biodiversity conservation? Have you ever gone<br />
back and tried <strong>to</strong> determine the amount <strong>of</strong> species that have been conserved?<br />
No, the number <strong>of</strong> species is not really the measure <strong>of</strong> interest. A more appropriate measure would<br />
be: what were the goals <strong>of</strong> the area? If one simply looks at a list <strong>of</strong> species, one would go <strong>to</strong> a forest<br />
in Borneo and target a lowland dipterocarp forest (if the aim is <strong>to</strong> maximise a list <strong>of</strong> species). Thus,<br />
ignoring peat swamp and heath forest, as these are species poor. The only true measure <strong>of</strong> success<br />
<strong>to</strong> see whether a block <strong>of</strong> forest is still present. And <strong>to</strong> see whether any management changes have<br />
been implemented (i.e. has management acted on the made recommendations<br />
Those are the appropriate measures <strong>to</strong> look at. I have had relatively more success <strong>with</strong> the HCV<br />
concept (in terms <strong>of</strong>: has there been a change on the ground) than <strong>with</strong> anything else. This is<br />
because it is far more management driven.<br />
One does not just say which <strong>areas</strong> are important and must, therefore, be set aside as a strict<br />
conservation area. But one rather says which <strong>areas</strong> are important and this is how you can manage<br />
them.<br />
If my understanding <strong>of</strong> the KBA is correct, that point is undermined. One already has protected <strong>areas</strong><br />
and then one determines whether these are important.<br />
• F. Certification: How do you think market based initiatives fare in biodiversity conservation?<br />
Personally, I am a big supporter <strong>of</strong> them. I know this is an area where people have very strong<br />
opinions and in my opinion, they are very valuable.<br />
These days many individuals or organisations prefer <strong>to</strong> work <strong>with</strong> logging companies than <strong>with</strong> the<br />
government, as logging companies sometimes do a better job in protecting the forest than<br />
governments. These companies have the financial resources and the desire <strong>to</strong> protect, as they are<br />
protecting their own resources.<br />
The critical fac<strong>to</strong>r <strong>of</strong> working <strong>with</strong> industry is that it needs <strong>to</strong> part <strong>of</strong> a broader integrated management<br />
plan. Sustainably managed <strong>areas</strong> have <strong>to</strong> complement existing protected area systems. There<br />
should be sustainably managed <strong>areas</strong> and adjacent <strong>to</strong> this, large regions <strong>of</strong> protected <strong>areas</strong>.<br />
152
APPENDIX<br />
• Do you think market based initiatives are more effective than governance based <strong>approaches</strong>?<br />
In an ideal world, if the protected <strong>areas</strong> were managed well, they would be a much better way for<br />
protecting biodiversity. Not <strong>to</strong> say that the managed <strong>areas</strong> do not have biodiversity values. Protected<br />
<strong>areas</strong> are better <strong>of</strong>f surrounded by well-managed <strong>areas</strong>, instead <strong>of</strong> heavily disturbed forest. And<br />
managed <strong>areas</strong> are certainly going <strong>to</strong> work much more efficiently if they are adjacent <strong>to</strong> protected<br />
<strong>areas</strong> where there are sources <strong>of</strong> seed, animals and services.<br />
In reality, in Indonesia in the late 90's certified logging concessions were a far more efficient way <strong>of</strong><br />
conserving biodiversity than protected <strong>areas</strong>, because the protected area system had failed. That<br />
situation is now changing, protected <strong>areas</strong> are getting stronger again. This is one <strong>of</strong> the reasons why<br />
conservation organisations are now working very closely <strong>with</strong> logging concessions. This is leading <strong>to</strong><br />
the idea <strong>of</strong> working <strong>with</strong> other industries, like mining.<br />
IV<br />
Summary, evaluation & outlook<br />
• How meaningful can <strong>approaches</strong> used for identification <strong>of</strong> biodiversity relevant <strong>areas</strong> be for<br />
biodiversity conservation?<br />
The HCV concept uses a lot <strong>of</strong> information obtained by the other <strong>approaches</strong>. HCV <strong>areas</strong> are<br />
identified by looking at KBA, results <strong>of</strong> REAs, etc. so all <strong>of</strong> these are very useful. The <strong>approaches</strong> are<br />
incredibly useful in fund raising, raising awareness for priority <strong>areas</strong>, internal prioritization exercises.<br />
Do they directly affect conservation success? Indirectly yes, as they can be used <strong>to</strong> raise money,<br />
raise awareness and possibly affect political decisions as well. So they are needed, because<br />
otherwise we wouldn't know where <strong>to</strong> go. But the <strong>importance</strong> <strong>of</strong> the process can be overstated.<br />
• So then what does directly affect the success <strong>of</strong> conservation?<br />
The qualities and abilities <strong>of</strong> people. The degree <strong>of</strong> political support and the will <strong>of</strong> the countries,<br />
provinces, states; the politicians involved. Conservation boils down <strong>to</strong> politics; in terms <strong>of</strong> how good<br />
people are at actually doing things and then the government authorities and their willingness <strong>to</strong><br />
actually do what is needed. Occasionally those policies are influenced by outside institutions, but not<br />
in many situations. Actually in many situations government departments have reacted negatively <strong>to</strong><br />
an outsider. Not <strong>to</strong> say that one should not do it, but one has <strong>to</strong> be careful how it is set up.<br />
• So in your experience governance protected <strong>areas</strong> have been a success?<br />
I would not say that. There are still many situations where the paper parks statement is very true.<br />
Where they have failed is because <strong>of</strong> the failure <strong>of</strong> government institutions and the organisations<br />
working on the ground, it is not because <strong>of</strong> the failure <strong>of</strong> <strong>identify</strong>ing the <strong>importance</strong>.<br />
• Do you have any further points you would like <strong>to</strong> add?<br />
Like I said earlier on: I personally have a slightly different view <strong>of</strong> the HCV concept compared <strong>to</strong> the<br />
other <strong>approaches</strong>. People working <strong>with</strong> the HCV concept think that the main purpose <strong>of</strong> working <strong>with</strong><br />
it is <strong>identify</strong>ing <strong>areas</strong>, working <strong>with</strong> a polygon. I do not see that as having any value at all. What is<br />
much more important <strong>to</strong> us is: these are the values, this is where they are and this is what we can do<br />
<strong>to</strong> actually maintain those values. It is a management led process rather than a circle on a map which<br />
makes it a very powerful <strong>to</strong>ol.<br />
153
A4-INTERVIEW PARTNER H<br />
A4-8 Interview Partner H<br />
II<br />
Approaches & their characteristics<br />
Which <strong>approaches</strong> for <strong>identify</strong>ing biodiversity relevant <strong>areas</strong> do you know?<br />
I am familiar <strong>with</strong> several <strong>of</strong> the mentioned <strong>approaches</strong>, but not all <strong>of</strong> them. I am familiar <strong>with</strong> KBA<br />
and ERBC. I have been involved in several ecoregional processes in South America in the late 90s.<br />
The HCV concept is a very important concept that we are now dealing <strong>with</strong>. Industry standards seem<br />
<strong>to</strong> be very fond <strong>of</strong> the HCV concept. I am also very familiar <strong>with</strong> the REA.<br />
Could you list any strengths and weaknesses <strong>of</strong> the HCV concept?<br />
All <strong>of</strong> them have strengths and weaknesses, because nature is complex and these are instruments<br />
designed by humans <strong>to</strong> simplify what is inherently complex, in order <strong>to</strong> facilitate decision-making. So<br />
all <strong>of</strong> them are going <strong>to</strong> have weaknesses, but they also all have benefits. But the benefits do not<br />
necessarily all go in the same direction. Benefits will differ, for example the criteria adopted by the<br />
<strong>approaches</strong>, such as species based vs habitat based. There is no one <strong>to</strong>ol that solves everybody's<br />
problems. So the <strong>approaches</strong> are considered <strong>to</strong> be <strong>to</strong>ols that can be used <strong>to</strong>gether or independently,<br />
depending on the purpose.<br />
ERBC I have very much been involved in the use <strong>of</strong> that.<br />
REA has many favourable attributes.<br />
FSA: it tends <strong>to</strong> be a large species. It has not been embraced by large corporations or banks. It is not<br />
particularly adapted <strong>to</strong> spatial planning and is not easily replicable, as it does not have large data<br />
bases, like the KBA data base. The FSA is ad hoc, e<strong>special</strong>ly <strong>with</strong> the landscape.<br />
HCV has clearly defined criteria that any consultant or biologist can use <strong>to</strong> apply <strong>to</strong> a specific<br />
landscape.<br />
• Which criteria would be important for you, if you were <strong>to</strong> compare these <strong>approaches</strong>?<br />
The <strong>approaches</strong> are all taking place in political environments. So one looks for the <strong>to</strong>ol that fits one's<br />
needs, in order <strong>to</strong> pursue a specific conservation agenda. If one has a park or a landscape and one<br />
would like <strong>to</strong> create a protected area or if one wants <strong>to</strong> deal <strong>with</strong> an environmental impact from a<br />
highway or a gas line, then one chooses an instrument depending on the arguments it can deliver <strong>to</strong><br />
create a conservation strategy. Ideally, one would use a combination <strong>of</strong> them all. However, from a<br />
strictly scientific point <strong>of</strong> view, none <strong>of</strong> them are appropriate in my opinion.<br />
• Why would you say that?<br />
Because they are preconceived and when one does research one wants <strong>to</strong> explore attributes most<br />
appropriate for any given situation.<br />
Each one <strong>of</strong> them has weaknesses. ERBC are artificial polygons drawn on<strong>to</strong> a map, nature does not<br />
conform <strong>to</strong> polygons. Nature is about gradients. It goes from wet-dry, high-low and cold-warm. So<br />
dividing nature in<strong>to</strong> ecoregions is an entirely artificial classification. One does not want <strong>to</strong> be<br />
constrained by an artificial classification when looking at nature.<br />
KBA, for instance, are based on data bases. All KBA are based on observations and/or collections.<br />
Some scientist saw this species there. What about 95% <strong>of</strong> the planet that has not been seen by a<br />
biologist. Should one base a future conservation strategy on what someone saw years ago? In my<br />
opinion, KBA are not good for conservation planning or for research looking far in<strong>to</strong> the future. What<br />
they are very good at, is for policy applications.<br />
• So do you know any other methods that are good as conservation planning <strong>to</strong>ols?<br />
One should always look at it from the first principles. One has <strong>to</strong> understand biodiversity, the<br />
distribution <strong>of</strong> biodiversity, endemism (the KBA approach is good about that) and the threat <strong>to</strong><br />
species. These have been worked in<strong>to</strong> KBA, but KBA are limited by the fact that they are based on<br />
154
APPENDIX<br />
past observations. It would be better <strong>to</strong> look at patterns <strong>of</strong> biodiversity and patterns <strong>of</strong> physical and<br />
climatic attributes that can be correlated <strong>to</strong> biodiversity. For example, high rainfall <strong>areas</strong> are most<br />
diverse, mountain <strong>to</strong>ps are most diverse. If one is considering climate change, one has <strong>to</strong> make sure<br />
a gradient that species can respond <strong>to</strong>, is available. So I would use a methodology based on the first<br />
principles <strong>of</strong> science and biodiversity patterns, in order <strong>to</strong> create a coherent framework using all <strong>of</strong><br />
the scientific <strong>to</strong>ols. Thus, being able <strong>to</strong> come up <strong>with</strong> a rational plan for a specific landscape.<br />
Conservation and the final analysis are at a landscape scale. All these global <strong>to</strong>ols have their<br />
limitations.<br />
The HCV concept is the most adaptable and this is probably why it is being adopted by so many<br />
corporations.<br />
• How would you best measure efficiency?<br />
For KBA or data bases, one plugs the information in<strong>to</strong> a GIS system and an answer is produced. For<br />
ERBC one goes through a process which is perhaps not as efficient.<br />
III<br />
Approaches & their requirements<br />
• A. Time: Could you give me an estimate <strong>of</strong> how long one <strong>of</strong> these <strong>approaches</strong> takes <strong>to</strong><br />
implement?<br />
It depends on the scale. KBA are a global data base and they are still not complete. In addition, they<br />
are predominantly just birds, frogs and insects. What about plants? It would take centuries <strong>to</strong> build up<br />
a KBA data base on plants. Although in a place like Europe which is data rich, important plant <strong>areas</strong><br />
exist. So, it will work in Europe. But that <strong>to</strong>ok 200 years <strong>to</strong> compile the particular data base on plant<br />
species. Can we wait 200 years for the Amazon? I think not.<br />
It depends on the taxa which is one <strong>of</strong> the limitations <strong>of</strong> the KBA approach. It is biased, as the<br />
strategy is based on the available data. Theoretically, ERBC deals <strong>with</strong> insects, as they deal <strong>with</strong><br />
assemblages <strong>of</strong> species. REAs allow one <strong>to</strong> address insects, assuming one can find experts <strong>to</strong><br />
<strong>identify</strong> insects.<br />
So again there are always trade-<strong>of</strong>fs, using the <strong>to</strong>ol most appropriate.<br />
In the final analysis, it is not based on data criteria, but rather on political criteria.<br />
• B. Cost: Could you mention something about the cost <strong>to</strong> implement some <strong>of</strong> the <strong>approaches</strong>?<br />
KBA are free. One plugs all the data in<strong>to</strong> the computer and out comes the result. This is a big<br />
advantage.<br />
The HCV concept take time, one has <strong>to</strong> go in<strong>to</strong> the field and talk <strong>to</strong> people. So that is a little different.<br />
The FSA, personally, I think, is a waste <strong>of</strong> time.<br />
The REA is the approach <strong>to</strong> generate the best data for an area. If you really want <strong>to</strong> <strong>identify</strong> the<br />
potential impacts, you take the time and do a field survey. The REA is probably the most appropriate<br />
for looking at biodiversity. Although one might want <strong>to</strong> combine a REA <strong>with</strong> something like the HCV<br />
concept, in order <strong>to</strong> look at aspects like water, carbon, etc.<br />
• C. Human Resources: Which approach would be the most labour intensive?<br />
That would clearly be a REA.<br />
• D. Data requirements: Would the data requirements also be most intensive for a REA?<br />
One creates data <strong>with</strong> a REA. Whereas for the KBA approach and ERBC approach this has already<br />
been done.<br />
155
A4-INTERVIEW PARTNER H<br />
• E. Purpose <strong>of</strong> the approach: How efficient are the <strong>approaches</strong> in conserving biodiversity?<br />
One can take any one <strong>of</strong> these <strong>approaches</strong> and use it for one's own benefit. HCV are probably the<br />
most useful. They are also the most easy <strong>to</strong> implement. One can use the HCV criteria for basically<br />
any landscape. One can place HCV <strong>areas</strong> anywhere one wants <strong>to</strong>. I think that is what is going on<br />
<strong>with</strong> the concept which can either be a limitation or an advantage, depending on which way one looks<br />
at is and which goals one has.<br />
KBA are good at conserving species, but they are not good at looking at where there might be<br />
potential KBA. The KBA methodology has a modelling component <strong>to</strong> show where they should exist.<br />
So they are probably trying <strong>to</strong> improve that. The best available thing is expert knowledge, someone<br />
who knows the area, who knows the plants, animals and they will tell you what <strong>to</strong> do.<br />
• F. Certification: Do you think market based initiatives are more effective than governance<br />
based <strong>approaches</strong>?<br />
HCV is a methodology, but not a market based approach. It is being used by private enterprises, but<br />
I would not classify it as a market based approach.<br />
IV<br />
Summary, evaluation & outlook<br />
• How meaningful are these <strong>approaches</strong> for <strong>identify</strong>ing new <strong>areas</strong> important for biodiversity<br />
conservation?<br />
Very important. The 90s was the decade <strong>of</strong> biodiversity and this coming decade is the decade <strong>of</strong><br />
ecosystem services. I think biodiversity will take a back seat <strong>to</strong> that, even though many <strong>areas</strong> <strong>with</strong><br />
little available data still exist. It is certainly not going <strong>to</strong> be a priority.<br />
156
APPENDIX<br />
A4-9 Interview Partner I<br />
II<br />
Approaches & their characteristics<br />
• Which <strong>approaches</strong> do you know?<br />
The <strong>approaches</strong> that I am most familiar <strong>with</strong> are the ERBC approach, FSA and REA and I know<br />
a little about the KBA approach. I’m not really familiar <strong>with</strong> the HCV concept.<br />
• For the <strong>approaches</strong> that you know: can you mention any strengths or weaknesses?<br />
KBA approach and FSA: they both assume a condition <strong>of</strong> stationarity which implies that the<br />
future will be indistinguishable from the past. So <strong>with</strong> habitats and systems changing rapidly due<br />
<strong>to</strong> climate change, those identified values may no longer be present over a short time period. So<br />
these <strong>approaches</strong> are not very representative. Under climate change they run a high risk <strong>of</strong> not<br />
meeting their goals. However, they both only require a modest investment <strong>of</strong> resources (a<br />
positive on that side).<br />
• As compared <strong>to</strong> the REA or ERBC?<br />
Yes, but one last comment on the KBA approach and the FSA is that if they capture ecological<br />
processes, it is by chance and not by design.<br />
ERBC: in my view, is the most comprehensive and most representative in terms <strong>of</strong> trying <strong>to</strong><br />
capture and maximize the different scales and different conservation targets <strong>of</strong> biodiversity. It is<br />
probably the most representative approach as it looks at several different scales: the species<br />
level, the natural community level and then the biophysical level. So one does not place all ones<br />
eggs in one basket. It probably does the best job <strong>of</strong> delineating important ecological processes<br />
and whole ecosystems.<br />
The downside is that it is quite resource intensive: data wise, personnel wise and expertise wise.<br />
It <strong>of</strong>ten results in large networks <strong>of</strong> ecosystems difficult <strong>to</strong> prioritize.<br />
• Is it correct that a GAP analysis is performed <strong>to</strong> prioritise large networks?<br />
That is one way <strong>to</strong> do it. Even if one has prioritised, one still ends up <strong>with</strong> large portions <strong>of</strong> the<br />
landscapes where it is difficult <strong>to</strong> determine where <strong>to</strong> start first. A GAP analysis gives one an idea<br />
<strong>of</strong> where <strong>of</strong>ficial protection may be lacking, but it will not <strong>identify</strong> <strong>areas</strong> most feasible for<br />
conservation. For instance, which <strong>areas</strong> have the right enabling conditions? Where stakeholders<br />
are motivated <strong>to</strong> make the necessary changes, where one has funding and political support <strong>to</strong><br />
make those changes. So one still will need <strong>to</strong> do a feasibility analysis, once a GAP analysis has<br />
been performed, thus, adding <strong>to</strong> the time and cost.<br />
REA: this really depends on what is meant by rapid. Several REAs have been performed <strong>to</strong> fill in<br />
data gaps for ERBC planning efforts. They were very successful, they were rapid and much less<br />
costly relative <strong>to</strong> the overall ERBC approach, but they were used <strong>to</strong> augment an already fairly<br />
rich data source. For example, in the Apache Highlands, considerable data for about 60% <strong>of</strong> the<br />
ecoregion existed and for the remaining 40% absolutely no data existed. Thus, an REA was<br />
conducted <strong>to</strong> develop better data. This assessment <strong>to</strong>ok approximately 14 months which is much<br />
longer than what anyone would consider a typical rapid assessment. When compared <strong>to</strong> the<br />
overall end result, the REA was only a small portion <strong>of</strong> resources. One advantage <strong>of</strong> the REA<br />
was that, at the end <strong>of</strong> the process, a much better and overall knowledge <strong>of</strong> the area was<br />
obtained. Thus, it proved <strong>to</strong> be a very good data source for planning and indicated a way <strong>to</strong><br />
develop stakeholders and a constituency around the area. So in the traditional sense a REA is<br />
going <strong>to</strong> be best for large countries or continental <strong>areas</strong> <strong>with</strong> very little available data and where<br />
one does not want <strong>to</strong> rely on modelling exercises. That is its traditional use - very good and very<br />
appropriate. We have a small scale example <strong>of</strong> that, where we knew nothing about an area and<br />
157
A4-INTERVIEW PARTNER I<br />
so we used it <strong>to</strong> supplement what otherwise would have been considered a very rich data<br />
source.<br />
REAs are excellent <strong>to</strong> build awareness and <strong>to</strong> build a constituency about an area which is<br />
probably fairly important, but <strong>with</strong> few people knowing much about it.<br />
• With regard <strong>to</strong> the criteria that I have used <strong>to</strong> perform the strength - weakness analysis, can<br />
you think <strong>of</strong> any criteria that you would use <strong>to</strong> compare the various <strong>approaches</strong>?<br />
One question that should be asked: what is the goal <strong>of</strong> the planning exercise? Is it a university<br />
exercise or is it going <strong>to</strong> play a role in implementation? The answer should then be used <strong>to</strong> guide<br />
the values, and the amount <strong>of</strong> resources that will go in<strong>to</strong> it.<br />
For example; the intended users’ sub-criterion: here there will be large differences, depending on<br />
the setting. For instance, in a university setting, one may place more effort in translation,<br />
whereas if one performs the approach for implementation time for translation will be available as<br />
one works <strong>with</strong> it for the entire time.<br />
Many <strong>of</strong> the intended users do not have the facility or the technical know-how <strong>to</strong> understand the<br />
bulk <strong>of</strong> the work. Thus, the translation <strong>of</strong> results is extremely important and will dictate whether or<br />
not the plan ultimately gets implemented. The ability <strong>of</strong> others <strong>to</strong> understand and <strong>to</strong> view the<br />
outcome is crucial.<br />
• How would you best measure efficiency?<br />
This will be cost and time against the goal. So it will really depend on the goal, <strong>with</strong> cost and time<br />
being primary fac<strong>to</strong>rs. Methods are not as important or much less important if one does not<br />
produce a result in a time that matters.<br />
III<br />
Approaches & their requirements<br />
• A. Time: As an estimate, how much time is required for the implementation?<br />
The Sinoran Desert <strong>to</strong>ok 24 months.<br />
The Apache Highlands <strong>to</strong>ok 18 months.<br />
• In comparison <strong>to</strong> that, how long does the FSA normally take?<br />
As an estimate it could be completed in about a quarter <strong>of</strong> the time. However, they are normally<br />
much smaller in size.<br />
The ecoregions can be 10s <strong>of</strong> millions <strong>of</strong> acres. A FSA has never been performed at that scale. It<br />
will be done at a fraction <strong>of</strong> the time and cost, as one deals <strong>with</strong> a much smaller universe <strong>of</strong><br />
conservation targets and criteria. Whereas ERBC normally deals <strong>with</strong> many data sources for the<br />
models.<br />
• B. Cost: How much does ERBC cost?<br />
The Sinoran Desert cost 300,000 US$ in 2000.<br />
The Apache Highlands cost ~250,000 US$ in 2004 (less time and this was the second<br />
assessment performed).<br />
• C. Human Resources: What human resources are required for the ERBC approach?<br />
It is very resource intensive, both for data, expertise and money <strong>to</strong> pay for people's time and in<br />
some cases data. For example, the cost <strong>of</strong> a project will increase if one wants <strong>to</strong> ensure that the<br />
project is a binational effort, as if <strong>of</strong>ten the case <strong>with</strong> ERBC. Any binational effort will obviously<br />
improve the quality <strong>of</strong> the outcome.<br />
158
APPENDIX<br />
• So as a general statement could one say that by decreasing the cost, one would<br />
compromise or sacrifice the quality <strong>of</strong> the outcome?<br />
This would depend on whether one is in a university context or a conservation context. In a<br />
university context, it may or may not sacrifice the outcome. But in a conservation context where<br />
the goal is <strong>to</strong> <strong>identify</strong> and then implement the results, it definitely would.<br />
• E. Purpose <strong>of</strong> the approach: How could one best compare the outcome <strong>of</strong> <strong>approaches</strong>?<br />
That is an extremely challenging question <strong>to</strong> answer, because typically when ERBC planning<br />
exercise started, they were intended <strong>to</strong> guide the work for 10-20 years. However, implementation<br />
is still ongoing. For example, the Sinoran Desert plan was completed around 2000 and then one<br />
started working <strong>with</strong> local jurisdiction or county <strong>to</strong> raise money <strong>to</strong> buy that land. And in 2004 a<br />
public funding election for conservation raised for 174 mill US$. This money was all spent by July<br />
09. Over 140,000 acres have been purchased for conservation which seems a lot. But if one<br />
compares this <strong>to</strong> the 29 mill acres identified for conservation, it is only about 30%. Maybe 10 mill<br />
acres was already conserved in a suitable fashion, so we still had 2/3 <strong>of</strong> the way has already<br />
been gone.<br />
• If one goes <strong>to</strong> another part <strong>of</strong> the world...<br />
There is not enough money <strong>to</strong> buy everything needed for conservation, as land is so expensive<br />
in the US.<br />
The question on efficiency has nothing <strong>to</strong> <strong>with</strong> how the plan was obtained. It has everything <strong>to</strong> do<br />
<strong>with</strong> implementation which requires a <strong>to</strong>tally different set <strong>of</strong> expertise than the people who<br />
actually do the science behind the planning.<br />
• So more governance based expertise?<br />
Right, it is governance based, it is politics, it is working <strong>with</strong> communities, it is working <strong>with</strong><br />
agencies that may have conflicting missions. Efficiency should be based on science.<br />
IV<br />
Summary, evaluation & outlook<br />
• How meaningful can <strong>approaches</strong> used for the identification <strong>of</strong> biodiversity relevant <strong>areas</strong> be<br />
for biodiversity conservation?<br />
It can be very valuable, because firstly efficiency and the cost-benefit ratio are critical. Again, if<br />
one cannot produce something in the time required, then it will be <strong>of</strong> little use. One either wastes<br />
resources or one does not achieve the goals.<br />
Secondly, if one <strong>of</strong> your conclusions shows there is a difference between implementation and the<br />
criteria required for evaluation. So, how well it does in comparison <strong>to</strong> the science part <strong>of</strong> it -<br />
<strong>of</strong>ficially can it <strong>identify</strong> important conservation <strong>areas</strong>? That would be a very important<br />
contribution. This is not very well unders<strong>to</strong>od, as these methods originated from the academic<br />
industry or combinations there<strong>of</strong>. Scientifically it is intensive and we have come so far. It is<br />
remarkable what can be done now, but what is needed <strong>to</strong> implement these results requires other<br />
technologies, other expertise and science. In addition, people who understand how <strong>to</strong> work in<br />
other environments such as governance are also required. So it requires much more<br />
collaboration occurring over much longer time scales than the actual scientific planning does and<br />
the more and more the scientific community can understand how their work fits in<strong>to</strong> that picture,<br />
the better <strong>of</strong>f for everyone.<br />
159
A4-INTERVIEW PARTNER J<br />
A4-10 Interview Partner J<br />
II<br />
Approaches & their characteristics<br />
• Which <strong>approaches</strong> do you know?<br />
I am somewhat familiar <strong>with</strong> HCV which is used quite a bit in Indonesia. I have done REAs and quite<br />
a few ecoregional assessments.<br />
• For the <strong>approaches</strong> that you know: can you mention any strengths or weaknesses?<br />
ERBC and REA have two purposes or desired outcomes. REA, as the name implies, is pretty<br />
superficial, rapid and wholly dependent on the team composition chosen for the assessment; the<br />
amount <strong>of</strong> time available <strong>to</strong> conduct the assessment and the available or required technology. For<br />
instance pho<strong>to</strong> traps in conjunction <strong>with</strong> actual trappings or in contrast, visual sightings and call<br />
identifications. The degree <strong>to</strong> which technology can assist assessments really influences the<br />
outcome value.<br />
As far as ERBC, among all the <strong>approaches</strong> you have looked at, ERBC tends <strong>to</strong> be the most<br />
comprehensive and the most useful in terms <strong>of</strong> follow up conservation implementation. The<br />
weaknesses primarily are the degree <strong>of</strong> superficiality, the repetitiveness, the cost and amount <strong>of</strong><br />
resources required <strong>to</strong> conduct an assessment.<br />
• Which criteria would you use <strong>to</strong> compare the various <strong>approaches</strong>?<br />
As a conservation practitioner one should ask: what is the ultimate goal <strong>of</strong> these assessments? Why<br />
one is chosen over another <strong>of</strong>ten depends on the purpose <strong>of</strong> the outcome. Is it <strong>to</strong> protect new <strong>areas</strong>,<br />
improve protection in existing <strong>areas</strong> or is it simply <strong>to</strong> refine existing conservation programmes. Is it <strong>to</strong><br />
prioritize the work <strong>of</strong> an organization in a newly identified area or region <strong>of</strong> the world in which the<br />
organization wants <strong>to</strong> work? This is very dependent on the desired outcome. How is that information<br />
used for actual conservation? Just the identification alone is not enough. What the next step is, the<br />
far more important than the identification process. Does one start lobbying for new protected <strong>areas</strong> <strong>to</strong><br />
be designated? Does one start lobbying for more funding <strong>to</strong> be dedicated <strong>to</strong> these <strong>areas</strong> for<br />
appropriate management actions or res<strong>to</strong>ration programmes <strong>to</strong> be implemented?<br />
Example Indonesia: HCV assessments have been used <strong>to</strong> <strong>identify</strong> appropriate industries <strong>to</strong> work <strong>with</strong><br />
in order <strong>to</strong> manage forest in a more sustainable way for the target species. Whether those are<br />
Orangutans, bird guilds or aquatic species like the Irrawaddy dolphin. These can be very effective<br />
<strong>to</strong>ols in helping an organisation refine what it wants <strong>to</strong> do, where <strong>to</strong> focus resources, where <strong>to</strong> make<br />
the investment. To get the biggest bank for the buck, as is said.<br />
• How would you best measure efficiency?<br />
Efficiency again, if one looks at time and cost/ expenses, the usefulness <strong>of</strong> the result will depend on<br />
aim <strong>of</strong> the assessment. So efficiency is very dependent on why one implements the assessment and<br />
the desired outcome. But in general, ERBC tends <strong>to</strong> be the most effective in <strong>identify</strong>ing priority <strong>areas</strong><br />
for conservation and <strong>to</strong> get the full representation at every level, genetic level, species level, natural<br />
community level <strong>of</strong> ecological and biodiversity representation in the planning area. It is also a very<br />
good lead-in for the next phase <strong>of</strong> conservation planning which is much more specific for each <strong>of</strong> the<br />
priority <strong>areas</strong> that are identified.<br />
A REA is very useful in <strong>areas</strong> that are under urgent threat. For example, <strong>areas</strong> that have been<br />
included in a forest plan for cutting <strong>with</strong>in the next ten years, or <strong>to</strong> make sure that something<br />
ecologically or biologically unique is not lost, either at a regional or global scale <strong>with</strong>in <strong>areas</strong> destined<br />
<strong>to</strong> be degraded or converted. Those can be really effective, quick and dirty assessments <strong>to</strong> find out<br />
whether or not something is going <strong>to</strong> be lost by the impending activity in that area.<br />
160
APPENDIX<br />
HCV designation - the jury is still out <strong>to</strong> whether or not these are effective long-term. The light in<br />
which this method is being used depends very strongly on the industry it has been adopted by (eg.<br />
mining, timber, etc.). This will reflect in the efficiency <strong>of</strong> the approach. The implementing<br />
organisation's relationship <strong>with</strong> the relevant industry and whether these industries are being forced <strong>to</strong><br />
adopt the HCV concept will also affect the efficiency. Additionally, the companies resources they<br />
have available <strong>to</strong> implement the concept and the appropriate management scenarios for sustaining<br />
biodiversity identified in the HCV <strong>areas</strong>.<br />
The focal species approach can be efficient, if the right focal species is chosen. There is a huge<br />
assumption that by focusing on those few focal species, one sweeps up all other and unknown<br />
species under one umbrella.<br />
It is usually a good choice <strong>to</strong> select an approach that looks at the whole watershed. As this captures<br />
many different levels <strong>of</strong> ecological process and function, in contrast <strong>to</strong> the focal species approach<br />
where individual species contained <strong>with</strong>in the landscapes are captured.<br />
• Is this scale similar <strong>to</strong> the ERBC approach?<br />
ERBC captures it at a higher scale. One has multiple watersheds, multiple landscapes which are all<br />
weighed against each other. In the cases <strong>of</strong> several watersheds and similar biodiversity components,<br />
species and natural communities, one can rank these based on their existing level <strong>of</strong> degradation, or<br />
on their perceived viability due <strong>to</strong> other threats on the landscape. Thus, ERBC is at a very<br />
appropriate scale for capturing multiple examples <strong>of</strong> what is assumed or projected <strong>to</strong> be viable<br />
natural communities and, or habitats required <strong>to</strong> maintain species over the long term. In my view, this<br />
is the most efficient and effective way for performing an analysis, if one has the luxury <strong>of</strong> time. If one<br />
does not, due <strong>to</strong> threats looming on the horizon that either are already affecting the landscape or are<br />
poised <strong>to</strong> do so in the next year or two, then one would chose something much more rapid.<br />
• And also if you have the luxury <strong>of</strong> enough financial resources?<br />
Right exactly<br />
• May I just go back <strong>to</strong> what you said about that ERBC covers all levels <strong>of</strong> biodiversity? I have<br />
struggled <strong>to</strong> find any literature on actually capturing the genetic level. The way I have<br />
unders<strong>to</strong>od it, is that this is captured indirectly through due <strong>to</strong> the protection <strong>of</strong> large<br />
landscapes which conserves genetic diversity.<br />
One <strong>of</strong> the things we do in ERBC (which is done in none <strong>of</strong> the other <strong>approaches</strong>) is that we divide<br />
the ecoregion in<strong>to</strong> 4-6 subregions based geographically on an already published distribution. For<br />
instance, in the Mojave Desert both desert <strong>to</strong>r<strong>to</strong>ise genetic information which had already been<br />
gathered and Joshua Tree Woodland information were utilized <strong>to</strong> divide the ecoregion in<strong>to</strong> 6<br />
subregions (which are roughly based on the compass points). Then one sets the same goals for<br />
each <strong>of</strong> these subregions. For instance, if one wants <strong>to</strong> capture 30% <strong>of</strong> all populations <strong>of</strong> desert<br />
<strong>to</strong>r<strong>to</strong>ise in the Mojave ecoregion, the same goal exists for the 6 subregions. So genetic diversity for<br />
that specific species is captured and at the same time one assumes that the genetic diversity <strong>of</strong> other<br />
species is also captured. The assumption rests on the diverse nature <strong>of</strong> the ecoregion comparing<br />
North <strong>to</strong> South and East <strong>to</strong> West and the Central portion. So those peripheral differences at the<br />
genetic level are captured. When one starts talking about the interface <strong>of</strong> one ecoregion <strong>to</strong> another,<br />
then one starts talking about having difference in soil type, climatic differences, elevation, latitude,<br />
longitude, things like that. Thus, one feels fairly confident that genetic diversity <strong>of</strong> individual species is<br />
captured. However, genetic diversity <strong>of</strong> the natural communities occurring throughout the ecoregion<br />
is captured by capturing the full representation across the ecoregion.<br />
161
A4-INTERVIEW PARTNER J<br />
III<br />
Approaches & their requirements<br />
• B. Cost: How much do the <strong>approaches</strong> cost?<br />
REA: is <strong>to</strong>tally dependent on how much land is being assessed, how many people are involved and<br />
the amount <strong>of</strong> required technology. So, as far as I know, there is no ball park figure. It could cost 10s<br />
<strong>of</strong> 1000s <strong>of</strong> US$ or it could be millions <strong>of</strong> US$, depending on how many resources are available. It<br />
also depends on the size <strong>of</strong> the assessment area, thus, making it difficult <strong>to</strong> pin point.<br />
ERBC, one has a fairly good idea <strong>of</strong> how long they take and how much they cost. In the US, they<br />
take about 2 years, using standard methodology and cost about 200,000 US$. International they<br />
have run from 150,000-350,000 US$. With an example in China which cost almost 2mill US$ and<br />
<strong>to</strong>ok 3 years. This always depends on the size <strong>of</strong> the assessed area and the amount <strong>of</strong> required<br />
people.<br />
• E. Purpose <strong>of</strong> the approach: How efficient do you think these <strong>approaches</strong> are in conserving<br />
biodiversity?<br />
I don't think any <strong>of</strong> them conserve biodiversity. All they do is <strong>identify</strong> it. The next step is: how is the<br />
information used <strong>to</strong> conserve biodiversity. That is the difficult part, <strong>identify</strong>ing is the easiest step in<br />
the whole conservation process. It depends on how an individual conservation organisation, a<br />
government or a natural resource <strong>of</strong>fice is conducting the assessment. What is done <strong>with</strong> the<br />
information afterwards will or will not conserve biodiversity. For instance, legally designating<br />
protected <strong>areas</strong> or funnelling more money <strong>to</strong> improve management <strong>of</strong> already protected <strong>areas</strong> as<br />
these <strong>areas</strong> were <strong>of</strong>ten set aside for reasons other than biodiversity, such as aesthetic purposes,<br />
his<strong>to</strong>rical, cultural reasons. They would therefore, not take in<strong>to</strong> account what is necessary for<br />
viability, function and process on the landscape-scale. So none <strong>of</strong> the <strong>approaches</strong> are effective or<br />
efficient at conservation implementation, as this is not their goal. Their goal is <strong>to</strong> <strong>identify</strong> <strong>areas</strong> for<br />
subsequent implementation and conservation action. Depending on what the outcome should be<br />
used for, one sets specific goals prior <strong>to</strong> the assessment. For instance, in Mongolia: the GAP<br />
assessment - another system <strong>of</strong>ten used <strong>to</strong> <strong>identify</strong> new <strong>areas</strong> for protected status usually <strong>with</strong>in the<br />
political unit (sometimes <strong>with</strong>in the ecological unit), usually at the state or national level. Here one<br />
looks at the entire suit <strong>of</strong> existing protected <strong>areas</strong> and sees what they capture and what they are<br />
missing. Hence the name GAP. Then one uses the information <strong>to</strong> <strong>identify</strong> new <strong>areas</strong> <strong>to</strong> add <strong>to</strong> the<br />
existing conservation system. This is happening Mongolia <strong>with</strong> grasslands. The GAP assessment<br />
has just been completed and a full ERBC is planned <strong>to</strong> <strong>identify</strong> where those new protected <strong>areas</strong><br />
should be and also the type <strong>of</strong> protected area. This also being an important question. Six different<br />
levels <strong>of</strong> IUCN categories exist, thus depending on the desired outcome the designation according <strong>to</strong><br />
the IUCN categories will differ (i.e. national park or national recreation). This again will dictate the<br />
amount <strong>of</strong> management required, ranging from only fencing an area and saying this is <strong>of</strong>f-limits <strong>to</strong><br />
development <strong>to</strong> actively res<strong>to</strong>ring habitats and species management.<br />
• May I just move back <strong>to</strong> this GAP assessment quickly? The way I unders<strong>to</strong>od it, is that it is<br />
used, in KBA and ERBC <strong>approaches</strong>, after <strong>identify</strong>ing KBA or ecoregions and then the GAP<br />
analysis was performed?<br />
Not necessarily. KBA as a <strong>to</strong>ol can be synonymous <strong>with</strong> a GAP assessment. One identifies national<br />
biodiversity sites based on their <strong>importance</strong> in maintaining their population <strong>of</strong> species which can be<br />
integrated in<strong>to</strong> a GAP assessment. It is not necessarily tied <strong>to</strong> ERBC. Ideally one does them<br />
simultaneously providing on has the correct team and resources. For instance, in Borneo a<br />
biodiversity assessment (similar <strong>to</strong> the definition <strong>of</strong> a KBA) <strong>of</strong> the whole island was performed using<br />
ERB methodology and from that a GAP assessment was produced. Part <strong>of</strong> the assessment was <strong>to</strong><br />
determine whether the existing level <strong>of</strong> protection was sufficient. Were the species and natural<br />
162
APPENDIX<br />
community types conserved by the existing protected area types? What more needs <strong>to</strong> be<br />
incorporated in<strong>to</strong> the existing system <strong>of</strong> protection? What is missing entirely from the existing system<br />
<strong>of</strong> protected <strong>areas</strong>? So GAP and ERBC can go hand-in-hand, but they are not interchangeable. GAP<br />
assessment does something very different <strong>to</strong> an ERB assessment and one can perform an ERBC<br />
assessment <strong>with</strong>out a GAP assessment. But <strong>of</strong>ten, as threats and current levels <strong>of</strong> protection are<br />
analysed, a GAP is incorporated in<strong>to</strong> an ERBC assessment. However, GAP can be done separately.<br />
They are typically based on things other than ecological defined <strong>areas</strong>. They are more politically<br />
based, state, local county, national level, not based on ecologically defined <strong>areas</strong>.<br />
• May I just ask one question about threats? How do you define the threat thresholds?<br />
It is done on a threat by threat basis. One can use satellite imagery <strong>to</strong> <strong>identify</strong> things like road<br />
networks, human population density, forest fire his<strong>to</strong>ry, use national records on mining leases/<br />
permits, the degree <strong>to</strong> which these leases have been put in<strong>to</strong> action (i.e. work has begun or when it<br />
is scheduled <strong>to</strong> begin). All <strong>of</strong> this information goes in<strong>to</strong> a threat assessment. It is very important in<br />
ERBC <strong>to</strong> choose <strong>areas</strong> that maybe threatened, but are not threatened <strong>to</strong> the point that they are not<br />
viable in the long term. So one would not choose <strong>to</strong> work in an area that has an irreversible threat.<br />
Nothing can be done about that. Additionally, one probably would not choose <strong>to</strong> invest resources in<br />
an area which might be biologically diverse, but if it is not threatened, it would not benefit much from<br />
further resource allocation. Thus, ERBC identifies <strong>areas</strong> that may be highly threatened, but where<br />
something can be done <strong>to</strong> reduce that threat. Or <strong>to</strong> res<strong>to</strong>re <strong>areas</strong> that have been degraded by a<br />
threat, such as logging, fire damage, road building (which can be removed). The levels <strong>of</strong> threat are<br />
determined on the degree <strong>to</strong> which the threat is isolated <strong>to</strong> a specific footprint or whether the adverse<br />
effects <strong>of</strong> the footprint go beyond the footprint. For instance, cities and <strong>to</strong>wns have a discrete<br />
footprint in the landscape, but the effects <strong>of</strong> those cities and <strong>to</strong>wns go for miles and miles beyond that<br />
footprint. It is like a spider's web going out from the heart <strong>of</strong> the city or <strong>to</strong>wn, in terms <strong>of</strong> the habitat<br />
degradation. This degradation can be ranked qualitatively, low, medium, high, from the source <strong>of</strong> that<br />
threat whether this is human habitation, coal mine or gas field. Thus, zones <strong>of</strong> threat degree or zones<br />
<strong>of</strong> degradation emanating out from the centre <strong>of</strong> each source <strong>of</strong> threat are established. In this way<br />
landscapes <strong>with</strong>in an ecoregion can be ranked in order <strong>to</strong> pinpoint the area <strong>with</strong> lowest ecological<br />
cost <strong>to</strong> work in.<br />
• F. Certification: In your opinion, how do market based initiatives fare in biodiversity<br />
conservation?<br />
They sound good, and they look good on paper. Much like HCV designations, I think that the jury is<br />
still out on whether or not they actually result in long-term conservation, as markets fluctuate.<br />
Additionally, the success <strong>of</strong> such initiatives depends a lot on the level <strong>of</strong> governance, the system <strong>of</strong><br />
law enforcement existing in the area <strong>of</strong> interest. Also the degree <strong>to</strong> which one can suppress the<br />
human desire <strong>to</strong> cheat <strong>with</strong> enough incentive <strong>to</strong> <strong>of</strong>f-set this, will determine how effective the marketbased<br />
approach will be. If there is a short cut or a way for the black market <strong>to</strong> exist, then it will<br />
happen. Unless the legal system is strong enough and disincentives exist <strong>to</strong> prevent short-cutting.<br />
Thus, the success differs case by case, depending on the country or state or region in which these<br />
<strong>approaches</strong> are implemented. Again they sound good and they are really popular right now, but I<br />
think it is really going <strong>to</strong> be dependent on the legal system <strong>to</strong> enforce them.<br />
163
A4-INTERVIEW PARTNER J<br />
IV<br />
Summary, evaluation & outlook<br />
• How meaningful can <strong>approaches</strong> used for identification <strong>of</strong> biodiversity relevant <strong>areas</strong> be for<br />
biodiversity conservation?<br />
• Do you think efforts should rather concentrate on existing biodiversity initiatives rather than<br />
<strong>identify</strong>ing new <strong>areas</strong>?<br />
No, because in the past, like the designation <strong>of</strong> the protected <strong>areas</strong>, these initiatives or existing<br />
conservation programmes may have begun at a time when not enough information was available, or<br />
<strong>areas</strong> were designated for purposes other than biodiversity conservation. So whenever one can use<br />
new technologies and new methods <strong>of</strong> analysis and assessment, one should. Just <strong>to</strong> make sure that<br />
one is working at the right place and one is conserving all levels <strong>of</strong> biodiversity, species, genetic and<br />
the larger community level. In addition, new challenges which are being wrestled <strong>with</strong> <strong>with</strong>in our<br />
organisation. For example, adaptation <strong>to</strong> climate change is probably one <strong>of</strong> the <strong>areas</strong> that we are<br />
struggling most <strong>with</strong> right now, in terms <strong>of</strong> how do we incorporate projected levels and projected<br />
directions in<strong>to</strong> our current work and how do we utilize that information when we recommend new<br />
<strong>areas</strong> for protection. There is no single answer <strong>to</strong> that. The climate change debate is going on in<br />
addition <strong>to</strong> the issue <strong>of</strong> ecosystem services and consideration <strong>of</strong> sustainable human prosperity.<br />
Ultimately a lot <strong>of</strong> people in conservation are beginning <strong>to</strong> realise that sustainable human prosperity<br />
is going <strong>to</strong> dictate whether an area succeeds or fails in the long term. If local communities are not<br />
benefiting from protected area close by, then ultimately support for that protected area is going <strong>to</strong> fail<br />
and locals will exploit resources <strong>with</strong>in the protected area. Thus, one needs <strong>to</strong> take sustainable<br />
human prosperity and satisfac<strong>to</strong>ry living standards in and around the protected <strong>areas</strong> in<strong>to</strong> account, if<br />
we have any hope <strong>of</strong> sustaining them over the long term.<br />
• And then sustainable human prosperity is going <strong>to</strong> be challenged by climate change.<br />
Oh yes, this is a moving target, for example, how migra<strong>to</strong>ry corridors or the ability <strong>of</strong> species or<br />
natural communities <strong>to</strong> fluctuate or essentially move across the landscape along a very long<br />
timeframe. If designated protected <strong>areas</strong> and designated development zones exist, it may be that<br />
those development zones have now cut <strong>of</strong>f the ability <strong>of</strong> species or natural communities <strong>to</strong> move in<br />
response <strong>to</strong> a change in climatic conditions. If the <strong>areas</strong> they are located in currently are not going <strong>to</strong><br />
be appropriate habitats for them 20-100 years in the future then how they are going <strong>to</strong> get <strong>to</strong> these<br />
newly appropriate <strong>areas</strong> is going <strong>to</strong> be a whole new challenge in the future.<br />
• And because all <strong>of</strong> these climate change predictions are all based on models, and the longer<br />
you look in<strong>to</strong> the future?<br />
The decisions made based on models are really critical and if the reliability <strong>of</strong> data has a very low<br />
confidence levels then, then the decision based on climate models can either be catastrophic or well<br />
formed and prescient in terms <strong>of</strong> their ability <strong>to</strong> accommodate whatever the path <strong>of</strong> the climate<br />
change is going <strong>to</strong> be. This adds a whole new level <strong>of</strong> insecurity <strong>to</strong> the conservation planning<br />
process. This is being considered in our work in Mongolia <strong>with</strong> grasslands. We are trying <strong>to</strong> wrestle<br />
<strong>with</strong> what are the projected models for climate change for that ecosystem type and can we<br />
accommodate the projected changes in terms <strong>of</strong> how and where we designate protected zones. How<br />
does one make this case <strong>to</strong> governments who typically decide on very short time frames and only on<br />
visible, detectable data and not what is supposedly going <strong>to</strong> happen 10/20 years down the road. This<br />
is going <strong>to</strong> be very difficult.<br />
• Do you have any further points you would like <strong>to</strong> add?<br />
One aspect that we are <strong>to</strong>ying <strong>with</strong> is looking at the usefulness <strong>of</strong> habitat models and using satellite<br />
imagery for distinguishing land cover and form. So looking at soil type, slope, aspect, vegetative<br />
cover and then tying that <strong>to</strong> specific species habitat needs and developing models, so that we can<br />
164
APPENDIX<br />
more rapidly <strong>identify</strong> <strong>areas</strong> that we presume <strong>to</strong> have really high diversity, because <strong>of</strong> either macro or<br />
micro habitat composition <strong>of</strong> landscapes. This is wholly dependent on the scale <strong>of</strong> the available<br />
digital information from satellite imagery and the detail <strong>of</strong> habitat requirements <strong>of</strong> species and<br />
communities. This must be followed up by ground truthing in a certain subset <strong>of</strong> these <strong>areas</strong> <strong>to</strong> verify<br />
the satellite imagery and land form composition. This can prove <strong>to</strong> be a really efficient way <strong>of</strong> doing<br />
rapid assessments. At the moment, REAs performed through inven<strong>to</strong>ries by the right number <strong>of</strong><br />
biologists and ecologists <strong>to</strong> evaluate whether an area is truly diverse or not and whether or not there<br />
are viable populations <strong>of</strong> specific species <strong>with</strong>in the landscape. This could be done by using satellite<br />
imagery, if the right data were available <strong>to</strong> plug in<strong>to</strong> the models. These models will need <strong>to</strong> be verified<br />
on the ground.<br />
• How far are you away from implementing these models?<br />
I would say at least two years maybe a little longer. There is a high level <strong>of</strong> discomfort relying solely<br />
on these models, because if one gets it wrong, some <strong>of</strong> the decisions as a result <strong>of</strong> a wrong<br />
representation could be very significant. If one said the area is not diverse due <strong>to</strong> the available<br />
information or the models do not <strong>identify</strong> it as such and this is used, for instance, <strong>to</strong> convert a forest<br />
in<strong>to</strong> an oil palm plantation. Then it turns out that in reality it held a very important population <strong>of</strong> rare<br />
plants or endemic fish species or invertebrates. This is the type <strong>of</strong> outcome we are worried about by<br />
using solely remote sensed data combined <strong>with</strong> habitat species models.<br />
• Surely that will always need <strong>to</strong> be verified through ground truthing?<br />
Yes, ground truthing should be proportionate <strong>to</strong> the confidence level <strong>of</strong> the data you use. So if one<br />
has a very high degree <strong>of</strong> comfort in the species habitat models, for example if one feels that it is<br />
based on either very long-term or very intensive on the ground studies <strong>of</strong> these species or habitats<br />
and one feels the information is highly correlated <strong>with</strong> specific land forms, then one might not need <strong>to</strong><br />
do that much ground truthing. But if the opposite is true, then one should invest in a greater degree <strong>of</strong><br />
ground truthing, as confidence levels are so much lower. So I would really tie that <strong>to</strong> a really honest<br />
assessment <strong>of</strong> how one feels about the data one is using <strong>to</strong> <strong>identify</strong> these <strong>areas</strong> remotely.<br />
165
A4-INTERVIEW PARTNER K<br />
A4-11 Interview Partner K<br />
II<br />
Approaches & their characteristics<br />
Which <strong>approaches</strong> do you know?<br />
I am familiar <strong>with</strong> them all from a practitioner's general level <strong>of</strong> awareness. Other than the HCV<br />
approach, I have not managed, nor evaluated projects using the other <strong>approaches</strong>, nor have I<br />
evaluated any project that implemented one <strong>of</strong> those <strong>approaches</strong>. However, the HCV concept is a<br />
type <strong>of</strong> umbrella approach. It is really set up <strong>to</strong> guide land-managers or planners <strong>to</strong> use any and all<br />
appropriate conservation <strong>to</strong>ols. The HCV concept was not set up <strong>to</strong> supplant a Hotspot, Ecoregion<br />
identification process, or the Five-S process.<br />
REA is extremely important in doing the preliminary assessment work that an HCV approach would<br />
require. Very quickly <strong>identify</strong>ing what are the potential HCVs. This would be one reason for<br />
implementing an REA.<br />
Could you list any strengths and weaknesses <strong>of</strong> the HCV concept?<br />
The perennial weakness <strong>of</strong> any approach, is the lack <strong>of</strong> data and the extent <strong>to</strong> which biodiversity is<br />
unders<strong>to</strong>od in the world, particular in the tropics and the least developed countries <strong>of</strong> the tropics. The<br />
knowledge base needed <strong>to</strong> use effective <strong>to</strong>ols, is <strong>of</strong>ten a challenging element. So the HCV approach<br />
requires a lot <strong>of</strong> reliance on experts, literature, best available data. In essence, it comes down <strong>to</strong> a<br />
situation where many taxa are just not well inven<strong>to</strong>ried or unders<strong>to</strong>od. Their population dynamics is<br />
not well unders<strong>to</strong>od, their extent, their range and so on. So one gets in<strong>to</strong> situations dealing <strong>with</strong><br />
proxies for biodiversity which typically rely on habitat and extent <strong>of</strong> viable habitat. In a lot <strong>of</strong> places in<br />
the world the dynamics <strong>of</strong> land-use change is so rapid that experimental, moni<strong>to</strong>ring or basic<br />
inven<strong>to</strong>ry work around biodiversity is barely able <strong>to</strong> catch up or keep pace. So in some cases, these<br />
<strong>approaches</strong> are limited by the amount <strong>of</strong> information, e<strong>special</strong>ly spatially explicit information. It is<br />
<strong>of</strong>ten a challenge <strong>to</strong> have good mapping and high resolution imagery that can present different types<br />
<strong>of</strong> habitat units.<br />
The other challenging element or weakness <strong>with</strong>in HCV is that it really does need <strong>to</strong> rely on a<br />
precautionary approach (<strong>of</strong>ten a weakness <strong>of</strong> conservation in general) following the precautionary<br />
principle which effectively leads <strong>to</strong> a lot <strong>of</strong> subjectiveness and caution which can also be a good<br />
thing. The precautionary principle is a good conservation rule.<br />
The strengths <strong>of</strong> the HCV approach are that it is flexible and malleable <strong>to</strong> encompass many different<br />
types <strong>of</strong> conservation assessments, mapping and moni<strong>to</strong>ring <strong>approaches</strong>. So it works well as an<br />
effective umbrella.<br />
It is also good, as it identifies values, and whether those values are high or not depends on a number<br />
<strong>of</strong> different criteria. These criteria are designed <strong>to</strong> really capture the issues <strong>of</strong> landscape level and<br />
species level biodiversity. Often cultural diversity, human needs and environmental services are not<br />
included in biodiversity studies. So HCV is holistic in that it recognises regions <strong>of</strong> high concentrations<br />
<strong>of</strong> rare, endemic or endangered species. These may also be regions that have a fundamental human<br />
survival component, either cultural survival or basic subsistence and environmental protection for<br />
things like water quality and so on.<br />
The common denomina<strong>to</strong>r: one starts from an area <strong>with</strong> the aim <strong>to</strong> conserve biodiversity. Here the<br />
understanding <strong>of</strong> biodiversity can be a limiting fac<strong>to</strong>r. Certainly, there are systems or places where a<br />
lot <strong>of</strong> knowledge and understanding has been gathered which helps manage the resource.<br />
Approaches <strong>to</strong> manage biodiversity need <strong>to</strong> be adaptive in their management strategy. They need <strong>to</strong><br />
deal <strong>with</strong> the fact that some information may be lacking which in turn should not prevent action from<br />
being taken, e<strong>special</strong>ly if one knows enough about general trends and needs, in terms <strong>of</strong> habitat and<br />
so forth.<br />
166
APPENDIX<br />
• Which criteria would be important for you, if you were <strong>to</strong> compare these <strong>approaches</strong>?<br />
Some <strong>of</strong> the most important aspects <strong>of</strong> any type <strong>of</strong> conservation endeavour are that it can actually be<br />
implemented; receive follow-up and follow-through for a reasonable amount <strong>of</strong> resources and<br />
capacity <strong>to</strong> use those resources. Thus, the <strong>approaches</strong> need <strong>to</strong> be practical. I would evaluate the<br />
extent <strong>of</strong> practicality <strong>of</strong> the approach, the extent the user can work <strong>with</strong> it. There is always a certain<br />
reliance on experts <strong>to</strong> interpret the <strong>approaches</strong>, so the amount <strong>to</strong> which the approach can be used by<br />
a combination <strong>of</strong> experts and more general practitioners and people <strong>with</strong> more general levels <strong>of</strong><br />
education is important. These are aspects <strong>of</strong> effectiveness which the approach needs <strong>to</strong> be built<br />
upon, so not just the assessment itself, but also the assessment <strong>of</strong> threats <strong>to</strong> biodiversity, the<br />
management responses <strong>to</strong> those threats or management preparation <strong>to</strong> unidentified threats, and<br />
then moni<strong>to</strong>ring. An effective approach is going <strong>to</strong> have a balance between assessment and<br />
identification, management and planning, moni<strong>to</strong>ring and evaluation and research. Those things<br />
need <strong>to</strong> be implemented over time, so the cost <strong>of</strong> any <strong>of</strong> these <strong>approaches</strong> should be considered in<br />
terms <strong>of</strong> how long they can be effective.<br />
There are a number <strong>of</strong> other criteria, in terms <strong>of</strong> how relevant the approach is, how scale dependent<br />
or driven the <strong>approaches</strong> are. Do the <strong>approaches</strong> allow one <strong>to</strong> look at a very discrete ecosystem unit<br />
or management unit and do they also consider the wider landscape? If one evaluates the landscape,<br />
then the finer scales should not be lost. The system has <strong>to</strong> be scale dependent.<br />
The <strong>approaches</strong> also need a temporal component. His<strong>to</strong>rical land-use, species abundance,<br />
populations or interactions, processes that change over time, processes <strong>of</strong> decline or increase in<br />
abundance, all need <strong>to</strong> be considered.<br />
Approaches need <strong>to</strong> lend themselves <strong>to</strong> a level <strong>of</strong> spatial representation. So that the approach either<br />
considers, evaluates or produces the spatially representative information and units.<br />
• Some <strong>of</strong> the first criteria you mentioned were practicality, manageablity and useability. Would<br />
you say these are all measures <strong>of</strong> efficiency? Or how would you best measure efficiency?<br />
I was hoping that those would be the type <strong>of</strong> criteria that would drive an effective approach, because<br />
if the approach is not user friendly or if it is <strong>to</strong>o demanding or <strong>to</strong>o archaic and complex, then it can<br />
only be used by a few experts at extremely high costs. Thus, resulting in limited impacts and utility<br />
and less effectiveness. Approaches implemented on a larger scale, in many parts <strong>of</strong> the world,<br />
across multiple landscapes, allow for applicability and allow one <strong>to</strong> learn from how the <strong>approaches</strong><br />
function in different countries and places.<br />
One does not want it <strong>to</strong> be so practical and user friendly that it throws ecological and wildlife science<br />
out the window, one still needs a high level <strong>of</strong> rigour and it has <strong>to</strong> be based on best understanding <strong>of</strong><br />
conservation science.<br />
• But all <strong>of</strong> these points will be fairly difficult <strong>to</strong> measure in actual figures?<br />
Yes, but that is the challenge <strong>with</strong> many things. One should say: if one cannot measure it, one<br />
cannot manage it; if you cannot measure it you cannot really tell if it is being effective or not; if it is<br />
having an impact or not. So obviously, the challenge around these general criteria is <strong>to</strong> come up <strong>with</strong><br />
some actual indica<strong>to</strong>rs <strong>to</strong> measure effectiveness and practicality. These would have <strong>to</strong> be boiled<br />
down <strong>to</strong>, for example, level <strong>of</strong> effort needed <strong>to</strong> conduct a biodiversity assessment in a landscape <strong>of</strong><br />
10 000; 100 000; 1 million hectares at various costs and various times. One could set up some sort<br />
<strong>of</strong> matrix: one would like the following approach <strong>to</strong> cost less than 100 000 or less than 1 million or<br />
less than 10 million and <strong>to</strong> be functioning for 1 year and less or between 1 and 5 years or between 5<br />
and 10 years. So one could try and incorporate measurable elements.<br />
167
A4-INTERVIEW PARTNER K<br />
III<br />
Approaches & their requirements<br />
• A. Time: Could you give me an estimate <strong>of</strong> how long the HCV approach takes <strong>to</strong> be<br />
implemented?<br />
Field work: 7-14 days.<br />
Entire assessment: 2-4 weeks prior <strong>to</strong> and after field work for preparation, analysis, documentation<br />
and communication <strong>with</strong> other colleagues.<br />
• B. Cost: Could you give me an estimate <strong>of</strong> how much such an assessment would cost?<br />
I could suggest <strong>to</strong> you that for a large scale area, somewhere between 20,000 and 100,000 hectares,<br />
an HCV assessment will probably cost between 25,000 and 100,000 US$ depending on human<br />
resources required, consultants that are used, and data availability.<br />
This estimate will vary when performing the assessment <strong>with</strong> three <strong>to</strong> four local conservation biology<br />
technicians or researchers, rather than <strong>with</strong> international ones, because the pay scales are usually<br />
higher for international consultants.<br />
• C. Human Resources: How <strong>of</strong>ten have you been able <strong>to</strong> use non-expert users for an HCV<br />
assessment?<br />
Local assessors are used <strong>of</strong>ten. It is more frequent <strong>to</strong> mix teams, so one might have one senior<br />
consultant <strong>with</strong> 20-30 years <strong>of</strong> international experience, then a couple <strong>of</strong> people <strong>with</strong> less<br />
international experience and more local experience. If the company, for which the assessment is<br />
being conducted, is high pr<strong>of</strong>ile, <strong>with</strong> high visibility and lot <strong>of</strong> controversy around the operation, then a<br />
high level <strong>of</strong> pr<strong>of</strong>essionals on the assessment team will be required. But many countries have very<br />
good biologists and ecologists who are doing a lot <strong>of</strong> research. There are really good resources at<br />
the local level that are available. If one looks at the HCV Network there are a number <strong>of</strong> HCV<br />
assessments being conducted by local pr<strong>of</strong>essionals in various parts <strong>of</strong> the world<br />
• This will depend on the industry for which the assessment is being performed?<br />
Exactly, <strong>with</strong> high risk operations (paper mills for example) one really needs someone who can stand<br />
their ground and is able <strong>to</strong> assert their judgements. This person should not <strong>to</strong> bow <strong>to</strong> some sort <strong>of</strong><br />
pressure which may be the case <strong>with</strong> someone more junior or less experienced.<br />
• E. Purpose <strong>of</strong> the approach: How efficient is the HCV concept in conserving biodiversity?<br />
It is certainly having an impact on FSC certified forests. Various impact studies have looked at which<br />
types <strong>of</strong> changes are needed <strong>to</strong> take place in order for forest management units <strong>to</strong> get certified<br />
compared <strong>to</strong> the common level <strong>of</strong> practice. These studies show that about 60% <strong>of</strong> the evaluated<br />
certifications improved <strong>with</strong> respect <strong>to</strong> conservation planning, conservation management, the<br />
conserved area and so forth.<br />
It is worth doing more impact analysis, looking at which percentage <strong>of</strong> forest or area is conserved<br />
due <strong>to</strong> the changes made.<br />
What this means globally in terms <strong>of</strong> biodiversity, is a lot harder <strong>to</strong> determine. As one has <strong>to</strong> go<br />
beyond the boundaries <strong>of</strong> certified forests and look at where it lies in a particular watershed or a<br />
particular landscape. For instance, a certified forest in Indonesia <strong>of</strong>fers refuge <strong>to</strong> a great deal <strong>of</strong><br />
biodiversity values when the surrounding landscape units are being fragmented, converter or<br />
degraded. Thus, this forest becomes more significant and important as the surrounding area is<br />
fragmented. However, it also becomes harder and harder <strong>to</strong> support populations ranging from<br />
protected area <strong>to</strong> production area across the landscape. So the effectiveness <strong>of</strong> all these <strong>approaches</strong><br />
really needs <strong>to</strong> be taken <strong>to</strong> the landscape scale. HCV Network has for the past few years been<br />
working on <strong>to</strong>ols for evaluation at the landscape level.<br />
168
APPENDIX<br />
• F. Certification: Do you think market based initiatives are more effective than governance<br />
based <strong>approaches</strong>?<br />
Both are needed. The market based <strong>approaches</strong> can have impacts on landscapes <strong>with</strong> a mosaic <strong>of</strong><br />
land-uses; agricultural production, managed forest either on an industrial scale or more on a<br />
community scale. The market can have a significant influence <strong>with</strong> certain players that have a very<br />
deep supply chain and affect a large portion <strong>of</strong> the landscape. If one is able <strong>to</strong> convince large<br />
companies <strong>to</strong> change their practices <strong>to</strong> incorporate conservation, then the area <strong>of</strong> conserved HCV<br />
forest would probably be far more. However, the effectiveness <strong>of</strong> holding those companies <strong>to</strong><br />
respecting and completing legitimate HCV assessments and actually implementing the assessments<br />
<strong>to</strong> protect natural habitats is not particularly effective. But the Indonesian government has not been<br />
any more effective because they have created, through licensing and land-use planning,<br />
opportunities for these large companies <strong>to</strong> open up new concessions in regions <strong>of</strong> natural forest <strong>with</strong><br />
rich biodiversity. Both market based and government initiatives are required for the field <strong>of</strong><br />
conservation planning. HCV and some <strong>of</strong> the other <strong>approaches</strong> are fairly useful in terms <strong>of</strong> land-use<br />
or landscape level planning. It could help <strong>to</strong> allocate land-uses in a way that places biodiversity<br />
conservation in a much higher level <strong>of</strong> priority than it has been. The market is only going <strong>to</strong> be<br />
effective where supply chains exist and <strong>with</strong> companies wanting their products being produced in a<br />
more sustainable way. Much influence already exists in the production in c<strong>of</strong>fee, cocoa, tea, bananas<br />
and other crops. Here the companies managing the plantations or purchasing the crop from the<br />
grower were concerned <strong>with</strong> sustainability standards. So they have actually set targets for their<br />
producers and their production units <strong>to</strong> be met in terms <strong>of</strong> certification which has caused an increase<br />
in the level <strong>of</strong> available certified products. The overall result is that certified farms are better for the<br />
environment. They contain more conservation units. They retain more biological legacies in terms <strong>of</strong><br />
remnant vegetation, remnant forest cover, remnant riparian zones. They also impact workers and<br />
their families. Market based <strong>approaches</strong> result in more forest area being conserved <strong>with</strong>in the<br />
productive landscape than otherwise would have been. But this is still just reaching out <strong>to</strong> a small<br />
section <strong>of</strong> the <strong>to</strong>tal global economic trade and there are a lot <strong>of</strong> commodity crops and commodity<br />
products that have yet <strong>to</strong> be influenced by the market in way that really makes a difference. This is<br />
the challenge. If these market initiatives are going <strong>to</strong> be successful, then they must address some <strong>of</strong><br />
these major commodity crops which lead <strong>to</strong> the conversion <strong>of</strong> ecosystems; deforestation and so on.<br />
It is not necessarily that certified products have <strong>to</strong> have a higher price. But there does need <strong>to</strong> be a<br />
demand and this needs <strong>to</strong> be influential enough <strong>to</strong> be significant and therefore make an impact.<br />
The other element is that these certification programmes and standards can be an opportunity for<br />
government led programmes and government regulations <strong>to</strong> be more robust and <strong>to</strong> take the lead<br />
from these standards and incorporate the requirements in<strong>to</strong> new legislation or new programmes.<br />
IV<br />
Summary, evaluation & outlook<br />
• How meaningful can <strong>approaches</strong> used for identification <strong>of</strong> biodiversity relevant <strong>areas</strong> be for<br />
biodiversity conservation at all?<br />
I do not really know the extent <strong>to</strong> which we have mapped out the high biodiversity regions <strong>of</strong> the<br />
world. My general sense <strong>of</strong> the issue is that we probably have a fairly good idea <strong>of</strong> the relative<br />
<strong>importance</strong> <strong>of</strong> ecosystems around the globe. More challenging is <strong>to</strong> determine where the resources<br />
should go, how they should be allocated and what should be done <strong>with</strong> them. We have enough<br />
coverage on a global level in terms <strong>of</strong> what we know. So it is a different issue, I think.<br />
169
A4-INTERVIEW PARTNER K<br />
• Are there any further points you would like <strong>to</strong> add?<br />
My sense is that all <strong>of</strong> these <strong>approaches</strong> can be effective <strong>to</strong>ols for biodiversity conservation. The real<br />
challenges go back <strong>to</strong> issues related <strong>to</strong> poverty and land-use planning, forest governance and the will<br />
<strong>of</strong> countries <strong>to</strong> respect conservation plans and prioritize <strong>with</strong>in their own development agendas. The<br />
urgency due <strong>to</strong> climate change is an even greater challenge. We are losing habitat which causes<br />
climate change and as climate change gets more severe, the species <strong>with</strong>in those habitats and the<br />
habitats themselves are threatened <strong>with</strong> extinction or the need <strong>to</strong> move. So the urgency lies not only<br />
in working <strong>to</strong>wards saving <strong>areas</strong> <strong>of</strong> biological significance, but also in confronting the challenges <strong>of</strong><br />
predicting how these <strong>areas</strong> will adapt <strong>to</strong> climate change. That is very challenging, so coming up <strong>with</strong><br />
emergency funding programmes <strong>to</strong> address climate change is <strong>of</strong> utmost <strong>importance</strong>. While some<br />
conservation biologists may say that this climate issue has taken away funding <strong>of</strong> resources that<br />
would have otherwise been allocated <strong>to</strong> them we should recognize that if we do not solve this greater<br />
planetary problem, then biodiversity will not have much chance in surviving.<br />
The financial resources being discussed need <strong>to</strong> be allocated <strong>to</strong> projects looking for a whole suit <strong>of</strong><br />
solutions <strong>to</strong> promote sustainable development. These are more likely <strong>to</strong> be community based types<br />
<strong>of</strong> management structures or more integrated types <strong>of</strong> agriculture. There are a lot <strong>of</strong> different projects<br />
that can be financed <strong>with</strong> the resources generated for solving climate change.<br />
Moving <strong>to</strong> a decarbonised or low carbon economy can help <strong>to</strong> stimulate innovation and not just in<br />
terms <strong>of</strong> machines, buildings and energy production, but also in changing management structures for<br />
agricultural landscapes, forests and so on.<br />
This is a long term challenge. A green economy will not be created overnight. Innovation that is more<br />
sustainable will not be implemented over night either, so it is something that should be worked on<br />
over the span <strong>of</strong> the next 20-50 years.<br />
170
APPENDIX<br />
A4-12 Interview Partner L<br />
II<br />
Approaches & their characteristics<br />
Which <strong>approaches</strong> do you know?<br />
Environmental impact assessments, the HCV approach and many variations there<strong>of</strong>. One can also<br />
just map fauna and flora.<br />
In the framework <strong>of</strong> FSC many <strong>of</strong> these <strong>approaches</strong> were used and <strong>of</strong>ten also modified.<br />
• How would you best measure the efficiency <strong>of</strong> these <strong>approaches</strong>?<br />
That really depends on the region <strong>of</strong> interest and the level <strong>of</strong> biodiversity one is interested in. The<br />
method implemented depends completely on the region <strong>of</strong> interest. So the region dictates whether an<br />
EIA, an HCV, a GAP analysis or a mapping exercise is chosen. In addition, the choice <strong>of</strong> approach<br />
also depends on the amount <strong>of</strong> available data. With regard <strong>to</strong> this aspect, it is better <strong>to</strong> choose one <strong>of</strong><br />
the existing <strong>approaches</strong>.<br />
• Would you reduce the measurement <strong>of</strong> efficiency <strong>to</strong> a few individual fac<strong>to</strong>rs? Such as cost,<br />
time or size <strong>of</strong> a set-aside area.<br />
Of course. The size <strong>of</strong> a set-aside area depends on many different fac<strong>to</strong>rs, but cost, efficiency and<br />
available time are always driving fac<strong>to</strong>rs <strong>of</strong> any approach. Of course, mapping can be an excellent<br />
choice, as it provides better data. It is however, extremely intensive. If time and resources (money<br />
and personnel) are insufficient for a field survey, then a panel <strong>of</strong> experts can also be used. These<br />
should preferably be local, <strong>with</strong> some knowledge <strong>of</strong> the study area. Thus, the inven<strong>to</strong>ry could be<br />
based on expert knowledge. These criteria are always the driving fac<strong>to</strong>rs.<br />
When comparing an EIA, HCV and mapping, all three can be performed <strong>with</strong> an extremely long field<br />
survey and very intensive research. However, all <strong>of</strong> the <strong>approaches</strong> can also be based on expert<br />
knowledge, which will take far less time. A workshop or survey <strong>of</strong> local experts can be completed<br />
<strong>with</strong>in a few months, depending on the location <strong>of</strong> the area and its access. For instance, in Europe<br />
this would not pose a problem and the approach could be implemented very quickly. In less<br />
accessible <strong>areas</strong> local experts can help speed up the process using indirect indica<strong>to</strong>rs, such as the<br />
trade <strong>of</strong> plant and animal products at local markets. This always provides a fairly good overview <strong>of</strong><br />
what actually exists in any area. So the available resources will always dictate the method <strong>of</strong><br />
implementation <strong>of</strong> any approach.<br />
The <strong>approaches</strong> will not be any better or worse due <strong>to</strong> differences in implementation. Many years in<br />
the field collecting data does not necessarily guarantee a more efficient outcome.<br />
The goal <strong>of</strong> the project will determine which approach is chosen. For instance, in the case <strong>of</strong> trying <strong>to</strong><br />
gather political support, the HCV concept would possibly be a good choice, as it already has much<br />
political support. However, in the case <strong>of</strong> trying <strong>to</strong> obtain university support, intensive field surveys<br />
over several years using students, in order <strong>to</strong> meet the high scientific requirements, would be a better<br />
option. Expert surveys and estimates will never be sufficiently scientific for universities. If aiming <strong>to</strong><br />
work <strong>with</strong> industry or the finance sec<strong>to</strong>r, for example, then an EIA (or SEIA as it is called these days)<br />
would be the appropriate choice.<br />
So which approach is used really depends on the goal <strong>of</strong> the project. The methodology implemented<br />
will also change according <strong>to</strong> the goal. When aiming for political consensus or political education,<br />
then stakeholder participation should really be included in the process. Therefore, it is always<br />
important <strong>to</strong> first look at the context.<br />
In addition <strong>to</strong> the HCV concept, FSC has always used other <strong>approaches</strong>, even though the FSC<br />
developed the HCV concept. The rationale behind this was that the context dictates the choice <strong>of</strong><br />
approach. The approach should always be chosen <strong>to</strong> obtain the required results.<br />
171
A4-INTERVIEW PARTNER L<br />
First one should establish what the required results are, for whom they are needed, which results<br />
have more credibility and then one should find out which resources are available. Then only can an<br />
approach be constructed <strong>to</strong> fit these needs. Never commit oneself <strong>to</strong> a single approach. In reality,<br />
one approach is not better than another. If the financial resources for mapping are not available, then<br />
there is no point in starting the exercise, as it would be a complete waste <strong>of</strong> money. It is also not<br />
useful <strong>to</strong> try and perform scientific statistics using data from an HCV assessment <strong>with</strong> numerous<br />
stakeholder contributions.<br />
• How efficient are market based initiatives for biodiversity conservation?<br />
They are extremely effective where they take hold, because they place a value on biodiversity. As<br />
soon as a value is assigned, people support and implement conservation.<br />
For example, if the Berchtesgaden National Park lost it protection status, a small <strong>to</strong> medium size<br />
revolution would probably ensue, as people live exceptionally well <strong>of</strong>f the park. Thus, there is no<br />
interest <strong>to</strong> give up this protection in any way, as it has a value <strong>to</strong> the local communities. The same<br />
applies <strong>to</strong> the Bavarian Forest.<br />
We have seen the same in other <strong>areas</strong> as well, even <strong>with</strong> different financial advantages such as<br />
timber production which does not necessarily mean that biodiversity is harmed or compromised. In<br />
timber production, the area can definitely be used in such a way that conservation <strong>of</strong> biodiversity<br />
becomes attractive. Very few societies can afford <strong>to</strong> protect biodiversity solely for ethical reasons<br />
<strong>with</strong>out financial advantage.<br />
For instance, in the Congo Basin, DRC the basic needs <strong>of</strong> the inhabitants, if not satisfied, will prevent<br />
the conservation <strong>of</strong> biodiversity. Only through human needs, has a necessity arisen <strong>to</strong> protect<br />
biodiversity. Thus, human needs must first be addressed and then only can biodiversity conservation<br />
be tackled.<br />
For FSC certification, Congo Basin concessions have invested millions for the establishment <strong>of</strong><br />
management plans. They have set aside over 30% for the conservation <strong>of</strong> biodiversity and/ or social<br />
aspects. Without a market advantage, no concession would do this. Due <strong>to</strong> certification the cost <strong>of</strong> a<br />
management plan doubles, perhaps even triples. This is paid for by the concessions themselves.<br />
After they have received certification, these concessions receive twice the price for their timber. So it<br />
is definitely worth their while. These examples exist in Africa, Latin America, Russia and, <strong>to</strong> a lesser<br />
extent, in Asia, because the FSC system is not as widespread in South East Asia. Similar results can<br />
probably be obtained in Indonesia and Malaysia.<br />
• How <strong>of</strong>ten are new certificates issued under FSC?<br />
A certificate is always valid for 5 years. At the beginning a large audit is performed and then every<br />
year a smaller less intensive audit must be undertaken. Thus, concessions are checked on an annual<br />
basis. After 5 years another large audit is performed. The audits are implemented by independent<br />
accredited organisations.<br />
• I have heard that these auditing company personnel are not necessarily well trained which<br />
<strong>of</strong>ten results in problems from an ecological point <strong>of</strong> view i.e. these audits should be more<br />
stringent.<br />
That really depends on the viewpoint. Talking <strong>to</strong> a fundamental conservationist, this argument will<br />
always arise. However, talking <strong>to</strong> a sociologist, the social aspect will be placed above ecology in<br />
terms <strong>of</strong> its <strong>importance</strong>. If the social aspects are addressed, then conservation is not required<br />
anymore, as people's needs are addressed. In contrast, industry will comment that they only play this<br />
game as their product receives a higher price, but the ecological and social aspects are in reality<br />
<strong>to</strong>tally absurd. Thus, the three different perspectives will produce three very different opinions. The<br />
HCV concept tries <strong>to</strong> balance these three opinions in order <strong>to</strong> find a denomina<strong>to</strong>r. Obviously, the<br />
common denomina<strong>to</strong>r will not be the optimum for anyone <strong>of</strong> the three interest groups. If one looks at<br />
172
APPENDIX<br />
all FSC certificates (worldwide 14,000-15,000) and looks where any problems, complaints or<br />
critiques arose, then this will be considerably less than 5%. Therefore, this is a fairly good system<br />
where all three aspects are addressed. Again, the context always needs <strong>to</strong> be looked at. From a<br />
forester's stand point an HCV forest will always need some improvements, but improvements could<br />
also be made for the economic or social aspect as well. Biodiversity conservation needs <strong>to</strong> be<br />
economically viable, if not, it will be dependent on donations from developed countries. Every local<br />
population is very pragmatic, <strong>with</strong> short term thoughts on short term advantages. This short term<br />
material way <strong>of</strong> thinking is even more distinct, when it is primarily about food, health and education. If<br />
someone says there is a more efficient way <strong>of</strong> meeting these needs which is perhaps less long term,<br />
but more efficient, by helping cut down a forest, then that person will not be turned away. So, if better<br />
opportunities in addressing these needs can be found <strong>with</strong>out devastating the forest, then<br />
biodiversity can also be conserved.<br />
III<br />
Approaches & their requirements<br />
• F. Certification: How would you assess market based initiatives in comparison <strong>to</strong> classical<br />
protected <strong>areas</strong>?<br />
This again depends on the context. But market based initiatives are at least just as effective as<br />
classical protected <strong>areas</strong>. Market based initiatives do not necessarily mean only timber production; it<br />
can also mean <strong>to</strong>urist initiatives, such as in the Berchtesgaden National Park where more money is<br />
earned these days through <strong>to</strong>urism, than previously through forestry and mountain farming. The large<br />
national parks in the USA or in Southern Africa (Kruger National Park) earn a lot <strong>of</strong> money through<br />
<strong>to</strong>urism. From my point <strong>of</strong> view, economic use must always go hand in hand <strong>with</strong> good conservation<br />
strategies.<br />
• So you would not separate the two, but instead, for a protected area <strong>to</strong> exist, economic<br />
initiatives must be present?<br />
Yes, <strong>to</strong> be effective in conserving or maintaining the present values.<br />
Without market based initiatives, people tend <strong>to</strong> lose interest very quickly. Look at the protected<br />
<strong>areas</strong> in Germany, those supported by economic initiatives such as national parks, national reserves<br />
and biosphere reserves are predominantly very successful. In contrast, the nature sanctuaries <strong>with</strong><br />
<strong>to</strong>tal protection have been completely forgotten. They have not <strong>of</strong>ten been mapped nationally, as this<br />
has rather been left <strong>to</strong> the individual states. Public awareness needs <strong>to</strong> be raised and this is best<br />
done through the economy.<br />
IV<br />
Summary, evaluation & outlook<br />
• How meaningful can <strong>approaches</strong> used for identification <strong>of</strong> biodiversity relevant <strong>areas</strong> be for<br />
conservation?<br />
Extremely meaningful, we have no idea what will happen if we risk biodiversity. It is as if one burnt<br />
the Washing<strong>to</strong>n congressional library down, <strong>with</strong>out having read it. The last 100 years have shown<br />
the <strong>importance</strong> <strong>of</strong> biodiversity. Biodiversity is extremely important and it can be assumed that there is<br />
still much <strong>to</strong> be learnt about biodiversity and how <strong>to</strong> utilise it further. The destruction <strong>of</strong> biodiversity<br />
would be extremely irresponsible <strong>to</strong>wards future generations. Therefore, identification is very<br />
meaningful and necessary. The next question is where are the incentives for society <strong>to</strong> prioritise this<br />
issue and <strong>to</strong> sustain it permanently.<br />
173
A4-INTERVIEW PARTNER M<br />
A4-13 Interview Partner M<br />
II<br />
Approaches & their characteristics<br />
• Which <strong>approaches</strong> do you know?<br />
The KBA approach - the whole philosophy behind this approach is based upon providing a unified<br />
umbrella across numerous, more specific taxon based <strong>approaches</strong> <strong>to</strong> <strong>identify</strong> important sites for<br />
biodiversity conservation. So, the drive behind the development <strong>of</strong> the KBA approach has come from<br />
asking how <strong>to</strong> bring <strong>to</strong>gether data from IBA, IPA, as well as important mammal, amphibian, marine<br />
and freshwater <strong>areas</strong> <strong>to</strong> form a common framework.<br />
• Could you describe any strengths or weaknesses for the KBA approach?<br />
The beauty <strong>of</strong> the KBA approach is that it links a bot<strong>to</strong>m-up ownership and process identification by<br />
people <strong>with</strong> global standards and criteria. The identification <strong>of</strong> all KBA is implemented at national,<br />
sub-national and regional levels. The resulting template <strong>of</strong> site-level conservation targets therefore,<br />
has national, regional and local relevance and ownership <strong>to</strong>gether <strong>with</strong> global approval and<br />
validation.<br />
The spatial units <strong>of</strong> the KBA approach are land-management units. Thus, they are <strong>areas</strong> that actually<br />
are or can be suitably managed for conservation on the ground through either the management <strong>of</strong><br />
protected <strong>areas</strong> or other appropriate measures. Therefore, they have high conservation relevance. In<br />
this light, the KBA approach can be differentiated from, for example, the academic development <strong>of</strong><br />
systematic conservation planning. The latter focuses, in theory, on the identification <strong>of</strong> grid cells and<br />
spatial units <strong>of</strong> cells across a grid. This brings analytic rigour, however, lacks relevance for<br />
conservation on the ground. These techniques and <strong>approaches</strong> come <strong>to</strong>gether through the use <strong>of</strong> the<br />
same kind algorithms developed by systematic conservation planning for prioritising important sites.<br />
This can be applied <strong>to</strong> support the prioritisation <strong>of</strong> KBA. So the <strong>approaches</strong> come <strong>to</strong>gether at the<br />
level <strong>of</strong> prioritisation. In terms <strong>of</strong> the underlining spatial units, one <strong>of</strong> the great strengths <strong>of</strong> the KBA<br />
approach is that it provides conservation relevance.<br />
A further strength which draws from this link between local relevance and global approval, is that<br />
whole spectrum <strong>of</strong> society is involved. For example, the KBA approach is very powerful when looking<br />
at the site level through the establishment <strong>of</strong> local groups and civil societies for mobilising local pride<br />
and ownership.<br />
The approach is very powerful in informing local and national governments for support <strong>of</strong> national<br />
GAP analysis commitments.<br />
It also resonates well <strong>with</strong> the private sec<strong>to</strong>r as many corporations are concerned <strong>with</strong> protecting<br />
themselves from public relations risks. The KBA approach provides very powerful and upfront<br />
information, a powerful watch list <strong>of</strong> sites where investment could be made by the private sec<strong>to</strong>r. For<br />
example, where extractive industries could under extreme caution start development.<br />
Finally, the approach is powerful and resonates well <strong>with</strong> institutional industries. Both the private<br />
sec<strong>to</strong>r and intergovernmental agencies have over the last few years been successful developing and<br />
making standardised <strong>to</strong>ols available <strong>to</strong> everyone. The best example is called the IBAT <strong>to</strong>ol.<br />
One caveat is that it is important not <strong>to</strong> give the impression that KBA are the only solution <strong>to</strong><br />
biodiversity conservation. KBA are one <strong>to</strong>ol in a <strong>to</strong>olbox <strong>of</strong> <strong>approaches</strong> necessary for conservation.<br />
They should always be complimented <strong>with</strong> conservation activities focusing at other scales where<br />
biodiversity threats also exist. For example, site-based conservation <strong>approaches</strong> should be<br />
complimented by species-based conservation <strong>approaches</strong> that tackle species specific threats <strong>to</strong><br />
biodiversity, such as hunting and disease. They should also be complimented by landscape or seescape<br />
level <strong>approaches</strong>, broad regional <strong>approaches</strong>, corridor <strong>approaches</strong>, ecoregion <strong>approaches</strong> <strong>to</strong><br />
ensure the conservation <strong>of</strong> broad-scale ecological processes. This should result not just in the<br />
174
APPENDIX<br />
representation <strong>of</strong> biodiversity, but also in its persistence. So the site-level KBA approach does not<br />
claim <strong>to</strong> solve all conservation problems.<br />
Another point which is important <strong>to</strong> highlight is the opening rational <strong>of</strong> biodiversity conservation. The<br />
predominant threat <strong>to</strong> most biodiversity is the destruction <strong>of</strong> habitat. Given that is the case, the logical<br />
response and the first line in biodiversity conservation, therefore, needs <strong>to</strong> be the safeguarding <strong>of</strong><br />
biodiversity relevant places by preventing habitat destruction. In terms <strong>of</strong> conservation tactics this<br />
has been implemented for many centuries as the approach <strong>of</strong> protected <strong>areas</strong>. The actual<br />
government mechanism protecting an area can and should vary. For example, national parks could<br />
be appropriate in one place, but for another place it may be far more appropriate for an important site<br />
<strong>to</strong> lie in the hands <strong>of</strong> a local group. The important thing is that the site is managed in such a way that<br />
is consistent <strong>with</strong> maintaining biodiversity.<br />
• As an estimate, how large are the KBA sites?<br />
Maximum and minimum sizes are generally not specified. Obviously for any given region an average<br />
emerges as site identification progresses. However the delineation <strong>of</strong> KBA is driven by what is<br />
manageable for conservation on the ground <strong>with</strong>in a given social and political context. This means<br />
that there is no maximum or minimum threshold on site size. It means that the size <strong>of</strong> KBA vary<br />
across 7 order <strong>of</strong> magnitude. There are some examples <strong>of</strong> tiny KBA all the way through <strong>to</strong> extremely<br />
large KBA such as <strong>of</strong> the huge protected <strong>areas</strong> in Africa and in the Artic. Thus, there is no single<br />
threshold for maximum and minimum size and the average size varies quiet widely depending on the<br />
environmental and social context. So <strong>to</strong> give an example, in some heavily developed regions, for<br />
instance in Europe or in hotspot type regions in the tropics high levels <strong>of</strong> habitat land conversion or<br />
high levels <strong>of</strong> agricultural input, the KBA will tend <strong>to</strong> be quiet small. Some <strong>of</strong> them may be very small,<br />
as they are guided by where the remaining fragments <strong>of</strong> natural habitat persist. This <strong>of</strong>ten is where<br />
there are some kind <strong>of</strong> existing protected <strong>areas</strong>. At the other end <strong>of</strong> the scale wilderness type regions<br />
exist. For example, in the woodlands <strong>of</strong> central Southern Africa, the Amazon or the Arctic where<br />
human development has been much less intense, the delineation <strong>of</strong> KBA will tend <strong>to</strong> be at a much<br />
broader extent and be guided by potential manageability, e<strong>special</strong>ly aligning <strong>with</strong> either the mayor<br />
existing protected <strong>areas</strong> or tribal lands.<br />
So there is no single size.<br />
• How would you best measure the efficiency <strong>of</strong> the KBA approach?<br />
There is a lot <strong>of</strong> work, fairly far progressed, being done <strong>with</strong> regard <strong>to</strong> moni<strong>to</strong>ring the effectiveness <strong>of</strong><br />
conservation across KBA.<br />
Because KBA are initially identified and in general conserved bot<strong>to</strong>m-up, very <strong>of</strong>ten from the local<br />
and certainly from the national level, the question <strong>of</strong> efficiency is not really relevant. There is no<br />
single global stamp stating which site will provide the ‘biggest bang for buck’. Given that the primary<br />
focus in implementation is bot<strong>to</strong>m-up, efficiency at the level <strong>of</strong> the entire system is much less <strong>of</strong> a<br />
concern. It is, however, still a concern as KBA are used by some organisations involved in global<br />
mapping. This also includes the private sec<strong>to</strong>r and intergovernmental organisations. It is probably<br />
accurate <strong>to</strong> say that organisations <strong>with</strong> a global mandate are a relatively small portion <strong>of</strong> the<br />
constituency <strong>of</strong> the KBA approach. The fact that the identification <strong>of</strong> KBA follows global standard<br />
criteria means that it is possible <strong>to</strong> compare them across the entire framework. So, in theory, other<br />
organisations could compare the effectiveness relative <strong>to</strong> cost, for example, in investments in<br />
conservation in the Philippines relative <strong>to</strong> those in Mexico. But the units become sites, rather than<br />
hectares, so the units <strong>of</strong> conservation are the KBA themselves as opposed <strong>to</strong> areal measurements.<br />
In terms <strong>of</strong> moni<strong>to</strong>ring the effectiveness <strong>of</strong> intervention, there are fairly extensive sets <strong>of</strong> effort<br />
underway <strong>with</strong>in the Birdlife International partnerships. These are probably the most advanced in<br />
moni<strong>to</strong>ring biodiversity and biodiversity conservation <strong>with</strong>in KBA. The important points: firstly,<br />
175
A4-INTERVIEW PARTNER M<br />
moni<strong>to</strong>ring may follow a broad framework <strong>of</strong> pressure-response and benefit. Secondly, and probably<br />
the norm, the framework develops measures <strong>of</strong> trends for the biodiversity for which the site is<br />
important. For instance, measures <strong>of</strong> what is happening <strong>to</strong> biodiversity threats, in particular in the<br />
range <strong>of</strong> habitat destruction. Thirdly, where do things stand in terms <strong>of</strong> the implication <strong>of</strong> conservation<br />
<strong>of</strong> a site, protected area status, education initiatives around the site, etc. And finally, what is the flow<br />
<strong>of</strong> benefits <strong>of</strong> conservation <strong>of</strong> the site and the biodiversity for which it is important at different scales.<br />
For instance, these flows <strong>of</strong> benefits range from the transfer <strong>of</strong> protected area entrance fees in<strong>to</strong><br />
local communities, <strong>to</strong> avoiding carbon emissions from deforestation, therefore contributing <strong>to</strong><br />
mitigating climate change.<br />
This is important, as the speed at which these indica<strong>to</strong>rs move varies widely across the four<br />
categories. So, some benefits start <strong>to</strong> flow very quickly, and some are flowing already, as<br />
conservation activities get implemented. However, other conservation actions require considerably<br />
longer <strong>to</strong> start influencing threat mitigation. It takes even longer for those mitigated threats <strong>to</strong><br />
translate in<strong>to</strong> biodiversity conservation. Thus, one can think <strong>of</strong> these as cons relative <strong>to</strong> each other,<br />
<strong>with</strong> the benefits pieces moving quickly and the biodiversity pieces moving slowly.<br />
The other important advantage <strong>of</strong> the moni<strong>to</strong>ring framework is that it can be implemented at different<br />
scales. So depending on for whom and in whose interest the moni<strong>to</strong>ring is being implemented<br />
(whether it is a national government or the World Bank), different levels <strong>of</strong> precision require<br />
emphasis. For example, some sites may have particularly heavy investments from a national<br />
government or an intergovernmental agency for moni<strong>to</strong>ring actual species on the ground or for socioeconomic<br />
surveys <strong>with</strong>in the wider landscape. At the other end <strong>of</strong> the scale, where data is much<br />
sparser, but <strong>with</strong> some data through the use <strong>of</strong> remote sensing, although much coarser in resolution,<br />
the progress <strong>of</strong> biodiversity conservation at those sites can nevertheless be informing.<br />
III<br />
Approaches & their requirements<br />
• A. Time: How much time is required for the identification <strong>of</strong> KBA?<br />
As <strong>with</strong> the question <strong>of</strong> size, this varies widely. Primarily, based on local capacity. The approach is<br />
bot<strong>to</strong>m-up and therefore, while it is important that the process be nested <strong>with</strong>in and owned by local<br />
and national institutions, it takes longer than it would, if it were purely <strong>to</strong>p-down. This is the basis <strong>of</strong><br />
the sustainability <strong>of</strong> conservation efforts, there being approval at local level.<br />
On average, across the regions, where we have supported KBA identification over the last decade, 3<br />
years is about average. Some cases may be faster. The general opinion is that this is probably faster<br />
than it should be, because the most effective processes have been those involving extensive field<br />
surveys prior <strong>to</strong> identification. This is something Birdlife International has been very effective in<br />
supporting. As we have moved from identification <strong>of</strong> important sites for birds <strong>to</strong> important sites for<br />
biodiversity, generally, very <strong>of</strong>ten because <strong>of</strong> the particular structure through which the identification<br />
<strong>of</strong> KBA has been funded, we have not had the luxury <strong>of</strong> incorporating these field work components.<br />
So the identification process has been solely based on literature, museum specimens and remotely<br />
sensed data which in my opinion is a weakness. The ideal time is rather longer. Associated <strong>with</strong> this,<br />
there is no expectation that the process be completed <strong>with</strong> the support <strong>of</strong> KBA identification. It should<br />
rather be an iterative process that continues on in<strong>to</strong> the future. E<strong>special</strong>ly when looking at the points<br />
discussed earlier about the <strong>importance</strong> <strong>of</strong> KBA being sites that should be managed for biodiversity<br />
conservation, the identification <strong>of</strong> sites should be flexible in<strong>to</strong> the future, as land-use patterns change<br />
as habitat destruction progresses and as underlying data and datasets change. At the moment work<br />
is being performed in close collaboration <strong>with</strong> the IUCN on local freshwater and global marine<br />
assessments. The large data sets that emerge from the IUCN will aid in the identification <strong>of</strong> many<br />
176
APPENDIX<br />
new KBA in aquatic biomes where not many important sites have been identified <strong>to</strong> date. While the<br />
process can reach a persistent baseline <strong>with</strong>in a couple <strong>of</strong> years, it will run on at a low level in<strong>to</strong> the<br />
future.<br />
• B. Cost: As an estimate, how much does the identification process cost?<br />
This question is difficult <strong>to</strong> answer. There are a lot <strong>of</strong> different components <strong>to</strong> the KBA process. The<br />
core underpinning <strong>of</strong> the KBA approach lies in decades or even centuries <strong>of</strong> collecting biodiversity<br />
data. This being further assessed through the process <strong>of</strong> extinction risk and evaluation by the<br />
concept <strong>of</strong> the IUCN <strong>of</strong> threatened species. This, in itself, is a substantial process. Then the next<br />
step; the identification <strong>of</strong> baseline KBA themselves which has been the focus <strong>of</strong> this conversation.<br />
There is prioritisation which is the process <strong>of</strong> not just <strong>identify</strong>ing the full set <strong>of</strong> KBA, but also which<br />
sites should be targets for the most urgent conservation actions. Finally, and critically there is the<br />
implementation <strong>of</strong> conservation at the sites and subsequent moni<strong>to</strong>ring which will inevitably be the<br />
most resource intensive in the entire process.<br />
So, we are relatively hesitant <strong>to</strong> focus on the identification phase <strong>to</strong> the exclusion <strong>of</strong> that full cycle.<br />
There is no point in identification, if it does not support implementation.<br />
The KBA identification phase for about 10 regions has on average cost approximately 1000<br />
US$/KBA. Therefore, for a country or region containing 50 KBA, the cost would be in the order <strong>of</strong><br />
50,000$. To put this in perspective, Birdlife International has identified and estimates the<br />
identification <strong>of</strong> about 10,000 IBA worldwide. The anticipation for KBA on land (i.e. incorporating data<br />
from other terrestrial taxa) is that the <strong>to</strong>tal number <strong>of</strong> KBA will be about double that, likely about<br />
20,000. As the process is not yet completed, it is difficult <strong>to</strong> be precise. There will definitely be many<br />
more sites in the marine and freshwater environments, but presently we do not have an estimate <strong>of</strong><br />
this.<br />
International organisations support the identification process through fundraising. They also support<br />
the scientific process through access <strong>to</strong> literature, such as biodiversity databases, remote sensing<br />
data, etc. However, it is absolutely key for the process <strong>to</strong> be embedded <strong>with</strong>in national institutions. In<br />
most cases these are civil society institutions, so there is <strong>of</strong>ten considerable CI involvement, through<br />
local branches rather than the global institution.<br />
• C. Human Resources: Can non-<strong>special</strong>ist users aid in the identification process?<br />
Again it depends very much on local capacity. The typical way in which KBA processes have<br />
proceeded over the last decade or so is that they have been convened, <strong>with</strong>in countries, by teams <strong>of</strong><br />
about 3-6 people for data compilation and organisation. That data is then fed in<strong>to</strong> expert review<br />
workshops for validation and correction. So, it is fair <strong>to</strong> say that a relatively small number <strong>of</strong><br />
pr<strong>of</strong>essionals are involved in organising and managing the process, but then a much broader<br />
community comes <strong>to</strong> the table for reviewing and participation.<br />
But the expert review would not be through paid consultancies. We try quite hard <strong>to</strong> avoid one size<br />
fits all solutions. The single aspect which we strive <strong>to</strong> maintain is the global standards criteria<br />
underlining all KBA. In contrast, the actual process for KBA identification and conservation will vary<br />
enormously around the world. So there is no desire <strong>to</strong> impose a single approach on fac<strong>to</strong>rs such as<br />
cost, human resource requirements etc.<br />
• These species based thresholds which are globally set can pose problems in biodiverse <strong>areas</strong>,<br />
as entire countries should be designated KBA according <strong>to</strong> the strict global standards and<br />
criteria.<br />
That is a fair concern. It is fair <strong>to</strong> say that the exact level at which thresholds have been set (even the<br />
structure <strong>of</strong> the criteria) is a work in progress. But it is correct that it is important that the global<br />
thresholds be set so that the approach has appropriate relevance <strong>with</strong>in a national context. This<br />
works in both directions, both in biodiverse rich <strong>areas</strong> (such as Indonesia) where it is important that<br />
177
A4-INTERVIEW PARTNER M<br />
the approach highlights sites that are particularly important and not <strong>to</strong> <strong>identify</strong> the entire country,<br />
e<strong>special</strong>ly since this is already known. In biodiverse poorer regions (for example Germany) it is<br />
important for national relevance that the approach is also sensitive enough <strong>to</strong> <strong>identify</strong> those sites that<br />
have significance. There is a balancing act that requires continuous attention at the levels <strong>of</strong><br />
thresholds <strong>with</strong>in the global criteria. Given the fact that the process has been underway for 30 years<br />
now and in particular focused on the incorporation <strong>of</strong> biodiversity beyond birds for 10 years, it is fair<br />
<strong>to</strong> say that considerable progress in converging appropriate criteria and thresholds has been made.<br />
This is, however, not yet complete.<br />
The congregation criteria <strong>identify</strong> sites not at the species level, but rather the concentration <strong>of</strong> large<br />
numbers <strong>of</strong> a given species at a given time. This applies <strong>to</strong> migra<strong>to</strong>ry species. It has become clear<br />
that the application <strong>of</strong> this criterion, in particular in the marine environment, is problematic at the<br />
moment. Very large concentrations <strong>of</strong> some marine species (eg. the green turtle) exist, but in terms<br />
<strong>of</strong> the global population this congregation is still fairly small. There are some continuing <strong>areas</strong> <strong>of</strong><br />
testing and refinement necessary for some aspects <strong>of</strong> this criterion.<br />
IV<br />
Summary, evaluation & outlook<br />
• How meaningful can <strong>approaches</strong> used for identification <strong>of</strong> biodiversity relevant <strong>areas</strong> be for<br />
conservation?<br />
Try <strong>to</strong> avoid the term efficiency. In general, efficiency is a fairly misleading concept in conservation<br />
terms. It is obviously important when looking from the perspective <strong>of</strong> an individual organisation, but it<br />
leaves the impression that there is a single global conservation power trying <strong>to</strong> maximise its ‘bang for<br />
the buck’ or its ‘dollar here relative <strong>to</strong> a dollar there’. This is obviously not the case.<br />
I think that highlighting important sites that are not currently on the conservation agenda is actually<br />
one <strong>of</strong> the important strengths <strong>of</strong> the KBA approach. Given the focus on conservation practicality, the<br />
approach is designed <strong>to</strong> reinforce existing conservation implementation. So, current national park<br />
systems and protected <strong>areas</strong> will very <strong>of</strong>ten feature <strong>with</strong>in KBA identification, but the approach<br />
highlights important sites which are beyond existing protected area systems. In general, across<br />
regions where KBA have been identified, we have found that perhaps half or more KBA are not<br />
currently protected <strong>areas</strong> or targeted <strong>with</strong> site safeguard <strong>approaches</strong>. So, drawing attention <strong>to</strong> these<br />
overlooked priority sites is a very important characteristic <strong>of</strong> the approach.<br />
• Do you have any further points you would like <strong>to</strong> add?<br />
Another important point is the relationship between KBA and AZE. KBA is an umbrella approach for<br />
more specific <strong>approaches</strong> in <strong>identify</strong>ing important bird <strong>areas</strong>, important plant <strong>areas</strong> etc. Sites<br />
identified by AZE also fit under this. AZE is effectively the application <strong>of</strong> prioritisation among sites<br />
<strong>with</strong> the application <strong>of</strong> irreplaceability and vulnerability concepts <strong>of</strong> systematic conservation planning<br />
across KBA <strong>areas</strong>. The aim <strong>of</strong> AZE is <strong>to</strong> fast track the identification <strong>of</strong> those ‘tip <strong>of</strong> the iceberg’ most<br />
important sites, <strong>to</strong> determine the extreme values under both the vulnerability and irreplaceability<br />
criteria. AZE, as IBA and so on, form an important subset <strong>of</strong> KBA. However, AZE is a different<br />
dimension <strong>of</strong> the subset, as it has the highest priority in the global field. This has been quite exciting<br />
as a lot <strong>of</strong> attention is being paid <strong>to</strong> AZE, both nationally and globally. A number <strong>of</strong> countries have<br />
adopted AZE <strong>to</strong> develop national alliances for zero extinction and <strong>to</strong> implement these in safeguarding<br />
the most important KBA. They have also been accelerating quite a lot globally. As we <strong>to</strong>uched on<br />
earlier, the KBA are not yet comprehensively identified globally, in contrast <strong>to</strong> AZE. Therefore, AZE<br />
has been adopted as a global indica<strong>to</strong>r <strong>with</strong>in the context <strong>of</strong> the CBD and other mechanisms.<br />
178
APPENDIX<br />
Furthermore, the question <strong>of</strong> wrapping up the loose ends around some <strong>of</strong> the yet <strong>to</strong> be finalised<br />
criteria remains. In particular, the criteria for habitats and biomes. There is less <strong>of</strong> an issue around<br />
the species level criteria. There are criteria for habitats and biomes, which are very poorly expressed<br />
and implemented at the moment, but they have been applied quite widely for both birds and plants.<br />
So it is important <strong>to</strong> not ignore them. There are still questions about the consolidation <strong>of</strong> the global<br />
criteria, clearly not unexpected, in the development <strong>of</strong> processes <strong>to</strong>wards the emergence <strong>of</strong> a global<br />
standard. In any domain this takes a long time <strong>to</strong> address the final details. A good example is the<br />
development <strong>of</strong> the IUCN red list <strong>of</strong> threatened species which has a 50 year his<strong>to</strong>ry (early 1960), but<br />
it is only <strong>with</strong>in the last 20 years that consistent global standards have emerged. Through the 1990's<br />
there was a lengthy consultative process <strong>to</strong> converge the final details <strong>of</strong> the global standards for the<br />
red list. We see the process for global standards for KBA as being similar. Over the last couple <strong>of</strong><br />
months IUCN has convened a global process <strong>to</strong> work over the coming 4 years in order <strong>to</strong> consolidate<br />
these global standards and criteria; <strong>to</strong> coordinate all data sets, uniting expertise in setting<br />
conservation targets and priorities from the practitioners in the conservation centres,<br />
intergovernmental agencies and academia, <strong>to</strong> solidify the specifics <strong>of</strong> these global standards.<br />
E<strong>special</strong>ly for the aspects <strong>of</strong> the uncertain criteria on habitats and biomes and their thresholds. This<br />
process will be underway over the coming 4 years through a joint task force convened by the species<br />
survival commission and the IUCN world commission on protected <strong>areas</strong>. In my opinion your specific<br />
thesis and contribution will in turn provide some quite important information feeding in<strong>to</strong> the task<br />
force, as we move through this process over the coming years.<br />
179
A4-INTERVIEW PARTNER N<br />
A4-13 Interview Partner N<br />
II<br />
Approaches & their characteristics<br />
• Which <strong>approaches</strong> do you use?<br />
We are creating Wildlands Network Designs (WND). Each <strong>of</strong> those designs individually represents a<br />
different ecoregion. For example, in Arizona we have created the Sky Islands WND which<br />
encompasses parts <strong>of</strong> two states and Mexico. These are fairly large ecoregions. In addition, four<br />
other WNDs that are linked on a North-South axis stretching from Northern Mexico <strong>to</strong> Alaska, have<br />
been created. This entire region is referred <strong>to</strong> as the ‘spine <strong>of</strong> the continent’.<br />
• So, if I have unders<strong>to</strong>od you correctly, it is taking ecoregions and trying <strong>to</strong> link them?<br />
Exactly. Ecoregions or important habitats <strong>with</strong>in ecoregions are only valuable if they can connect <strong>with</strong><br />
other viable habitats or other ecoregions. This is based on the need for protecting/res<strong>to</strong>ring large<br />
preda<strong>to</strong>rs and other wide-ranging species which can include other species besides preda<strong>to</strong>rs. But we<br />
are attempting <strong>to</strong> res<strong>to</strong>re and protect his<strong>to</strong>rical migra<strong>to</strong>ry routes in<strong>to</strong> the distant future.<br />
• Do you work <strong>with</strong> already identified ecoregions or do you also <strong>identify</strong> new ecoregions?<br />
It is a mix. There are several different existing ways that ecoregions have been identified. We use<br />
these, but we also start from scratch and attempt <strong>to</strong> determine whether the pre-existing boundaries<br />
are in fact the ones that conform <strong>to</strong> our approach.<br />
• Could you describe any strengths and weaknesses <strong>of</strong> the <strong>approaches</strong> you have used?<br />
We have been using different types <strong>of</strong> methodologies, experimenting <strong>with</strong> these <strong>to</strong> optimise them.<br />
The strengths are that not only GIS based science is involved, but also people who understand and<br />
know these regions on the ground (i.e. ground truthing), in addition <strong>to</strong> the most advanced science<br />
available. So the combination makes it strong.<br />
A weakness would be that we are never quite certain that the methodology is the best for every<br />
situation. For example, we completed a "best science workshop" <strong>to</strong> try and determine this: what is<br />
the best method <strong>to</strong> create WND? The results are currently being written up. It was very difficult <strong>to</strong> get<br />
people <strong>to</strong> agree on one specific approach.<br />
• With regard <strong>to</strong> the criteria that I have used <strong>to</strong> perform the strengths - weakness analysis, can<br />
you think <strong>of</strong> any criteria that you would use <strong>to</strong> compare the various <strong>approaches</strong>?<br />
I would like <strong>to</strong> comment on your criteria.<br />
You have really covered the whole scope. So I would like <strong>to</strong> comment on the concepts that I am<br />
familiar. For the creation <strong>of</strong> WNDs two different types land are dealt <strong>with</strong>: 1. land that is managed by<br />
federal, state, and local agencies or governments, 2. privately owned land which is <strong>of</strong>ten more<br />
important. So <strong>with</strong>in one <strong>of</strong> the WND there is a <strong>to</strong>tal mix <strong>of</strong> different land-uses, public and private.<br />
Private land is more complex, as there are different kinds <strong>of</strong> entities involved, large and small scale.<br />
Private land is essentially individual or corporate owners. Thus, different <strong>approaches</strong> in working <strong>with</strong><br />
these different entities exist. With the public lands an assessment is performed <strong>to</strong> <strong>identify</strong> which<br />
lands are already protected and their level <strong>of</strong> protection. This assessment additionally identifies lands<br />
in need <strong>of</strong> protection <strong>to</strong> form part <strong>of</strong> the habitat linkage for wildlife. For instance, campaigning for a<br />
new wilderness designation on public lands, or lobbying the US forest service <strong>to</strong> implement<br />
management changes on protected lands. This is one way <strong>to</strong> influence federal lands. In the same<br />
way there is also state, county and city level government. Here, again, various <strong>approaches</strong> exist <strong>to</strong><br />
encourage the improvement or implementation <strong>of</strong> protection for specifically identified <strong>areas</strong>.<br />
Again different kinds <strong>of</strong> <strong>approaches</strong> exist for private land owners who predominantly own large<br />
ranches for agricultural operations. Here different communication methods may be useful. The most<br />
important <strong>of</strong> which is <strong>to</strong> encourage them <strong>to</strong> consider land protection via conservation easement.<br />
180
APPENDIX<br />
This is a very important conservation <strong>to</strong>ol. For example, a farmer owns 100 acres <strong>of</strong> land. Its<br />
undeveloped value would be 1 mill. The same land developed <strong>to</strong> its maximum extent, would have a<br />
value <strong>of</strong> 10 mill. The value <strong>of</strong> a conservation easement is determined by <strong>identify</strong>ing the difference<br />
between the two values (in this example 9 mill.). A land trust is an organisation which purchases this<br />
easement and moni<strong>to</strong>rs its requirements <strong>to</strong> ensure that the terms <strong>of</strong> the easement are followed by<br />
the land owner. The owner continues <strong>to</strong> hold the deed and is allowed <strong>to</strong> manage the land in a<br />
traditional manner. However, the land owner must avoid actions determined in the easement that<br />
would harm ecological values <strong>of</strong> the land, such as subdividing for a housing project. In the case <strong>of</strong><br />
cattle ranching, such a restriction might be no grazing in riparian zones. This is the most important<br />
way in which private land owners contribute <strong>to</strong> conservation.<br />
Another method would be <strong>to</strong> try and convince private landowners <strong>to</strong> change their management<br />
practices through incentives. This is less effective, but can sometimes works, if clear information is<br />
presented.<br />
• How do you measure the efficiency <strong>of</strong> the <strong>approaches</strong> you use?<br />
This would clearly be through moni<strong>to</strong>ring. Public lands could be moni<strong>to</strong>red. For example, foresters<br />
can be checked <strong>to</strong> make sure that management changes are being implemented (removal fences). In<br />
the case <strong>of</strong> private land, the land trust would be responsible for moni<strong>to</strong>ring the land <strong>to</strong> make sure the<br />
owner was not developing. Obviously moni<strong>to</strong>ring is a long term process and sometimes the changes<br />
are not very visible in the short term, e<strong>special</strong>ly the long term changes aimed for.<br />
• But do you moni<strong>to</strong>r the biodiversity values at all?<br />
Absolutely. A field team is required <strong>to</strong> perform any moni<strong>to</strong>ring exercises.<br />
III<br />
Approaches & their requirements<br />
• A. Time: As an estimate, how much time is required for the creation <strong>of</strong> a WND?<br />
Generally speaking it takes about 2-3 years <strong>to</strong> complete the necessary research and then <strong>to</strong> publish<br />
the results.<br />
Implementation is a whole different ball game. This may take a whole generation <strong>to</strong> complete, as<br />
these are long term projects.<br />
The Sky Islands WND was the first <strong>to</strong> be completed and was published in 2000. The implementation<br />
process has been going on for 10 years, associated <strong>with</strong> this, is a long list <strong>of</strong> success s<strong>to</strong>ries.<br />
However, this is an extremely slow process, thus one success s<strong>to</strong>ry per year may well be the norm.<br />
For example, the implementation <strong>of</strong> a habitat protection programme in the surrounding <strong>areas</strong> <strong>of</strong> a<br />
large city. WNDs are used as guidelines <strong>to</strong> <strong>identify</strong> where the habitat linkages should go. This is used<br />
<strong>to</strong> purchase important <strong>areas</strong> which may involve many 1000 <strong>of</strong> acres. Other examples, the<br />
designation <strong>of</strong> new protected lands <strong>with</strong>in an WND, such as the creation <strong>of</strong> a national conservation<br />
area; or the adoption <strong>of</strong> a conservation easement package by a private land owner<br />
• B. Cost: How much does the identification <strong>of</strong> a WND cost?<br />
It may cost 100,000 US$ up <strong>to</strong> 1 mil US$, depending on the size <strong>of</strong> the project.<br />
• C. Human resources: For <strong>identify</strong>ing a WND, which human resources are required? Is it only<br />
possible <strong>to</strong> use experts or can non-expert users be part <strong>of</strong> the identification process?<br />
The required human resources are very diverse and wide-spread. We rely on scientist at the base<br />
level <strong>to</strong> <strong>identify</strong> and map these <strong>areas</strong>. Once this has occurred, other experts, for instance<br />
communication experts and land-trust personnel, become very important for the implementation<br />
process. Wide spread, extremely intensive use <strong>of</strong> human resources is required.<br />
181
A4-INTERVIEW PARTNER N<br />
• E. Purpose <strong>of</strong> the approach: Does anyone <strong>with</strong>in your organisation moni<strong>to</strong>r biodiversity <strong>to</strong><br />
determine the efficiency?<br />
Yes, moni<strong>to</strong>ring is part <strong>of</strong> the process. We are a non-pr<strong>of</strong>it organisation, thus, fund-raising is a major<br />
way <strong>of</strong> obtaining revenue for conservation activities. When a large grant form a foundation has been<br />
given, reporting <strong>to</strong> the foundation is required. So, moni<strong>to</strong>ring is important. Another reason for<br />
moni<strong>to</strong>ring is <strong>to</strong> make sure the habitat is being protected.<br />
Many partner organisations in the Sky Island region work <strong>to</strong>gether <strong>to</strong> implement habitat protection.<br />
They all moni<strong>to</strong>r, in their own way. Thus, there is always general moni<strong>to</strong>ring occurring.<br />
• F. Certification: In your opinion, how do market based initiatives fare in biodiversity<br />
conservation?<br />
There is not a very strong certification process available presently for habitat protection. Harvesting<br />
<strong>of</strong> private forest lands is a different s<strong>to</strong>ry, here certification processes are available. However, at the<br />
level <strong>of</strong> pure habitat protection, not many certification schemes exist.<br />
IV<br />
Summary, evaluation & outlook<br />
• How meaningful can <strong>approaches</strong> used for identification <strong>of</strong> biodiversity relevant <strong>areas</strong> be for<br />
conservation? Or do you think efforts should rather concentrate on existing biodiversity<br />
initiatives rather than <strong>identify</strong>ing new <strong>areas</strong>?<br />
That could be one <strong>of</strong> the most important aspects <strong>of</strong> future work. The reason for that is, the <strong>areas</strong><br />
protected now, may not be the <strong>areas</strong> needed <strong>to</strong> be protected in the future due <strong>to</strong> climate change. We<br />
are working developing GIS mapping based <strong>to</strong>ols, called range-shift <strong>to</strong>ols. Essentially, they make<br />
projections based on temperature increases, on where the wildlife will go. This is a model and thus<br />
the projections are not certain, e<strong>special</strong>ly since it is difficult <strong>to</strong> predict where the temperature changes<br />
are going <strong>to</strong> take place.<br />
• Using these range-shift <strong>to</strong>ols, are you going back <strong>to</strong> the existing WNDs and modifying them?<br />
No, the existing WNDs have not been modified yet <strong>to</strong> reflect climate change, But once climate<br />
change <strong>to</strong>ols are perfected, WNDs will need <strong>to</strong> be modified.<br />
• Are there any other current debates going on <strong>with</strong>in your organisation?<br />
Are you familiar <strong>with</strong> the conflict going on along the US-Mexican border? We have a problem <strong>with</strong><br />
wide scale illegal immigration. So our government has decided <strong>to</strong> build a wall bisecting very<br />
important wildlife migra<strong>to</strong>ry routes. I spend a lot <strong>of</strong> time lobbying the federal agencies <strong>to</strong> open wildlife<br />
corridors. A lot <strong>of</strong> our work is based on s<strong>to</strong>pping habitat fragmentation. This border wall is a true<br />
nightmare as it opens us up <strong>to</strong> heavy criticism for not wanting <strong>to</strong> protect our own country from<br />
terrorist and other illegal entrees. We have a set <strong>of</strong> recommendations for border security operations<br />
that both allow for wildlife connectivity and protect our security at the same time.<br />
• Do you have any further points you would like <strong>to</strong> add?<br />
Other countries around the world are now starting <strong>to</strong> implement the WND. For example, in Australia,<br />
conservation organisations <strong>with</strong> the help <strong>of</strong> the government have begun <strong>to</strong> look at the concept. We<br />
are really excited that this is going outside <strong>of</strong> the boundaries <strong>of</strong> the US, Canada and Mexico in<br />
influencing the way other countries are doing conservation work.<br />
• Do you think one would be able <strong>to</strong> implement something similar in Europe <strong>with</strong> it being so<br />
heavily developed?<br />
It will be much more difficult. However, there is an effort underway in Romania <strong>to</strong> create some <strong>of</strong><br />
these wildlife corridor protection projects. But overall, the more developed the land is, the more<br />
difficult it will be <strong>to</strong> create large landscape scale habitat corridors. There is a limit.<br />
182
APPENDIX<br />
A4-14 Interview Partner O<br />
II<br />
Approaches & their characteristics<br />
• Which <strong>approaches</strong> do you know?<br />
The most familiar one is the FSA and something perhaps similar the HCV approach in the sense<br />
that it looks at different types <strong>of</strong> ecosystems or forest systems. The FSA has been compared <strong>to</strong><br />
processes that follow biodiversity indices such as large forested patches and wetlands-like <strong>areas</strong>.<br />
These were compared through determining how many Heritage Areas overlapped when looking<br />
at the maps generated by the various <strong>approaches</strong>.<br />
In essence inven<strong>to</strong>ries were performed <strong>to</strong> determine the occurrence <strong>of</strong> significant ecosystems<br />
unique <strong>to</strong> an area defined at the level <strong>of</strong> local, regional and national. For example, a cluster <strong>of</strong><br />
White Pine trees not usually found in the area will be given Natural Heritage Site status as it is<br />
unique <strong>to</strong> that region.<br />
I have no experience <strong>with</strong> a REA. ERBC, I have not actually conducted an assessment myself.<br />
KBA is something similar <strong>to</strong> what was mentioned above.<br />
• Could you describe any strengths or weaknesses <strong>of</strong> the FSA?<br />
One strength is that species <strong>with</strong> available data are chosen, thus, species occurrence based on<br />
habitat type can actually be mapped. To determine the focal species, information from about 40<br />
experts in species conservation was collected and a Delphi Survey was performed. The focal<br />
species turned out <strong>to</strong> be species <strong>with</strong> known habitat requirements and species occurrence maps<br />
were drawn.<br />
The downside is that there is not lot <strong>of</strong> data that demonstrates the co-occurrence <strong>of</strong> these<br />
species. There is, however, some indication that the co-occurrence <strong>of</strong> species depends on the<br />
scale at which one examines them.<br />
The other advantage is that the selected focal species are <strong>of</strong>ten species people are familiar <strong>with</strong>.<br />
So it is much easier <strong>to</strong> have conversations <strong>with</strong> planners, for example, about those species.<br />
• What criteria would be important for you <strong>to</strong> compare the different <strong>approaches</strong>?<br />
If considering <strong>areas</strong> <strong>with</strong> high development pressure, other criteria may be more important. In<br />
these <strong>areas</strong> changes occur very quickly, thus, it is <strong>of</strong>ten difficult <strong>to</strong> use an approach that takes a<br />
long time <strong>to</strong> try and direct those changes in a way that is less harmful <strong>to</strong> biodiversity. On these<br />
criteria the availability <strong>of</strong> data <strong>to</strong> actually work <strong>with</strong> is fairly important, so this should be placed<br />
high up on the list.<br />
Are all levels <strong>of</strong> biodiversity assessed? This is probably not as much as a driving fac<strong>to</strong>r when<br />
developing plans for smaller <strong>areas</strong>. This is e<strong>special</strong>ly true if one is not working <strong>with</strong> a global plan<br />
where one tries <strong>to</strong> make sure that one has representation <strong>of</strong> all global ecosystem types. So<br />
certain criteria might not be as critical as they would be for someone using a different approach.<br />
The relevance and priority <strong>of</strong> the criteria depend very much on the objective <strong>of</strong> the project.<br />
It is difficult <strong>to</strong> perform <strong>to</strong>p-down <strong>approaches</strong> in the US, particularly in the South Eastern US<br />
where there is a very strong feeling <strong>of</strong> property rights. It is very difficult <strong>to</strong> prescribe measures <strong>to</strong><br />
protect biodiversity. So a bot<strong>to</strong>m-up approach, such as convincing land-owners that it is the right<br />
thing <strong>to</strong> do, is the most practical way <strong>to</strong> achieve anything in a reasonable amount <strong>of</strong> time.<br />
All <strong>of</strong> these criteria are good. The <strong>importance</strong> <strong>of</strong> each criterion depends on what is trying <strong>to</strong> be<br />
accomplished.<br />
What about how long it takes? If the aim is <strong>to</strong> work <strong>with</strong> a developer <strong>to</strong> make their project as<br />
friendly <strong>to</strong> wildlife as possible, two questions will arise: how much does it cost and how long will it<br />
take? If either one <strong>of</strong> those are <strong>to</strong>o large, it will not happen.<br />
• How would you best measure the efficiency <strong>of</strong> the <strong>approaches</strong> in general? What would you<br />
see as important for an approach <strong>to</strong> be efficient?<br />
Efficiency is input vs output: the ultimate measure would be <strong>to</strong> see whether the plan is successful<br />
in conserving whatever was aimed at being conserved. This is incredibly difficult <strong>to</strong> evaluate at<br />
183
A4-INTERVIEW PARTNER O<br />
any large scale, as much data on species occurrences is lacking. Even in wealthy countries such<br />
as the USA or places in Europe <strong>with</strong> the available resources, much basic information on species<br />
occurrence and population status is lacking. Thus, this type <strong>of</strong> output is extremely difficult <strong>to</strong><br />
measure. This is one <strong>of</strong> the things we are struggling <strong>with</strong>, how <strong>to</strong> determine the success <strong>of</strong> land<br />
conservancies.<br />
So one should try and look for other ways <strong>to</strong> determine output, while obtaining outcome data on<br />
whether the targeted species are actually persisting. These would include aspects such as<br />
whether threats <strong>to</strong> the species are being reduced. For example, if one concentrates on species<br />
that require forests, has one successfully reduced the threats <strong>to</strong> those habitats, is one protecting<br />
the habitat, is the rate or decline decreasing or halted? Is the amount <strong>of</strong> habitat increasing? Are<br />
the things that are threatening the species and system <strong>of</strong> interest being abated? These are<br />
measures <strong>of</strong> the outcome. This could be on the output side.<br />
On the input side, aspects such as money, time and other resources required <strong>to</strong> accomplish the<br />
objectives. Then efficiency could be looked at.<br />
Not many people are actually addressing this. All land trusts in the US report <strong>to</strong> conserve such<br />
features as water quality, wildlife, etc. When they report on their activities and accomplishments,<br />
they tend <strong>to</strong> all report on the how many acres have been protected and how many dollars have<br />
been raised. They may rarely talk about whether or not their actions are actually conserving<br />
whatever they are trying <strong>to</strong> safeguard other than the fact that they protected 3000 acres <strong>of</strong> forest,<br />
for example. That is as far as it goes <strong>with</strong> most <strong>of</strong> the land conservancies. This does not apply <strong>to</strong><br />
larger organisations such as TNC which are beginning <strong>to</strong> address the ecological effects <strong>of</strong> their<br />
actions. This applies <strong>to</strong> smaller, more local conservancies. So they do not really determine that<br />
they have protected an area so that species such as the oven bird will persist and is persisting.<br />
They are not getting <strong>to</strong> that step <strong>of</strong> assuring the outcome <strong>of</strong> the results. That is extremely difficult,<br />
time consuming and cost intensive. These resources many <strong>of</strong> these conservancies do not have.<br />
There is a not completely unreasonable argument that given what is being faced in many places,<br />
the appropriate thing <strong>to</strong> do right now is <strong>to</strong> purchase and protect as much land as possible and <strong>to</strong><br />
worry about the questions <strong>of</strong> efficiency later. These questions are starting <strong>to</strong> be tackled, partly<br />
because, the funding organisations are starting <strong>to</strong> ask these questions: a lot <strong>of</strong> money is being<br />
spent, a lot <strong>of</strong> land is being bought and is anything happening? So this is definitely coming, this<br />
whole issue <strong>of</strong> accountability is going <strong>to</strong> become increasingly important.<br />
III<br />
Approaches & their requirement<br />
• A. Time: How much time is required for the identification <strong>of</strong> <strong>areas</strong> using the FSA?<br />
To create the map, it <strong>to</strong>ok almost 1 year, as we were new <strong>to</strong> the approach. But it can be done in<br />
1-2 months, once the focal species are known. To <strong>identify</strong> the focal species, it might take one<br />
further month.<br />
So for someone <strong>to</strong> work on the approach full-time, it could probably be done in about 6 months.<br />
• Are you talking about an area <strong>with</strong> a lot <strong>of</strong> available species data?<br />
Yes or at least, data available on habitats <strong>of</strong> local species. Even in places where data is not that<br />
good in terms <strong>of</strong> species inven<strong>to</strong>ries, the people working in conservation in those <strong>areas</strong> have a<br />
fairly good sense <strong>of</strong> what they could use as focal species. There is probably some data for those<br />
species about their habitat requirements, what their home ranges are and so on. These being the<br />
key requirements for performing a FSA. So even though the overall situation might be poor in<br />
species data, someone might be able <strong>to</strong> pull <strong>to</strong>gether a focal species plan <strong>with</strong> limited amount <strong>of</strong><br />
data. Then the question becomes how well does it actually work when implemented?<br />
• For the identification stage what is size-scale at which one works?<br />
In general, they would be regional or smaller area maps. 100's <strong>of</strong> 1000's <strong>of</strong> km 2 , somewhere in<br />
that region. Continental focal maps would tend <strong>to</strong> be at a coarser scale. FSA are usually<br />
184
APPENDIX<br />
performed at a smaller spatial scale, as species, very specific habitat types and home ranges are<br />
dealt <strong>with</strong>. Could a species map for the barred owl for the entire US be drawn? It probably could,<br />
but would anyone? I am not so sure. It may be useful <strong>to</strong> help <strong>identify</strong> biodiversity hotspots, as<br />
these usually come from species data and not from focal species<br />
• B. Cost: as an estimate, how much does the identification process cost?<br />
This was done <strong>with</strong> graduate students. So there is a distinction between how much it cost us and<br />
how much it would cost <strong>to</strong> pay a consultant.<br />
One way <strong>to</strong> come up <strong>with</strong> an estimate is <strong>to</strong> think about the 3 months time frame.<br />
For the area we assessed, it would be in the order <strong>of</strong> 10's <strong>of</strong> 1000's <strong>of</strong> US$ for consultants. That<br />
is fairly rough estimate.<br />
• C. Human Resources: What are the human resource requirements for <strong>identify</strong>ing <strong>areas</strong><br />
using the FSA?<br />
All our work was performed using graduate students working on wildlife degrees. So they had a<br />
good biological background. They were learning about wildlife and they knew how <strong>to</strong> use GIS and<br />
how <strong>to</strong> do library research on the habitat needs <strong>of</strong> the selected focal species. So the whole<br />
process could be done <strong>with</strong> graduate students. If it is done this way, it is going <strong>to</strong> be less costly,<br />
but it will also take longer. Because graduate students are typically learning as they are doing it.<br />
If pr<strong>of</strong>essional consultants worked full-time on the assessment, it could be done in 3-4 months.<br />
To select the focal species, those individuals would have <strong>to</strong> develop a network <strong>to</strong> <strong>identify</strong> the<br />
species using perhaps a Delphi Survey or another approach. This is a fairly simple requirement,<br />
as the information just needs <strong>to</strong> be obtained from a variety <strong>of</strong> people. Then they would have <strong>to</strong><br />
have the expertise <strong>to</strong> evaluate the information and <strong>to</strong> determine the wildlife habitat needs for the<br />
focal species, translate that in<strong>to</strong> something that can be mapped on<strong>to</strong> a geographic information<br />
system, collect the data required for mapping. Thus, they would have <strong>to</strong> either find out or know<br />
where the satellite or land map data is available. Then they would have <strong>to</strong> put it all <strong>to</strong>gether <strong>to</strong><br />
create the maps.<br />
• Would it be possible for non-expert users <strong>to</strong> be part <strong>of</strong> the identification process? Nonexperts<br />
in conservation or wildlife.<br />
Someone who did not know a lot about wildlife could probably perform the survey in <strong>identify</strong>ing<br />
the focal species. To some degree an intelligent human being <strong>with</strong> geographical skills, able <strong>to</strong> do<br />
literature research and who knows how <strong>to</strong> talk <strong>to</strong> people might be capable <strong>of</strong> doing this. But there<br />
is something additional obtained, if a person who knows something about wildlife performs the<br />
analysis. The skilled person is more likely <strong>to</strong> recognise the types <strong>of</strong> follow-up questions, <strong>to</strong><br />
understand the nuances that may be necessary <strong>to</strong> get at the required data.<br />
• So basically, the quality <strong>of</strong> the outcome would be compromised if a non-expert user tried <strong>to</strong><br />
<strong>identify</strong> <strong>areas</strong> using the FSA?<br />
Firstly, the product will be better if an expert performs the assessment, such as a wildlife<br />
pr<strong>of</strong>essional <strong>with</strong> GIS background or a strong graduate <strong>with</strong> a men<strong>to</strong>r who understands the<br />
approach and has a network <strong>of</strong> university affiliates. The second issue relates <strong>to</strong> the credibility <strong>of</strong><br />
the product. Once the product has been made available, if it should be implemented, it would be<br />
helpful <strong>with</strong> regard <strong>to</strong> credibility if the information had expertise backing it.<br />
• How effective do you think the FSA is in conserving biodiversity?<br />
I do not know if anybody knows this. It seems like it is doing a reasonably good job, but it also<br />
seems that it is not a whole lot better than many <strong>of</strong> the more simple <strong>approaches</strong> which require a<br />
lot less time and effort. The simple plans that we assessed, are much easier <strong>to</strong> create, they<br />
require fewer resources and they really did fairly well, even compared <strong>to</strong> the more complex focal<br />
species plans. I have not seen any scientific empirical studies over any period <strong>of</strong> time that<br />
evaluates the outcome <strong>of</strong> the application plan, such as a FSA plan. Also in part, because the<br />
plans are created and not implemented for a variety <strong>of</strong> reasons. The correlation between<br />
indica<strong>to</strong>r species and other species is very dependent on the exact scale and the extent <strong>of</strong> region<br />
under consideration. Then one always ends up in the conversation on what else could be done. If<br />
185
A4-INTERVIEW PARTNER O<br />
this cannot be done, what can be done? This is a reasonable question, but it is almost a<br />
rationalisation for doing something, rather than admitting that this was done due <strong>to</strong> the best<br />
pr<strong>of</strong>essional judgement on an approach that was believed <strong>to</strong> work. Whether it really does work, is<br />
unknown.<br />
IV<br />
Summary, evaluation & outlook<br />
• How meaningful can <strong>approaches</strong> used for the identification <strong>of</strong> biodiversity relevant <strong>areas</strong> be<br />
for conservation? What in your opinion is more important, <strong>identify</strong>ing new <strong>areas</strong> for<br />
conservation or improving conservation <strong>of</strong> existing <strong>areas</strong>?<br />
In a sense you are asking me, where would I put my resources, if I were in the position <strong>to</strong><br />
decide? I would do some <strong>of</strong> each.<br />
Relative resources: It takes far more resources <strong>to</strong> actually implement a plan and manage an area<br />
for conservation than it does <strong>to</strong> create maps. So, it seems, if I had the resources I would want <strong>to</strong><br />
continue mapping out <strong>areas</strong> that are unknown. But in the case <strong>of</strong> the paper park’s issue which is<br />
particularly true in more developing countries where the pressure from people in poverty and<br />
distress is grave. To say that this is a preserve and that it is therefore protected is unreasonable.<br />
So some management needs <strong>to</strong> be implemented at some point in that area, as it may be a<br />
preserve in name, but not in reality. I do not think it is appropriate <strong>to</strong> completely ignore this. I<br />
would tend <strong>to</strong> put a lot <strong>of</strong> emphasis on the actual implementation in the <strong>areas</strong> that are already<br />
known. Whether that requires further refinement <strong>with</strong> FSA or other <strong>approaches</strong> is an open<br />
question. It may be more important <strong>to</strong> engage the communities who live possibly in or adjacent <strong>to</strong><br />
the reserve <strong>to</strong> find ways <strong>to</strong> work <strong>with</strong> them <strong>to</strong> protect those <strong>areas</strong>. Then one could always have a<br />
couple <strong>of</strong> people <strong>with</strong>in one's organisation (assuming one has an organisation) who could<br />
continue <strong>to</strong> look at unchartered terri<strong>to</strong>ry <strong>to</strong> see if there where things worth pursuing elsewhere.<br />
Unless one has a notion, as <strong>with</strong> the land conservancies where they decided that right now one<br />
just has <strong>to</strong>, at least in name, protect as much as possible. The argument being that if one does<br />
not do it now, then it will never be protected. With the goal <strong>of</strong> coming back in about 5 years <strong>to</strong><br />
really start managing it. If one is in that mind frame, it would seem reasonable <strong>to</strong> go ahead and<br />
protect as much as possible. Assuming that the protected can wait until management actually<br />
starts. Otherwise resources will be wasted if the protected land is not managed.<br />
• Do you have any further points you would like <strong>to</strong> add?<br />
I think we are starting <strong>to</strong> address the type <strong>of</strong> question just asked previously. Implementing these<br />
plans is an important step. At least in <strong>areas</strong> where there is pressure from suburban development,<br />
implementing these plans is very difficult. It is very easy <strong>to</strong> draw maps and say these are<br />
ecologically important <strong>areas</strong>. It is extremely difficult when a corporation comes in and says we<br />
would like <strong>to</strong> develop the area. That is extremely difficult <strong>to</strong> push back against, e<strong>special</strong>ly in the<br />
current climate in the US. We have <strong>to</strong> find ways <strong>to</strong> do this. Many <strong>of</strong> the land-use decisions are<br />
made by local planning government who <strong>of</strong>ten do not focus on conservation issues. They are tied<br />
up in a lot <strong>of</strong> other land-use activities. As important as it is <strong>to</strong> <strong>identify</strong> <strong>areas</strong> important for<br />
conservation, it is just as important <strong>to</strong> persuade agencies and people who make land-use<br />
decisions that conservation is important. This may be more important, as a fight may arise <strong>with</strong> a<br />
new project proposal. One ends up in the position <strong>of</strong> the nay-sayers which is counterproductive.<br />
186
APPENDIX<br />
A5<br />
Strength-Weakness Analyses: Detailed <strong>Assessment</strong> Results<br />
A5-1 Strength-Weakness Pr<strong>of</strong>ile: High Conservation Value (HCV) Concept<br />
Table 17: Overview <strong>of</strong> data obtained for HCV strength-weakness pr<strong>of</strong>ile<br />
Criteria Strength Weakness<br />
A. Addressed<br />
biodiversity<br />
levels<br />
B. Addressed<br />
ecosystem<br />
types<br />
C. Geographic<br />
scale <strong>of</strong><br />
applicability<br />
D. Level <strong>of</strong><br />
approach<br />
E. Implementation<br />
style<br />
F. Suitability for<br />
different users<br />
J. Possibility <strong>of</strong><br />
scoping<br />
assessment<br />
• Species richness is addressed in<br />
HCV1 and HCV2 1<br />
• Ecosystem diversity is addressed in<br />
HCV3 1<br />
• Genetic variation is conserved in<br />
HCV2 2<br />
• Designed for the use in forest<br />
ecosystems<br />
• Grasslands have included in HCV<br />
identification process<br />
• Global implementation 3<br />
• Regional scale implementation 4,5<br />
• Local scale implementation 3<br />
• Local level always considers<br />
regional level 5,6<br />
• Designed for implementation at the<br />
private sec<strong>to</strong>r level 3<br />
• In some cases has been applied <strong>to</strong><br />
the public sec<strong>to</strong>r level 7<br />
• Generic HCV definitions are purely<br />
<strong>to</strong>p-down, as they rely on<br />
internationally defined criteria 3<br />
• Generic definitions then placed in a<br />
regional or national context, <strong>with</strong><br />
stakeholder participation, providing a<br />
bot<strong>to</strong>m-up approach 9<br />
• Combination <strong>of</strong> <strong>to</strong>p-down and<br />
bot<strong>to</strong>m-up 9<br />
• Combination <strong>of</strong> international and<br />
national experts 7,9,10 , e<strong>special</strong>ly for<br />
high impact operations 9<br />
• For low impact operations local user<br />
groups can perform assessment <strong>with</strong><br />
validation by expert 9<br />
• Stakeholder participation important<br />
part <strong>of</strong> entire process 11<br />
• During preparation, existing data and<br />
required data, existing and likely<br />
HCVs and the likely impact <strong>of</strong> the<br />
operation should be identified, as<br />
part <strong>of</strong> a pilot study 11<br />
• This enables the identification <strong>of</strong> the<br />
assessment team and the<br />
stakeholder consultation needs 11<br />
• No information found in literature<br />
or from interviews<br />
• Grasslands were not specifically<br />
targeted for identification 1<br />
• Has neither been designed for<br />
other terrestrial nor aquatic<br />
ecosystems<br />
• Regional level assessments for<br />
conservation planning purposes<br />
(eg. Brazil, Indonesia 3 ), outside <strong>of</strong><br />
FSC, result in small islands <strong>of</strong><br />
protected <strong>areas</strong> 7,8<br />
• Within the public sec<strong>to</strong>r level it<br />
attempts <strong>to</strong> <strong>identify</strong> the smallest<br />
possible area 7<br />
• No information found in literature<br />
or from interviews<br />
• No information found in literature<br />
or from interviews<br />
• Pilot study not sufficient <strong>to</strong> <strong>identify</strong><br />
existing or likely HCVs<br />
187
A5-1<br />
Criteria Strength Weakness<br />
J. Continued -<br />
Possibility <strong>of</strong><br />
scoping<br />
assessment<br />
K. Consideration <strong>of</strong><br />
threats<br />
L. Moni<strong>to</strong>ring<br />
recommenddations<br />
M. Management<br />
recommenddations<br />
Source: Own design<br />
• During planning, time requirements<br />
and the budget <strong>of</strong> the assessment<br />
are identified 11<br />
• Rapid assessment (site survey ~2<br />
days 12 ) is performed at the beginning<br />
<strong>to</strong> determine that HCVs are not<br />
present which minimises cost and<br />
time <strong>of</strong> an assessment 12,13<br />
• Threat assessment is divided in<strong>to</strong><br />
low impact and high impact 11<br />
• Both internal and external threats are<br />
easily identified using <strong>to</strong>ols such as<br />
the 5-S Framework, Participa<strong>to</strong>ry<br />
Conservation Planning (PCP) and<br />
the Threat Reduction <strong>Assessment</strong> 11<br />
• Potential impacts are ranked<br />
according <strong>to</strong> their severity, high,<br />
medium and low 11<br />
• Stakeholder participation<br />
encouraged in threat identification 11<br />
• Aims <strong>to</strong> develop a moni<strong>to</strong>ring plan <strong>to</strong><br />
which should detect changes in the<br />
status <strong>of</strong> an HCV and allow prompt<br />
action 11<br />
• General guidance on moni<strong>to</strong>ring is<br />
provided 14<br />
• Normally occurs through specifically<br />
identified indica<strong>to</strong>rs 14<br />
• Indica<strong>to</strong>rs include counts, water<br />
quality assessments and social<br />
aspects such as income derived<br />
from non-timber products 14<br />
• Basic ideas and processes for<br />
management strategies are<br />
outlined 14<br />
• Concept is about helping managers<br />
find a way <strong>to</strong> manage their land<br />
<strong>with</strong>out affecting the biodiversity or<br />
environmental and social values 14<br />
• No further information found in<br />
literature or from interviews<br />
• No information found in literature<br />
or from interviews<br />
• No information found in literature<br />
or from interviews<br />
• No information found in literature<br />
or from interviews<br />
1 Jennings S., Nussbaum R., Judd N., Evans T. (2003): High Conservation Value Forest Toolkit;<br />
Edition 1; Pr<strong>of</strong>orest; Oxford<br />
2 Stafford Smith M., Ash A. (2006): High Conservation Value in the Rangelands; Report <strong>of</strong> a workshop<br />
for the Australian Government Department <strong>of</strong> the Environment and Heritage, Desert Knowledge<br />
Cooperative Research Centre, Alice Springs<br />
3<br />
High Conservation Value Resource Network (2005 - 07): (retrieved: 29. May 2009)<br />
http://www.hcvnetwork.org/;<br />
4 Rayden T., Kruglianskas I., Stewart C. (2009): An assessment <strong>of</strong> potential High Conservation Values<br />
<strong>with</strong>in Cabo Delgado Province, Mozambique; Pr<strong>of</strong>orest; Oxford<br />
188
APPENDIX<br />
5 Punde S (2007): Prioritising <strong>areas</strong> for Forest Conservation in the Konkan region <strong>of</strong> the Western<br />
Ghats hotspot (India) - a pilot study; Applied Environmental Research Foundation (AERF)<br />
6<br />
Gesellschaft für Technische Zusammenarbeit (GTZ) GmbH (2008): Early Experience in<br />
Implementing Bi<strong>of</strong>uel Certification; Workshop for Policymakers and Practitioners; Federal Ministry for<br />
Economic Cooperation and Development (BMZ); Brussels<br />
7 Interview Partner E<br />
8 Lindhe, A. (2005-07): Extension from forests <strong>to</strong> other ecosystems and across landscapes; (retrieved<br />
07.06.2009) http://www.hcvnetwork.org/resources/comment-consultation<br />
9 Interview Partner D<br />
10 Interview Partner G<br />
11 Stewart C., George P., Rayden T., Nussbaum, R. (2008): Good practice guidelines for High<br />
Conservation Value assessment - a practical guide for practioners and audi<strong>to</strong>rs; Pr<strong>of</strong>orest; Oxford<br />
12 Pr<strong>of</strong>orest (2005-07)b: Part2: Defining High Conservation Values at national level: a practical guide;<br />
(retrieved 05.06.2009) http://www.hcvnetwork.org/resources/global-hcv-<strong>to</strong>olkits;<br />
13 Pollard E. H. B. (2005): Preliminary High Conservation Value Forest assessment for Ha Nung state<br />
forest enterprise; WWF Greater Mekong<br />
14 Pr<strong>of</strong>orest (2005-07)c: Part3: Identifying and managing High Conservation Values Forests: a guide<br />
http://www.hcvnetwork.org/resources/global-hcv-<br />
for forest managers; (retrieved 05.06.2009)<br />
<strong>to</strong>olkits;<br />
189
A5-2 Strength-Weakness Pr<strong>of</strong>ile: Key Biodiversity Areas (KBA) Approach<br />
Table 18: Overview <strong>of</strong> data obtained for the KBA strength-weakness pr<strong>of</strong>ile<br />
Criteria Strength Weakness<br />
A. Addressed<br />
biodiversity<br />
levels<br />
B. Addressed<br />
ecosystem<br />
types<br />
C. Geographical<br />
scale <strong>of</strong><br />
applicability<br />
D. Level <strong>of</strong><br />
approach<br />
E. Implementation<br />
style<br />
• Species level addressed through the<br />
species based criteria 1<br />
• KBA networks are large 1 and,<br />
therefore, able <strong>to</strong> conserve genetic<br />
diversity drift<br />
• Can be applied across all<br />
•<br />
biogeographic regions 1,2<br />
• Case studies for terrestrial and<br />
3,4 ,5,6 ,7<br />
aquatic ecosystems exist<br />
• National level identification <strong>with</strong> sitescale<br />
implementation 10<br />
• Provides a powerful watch list for the<br />
private sec<strong>to</strong>r <strong>to</strong> <strong>identify</strong> sites not<br />
suitable for development 11<br />
• Designed for use at the public sec<strong>to</strong>r<br />
level<br />
• Criteria and thresholds globally set 2<br />
• Local stakeholder participation<br />
sometimes included in identification<br />
and delineation 11<br />
• No rare, threatened or<br />
endangered ecosystems were<br />
identified<br />
A5-2<br />
Urgent need <strong>to</strong> increase available<br />
data on aquatic biodiversity <strong>to</strong><br />
improve KBA criteria 1,2,8<br />
• Due <strong>to</strong> global thresholds,<br />
identification at a regional or local<br />
level, may result in significant<br />
omission and or commission<br />
errors 9<br />
• Global thresholds have provided<br />
problems in priority setting 10<br />
• Not designed for implementation<br />
at the private sec<strong>to</strong>r level<br />
• Global thresholds have provided<br />
problems in priority setting at a<br />
local and regional scale 10<br />
• Local stakeholder inclusion<br />
normally only for the refinement <strong>of</strong><br />
delinetaion 3, 9<br />
F. Suitability for<br />
different users<br />
J. Possibility <strong>of</strong><br />
scoping<br />
assessment<br />
K. Consideration<br />
<strong>of</strong> threats<br />
• International and national experts<br />
vital for identification 1,2,12<br />
• Where possible chose national over<br />
international experts<br />
• Stakeholder participation required for<br />
delineation <strong>of</strong> sites 11<br />
• No information found in literature or<br />
from interviews<br />
• Internal threats: habitat loss and<br />
degradation, illegal logging, land<br />
conversions, drainage and pollution<br />
<strong>of</strong> wetlands, etc 13<br />
• External threats: urban development,<br />
demographic growth, invasive<br />
species, illegal trade <strong>of</strong> species, etc 13<br />
• Major future threat under<br />
consideration is climate change 13<br />
• Threats have been ranked high,<br />
moderate and low 4<br />
190<br />
• Participation only encouraged<br />
after KBA status has been given 9<br />
• Identification process embedded<br />
<strong>with</strong>in national institutions 11 , any<br />
scoping assessment will be left up<br />
<strong>to</strong> them<br />
• Identification and delineation is an<br />
iterative process 11 , making it<br />
difficult <strong>to</strong> design a scoping<br />
assessment<br />
• No information found in literature<br />
or from interviews
APPENDIX<br />
Criteria Strength Weakness<br />
L. Moni<strong>to</strong>ring<br />
recommenddations<br />
M. Management<br />
recommenddations<br />
Source: Own design<br />
• Moni<strong>to</strong>ring recommendations are<br />
given by the KBA process 2<br />
• Examples <strong>of</strong> moni<strong>to</strong>ring are<br />
provided: site level moni<strong>to</strong>ring<br />
provides information on the accuracy<br />
and current status <strong>of</strong> KBA;<br />
moni<strong>to</strong>ring is important at sites<br />
containing rare, threatened or<br />
engendered species whose threat is<br />
external 2<br />
• Moni<strong>to</strong>ring initiatives using remote<br />
sensing are underway and are fast,<br />
and cost effective 2<br />
• General management<br />
recommendations are provided in the<br />
form <strong>of</strong> examples: management is<br />
key for the habitat res<strong>to</strong>ration <strong>of</strong><br />
habitat; or depleted populations<br />
should be supplemented <strong>with</strong> captive<br />
or artificially breed species 2<br />
• Exact management strategies are<br />
left <strong>to</strong> the country or region 2<br />
• Finer scale moni<strong>to</strong>ring must<br />
supplement any moni<strong>to</strong>ring by<br />
remote sensing 2<br />
• No information found in literature<br />
or from interviews<br />
1 Eken G., Bennun L., Brooks T. M., Darwall W., Fishpool L. D. C., Foster M., Knox D., Langhammer<br />
P., Matiku P., Radford E., Salaman P., Sechrest W., Smith M. L., Spec<strong>to</strong>r S., Tord<strong>of</strong>f A. (2004): Key<br />
biodiversity <strong>areas</strong> as site conservation targets; Bioscience; 54(12):1110-1118<br />
2 Langhammer P. F., Bakarr M. I., Bennun L., Brooks T. M., Clay P. C., Darwall W., De Silva N., Edgar<br />
G. J., Eken G., Fishpool L. D. C., da Fonseca G. A. B., Foster M. N., Knox D. H., Matiku P., Radford<br />
E. A., Rodrigues A. S. L., Salaman P., Sechrest W., Tord<strong>of</strong>f A. W. (2007): Identification and analysis<br />
<strong>of</strong> Key Biodiversity Areas: Targets for comprehensive protected <strong>areas</strong> system; IUCN, Gland<br />
3 Eken G., Bozdoğan M., Karataş A., Lise Y. (2004): Key Biodiversity Areas: Identifying the world's<br />
priority sites for conservation – lessons learned from Turkey; Doğa Derneği, Ankara, Turkey<br />
4 Gerlach J. (2008): Setting conservation priorities - A Key Biodiversity Areas analysis for the<br />
Seychelles Islands; The Open Conservation Biology Journal 2:44-53<br />
5 Erdmann T. K. (2008): Ecoregional conservation and development in Madagascar; USAid (retrieved<br />
18. 08. 2009) http://www.usaid.gov/mg/so6_docs/ecoregional_approach.pdf<br />
6 CSIR (2007): Delineating key biodiversity <strong>areas</strong> for the New Guinea Wilderness; (retrieved<br />
18.10.2009) http://www.csiro.au/science/PNGMilneBay.html<br />
7 Edgar G. J., Langhammer P. F., Allen G., Brooks T. M., Brodie J., Crosse W., De Silva N., Fishpool<br />
L. D. C., Foster M. N., Knox D. H., McCosker J. E., McManus R., Millar A. J. K., Mugo R. (2008):<br />
Key Biodiversity Areas as globally significant target sites for the conservation <strong>of</strong> marine biological<br />
diversity; Aquatic Conservation: Marine and Freshwater Ecosystems; 18:969-983<br />
191
A5-2<br />
8 IBAT - Integrated Biodiversity <strong>Assessment</strong> Tool for Business (2008): Key Biodiversity Areas; Critical<br />
biodiversity information <strong>to</strong> support corporate decision-making; (retrieved 19.08.2009)<br />
http://www.ibatforbusiness.org/userfiles/docs/kbaandbusiness.pdf<br />
9 Knight A. T., Smith R. J., Cowling R. M., Desmet P. G., Faith D. P., Ferrier S., Gelderblom C. M.,<br />
Grantham H., Lombard A. T., Maze K., Nel J. L., Parrish J. D., Pence G. Q. K., Possingham H. P.,<br />
Reyers B., Rouget M., Roux D., Wilson K. A. (2007): Improving Key Biodiversity Areas approach for<br />
effective conservation planning; BioScience; 57(3):256-261<br />
10 Interview Partner G<br />
11 Interview Partner M<br />
12 Bird Conservation Nepal (2009): Developing civil society networks <strong>to</strong> conserve Key Biodiversity<br />
Areas in Nepal; focusing on the Kanchenjunga-Singalila Complex; CEPF final project completion<br />
report (retrieved 19.08.2009) http://www.cepf.net/Documents/Final_BCN_civil_society_networks.pdf<br />
13 García-Moreno J., Clay R. P., Ríos-Muñoz C. A. (2007): The <strong>importance</strong> <strong>of</strong> birds for conservation in<br />
the Neotropical region; Journal <strong>of</strong> Orthithology; 148(Suppl 2):321-326<br />
192
APPENDIX<br />
A5-3 Strength-Weakness Pr<strong>of</strong>ile: Ecoregion-Based Conservation (ERBC) Approach<br />
Table 19: Overview <strong>of</strong> data obtained for ERBC strength-weakness pr<strong>of</strong>ile<br />
Criteria Strength Weakness<br />
A. Addressed<br />
biodiversity<br />
levels<br />
B. Addressed<br />
ecosystem<br />
types<br />
C. Geographical<br />
scale <strong>of</strong><br />
applicability<br />
D. Level <strong>of</strong><br />
approach<br />
• Genetic diversity <strong>of</strong> species <strong>with</strong><br />
available genetic data has been<br />
selectively captured <strong>with</strong>in an ERBC<br />
assessment 1<br />
• Conservation <strong>of</strong> genetic diversity<br />
through representation and replication<br />
<strong>of</strong> conservation targets <strong>with</strong>in each<br />
subdivision <strong>of</strong> the ecoregion 1,12<br />
• Species richness is captured at two<br />
levels: 1. Coarse level – protects plant<br />
communities and ecological<br />
processes; 2. Fine level – identifies<br />
threatened, rare or endemic species<br />
<strong>with</strong> a <strong>special</strong> need for conservation 2<br />
• The Global 200 analysis identifies the<br />
most prominent biological features <strong>of</strong><br />
each priority ecoregion 3<br />
• This large scale analysis lays the<br />
groundwork for finer-scale analyses<br />
<strong>with</strong>in the ecoregion <strong>to</strong> priority sites,<br />
including rare ecosystems 4<br />
• Conservation <strong>of</strong> large natural habitats<br />
indirectly conserves genetic diversity<br />
• Both terrestrial and aquatic<br />
ecosystems have been assessd 3<br />
• Workbook for terrestrial ecosystems<br />
exists 4<br />
• Workbook for freshwater ecosystems<br />
exists 5<br />
• Was designed for global application 3,6<br />
• Implemented on a regional level <strong>with</strong><br />
different case studies applied at<br />
various geographical scales, ranging<br />
from single watersheds <strong>to</strong> entire<br />
continents 6<br />
• Implementation at the local level is<br />
represented through analytical work<br />
conducted <strong>with</strong>in an ecoregion 4<br />
• In theory can be implemented at the<br />
private sec<strong>to</strong>r level - eg. in large-scale<br />
logging concessions, such as in<br />
Central Africa, only one tree per<br />
hectare, per 25 years is cut 7<br />
• Designed for implementation at an<br />
ecoregional scale: probably has both<br />
the private and public sec<strong>to</strong>r levels<br />
incorporated in<strong>to</strong> the conservation<br />
strategy outcome, resulting in a mosaic<br />
<strong>of</strong> conservation priority sites and sites<br />
where land-use may take place 8<br />
• Designed for implementation at the<br />
public sec<strong>to</strong>r level 9<br />
193<br />
• Assume that other species’<br />
genetic diversity is also<br />
captured 1<br />
• No information found in literature<br />
or from interviews<br />
• Entire assessment is always<br />
carried out at a greater level<br />
than local, thus local can only be<br />
addressed partially 4<br />
• Implementation by the private<br />
sec<strong>to</strong>r level may be difficult <strong>to</strong><br />
achieve, e<strong>special</strong>ly in highly<br />
fragmented <strong>areas</strong>, as one <strong>of</strong> the<br />
goals is <strong>to</strong> conserve blocks <strong>of</strong><br />
large natural habitat 10<br />
• Conservation <strong>with</strong>in these<br />
production sites (private sec<strong>to</strong>r)<br />
would have <strong>to</strong> be dealt <strong>with</strong> at a<br />
management level 11<br />
• May result in <strong>to</strong>o much<br />
additional pressure being placed<br />
on a country or region <strong>with</strong> an<br />
already large percentage <strong>of</strong><br />
protected <strong>areas</strong> 11
A5-3<br />
Criteria Strength Weakness<br />
E. Implementation<br />
style<br />
F. Suitability for<br />
different users<br />
J. Possibility <strong>of</strong><br />
scoping<br />
assessment<br />
K. Consideration<br />
<strong>of</strong> threats<br />
L. Moni<strong>to</strong>ring<br />
recommendations<br />
M. Management<br />
recommendations<br />
Source: Own design<br />
• Identification <strong>of</strong> ecoregions by a global<br />
biodiversity assessment is <strong>to</strong>p-down 3<br />
• Identifying priority sites <strong>with</strong><br />
ecoregions is bot<strong>to</strong>m-up as local<br />
experts and stakeholders are<br />
consulted 10<br />
• Requires an entire team <strong>of</strong> experts,<br />
ideally local, national and international<br />
experts 4<br />
• Indigenous people (i.e. local user<br />
groups) and other stakeholders should<br />
also always be part <strong>of</strong> the identification<br />
process 4<br />
• During preparation the assessment<br />
team should be formed, designing and<br />
preparing for expert workshops and<br />
gathering essential data 4<br />
• The time required <strong>to</strong> complete an<br />
ERBC assessment takes<br />
approximately 2 years 1,11<br />
• Financial cost is considered when<br />
choosing an assessment team and<br />
whilst obtaining available data 4<br />
• Makes use <strong>of</strong> the 5-S Framework <strong>to</strong>ol<br />
for threat assessment 4<br />
• Levels <strong>of</strong> threat are ranked<br />
qualitatively: low, medium, high, from<br />
the source 1<br />
• Zones <strong>of</strong> threat degree, both internal<br />
and external, are established 1<br />
• Identifies highly threatened priority<br />
<strong>areas</strong> but where threats can be<br />
abated 1<br />
• Major future threat under consideration<br />
• No information found in literature<br />
or from interviews<br />
• No information found in literature<br />
or from interviews<br />
• No information found in literature<br />
or from interviews<br />
• No information found in<br />
literature or from interviews<br />
is climate change 1<br />
• Moni<strong>to</strong>ring is an important component • No information found in literature<br />
<strong>of</strong> the long term biodiversity vision or from interviews<br />
plan 4<br />
• Includes recommendations: moni<strong>to</strong>ring<br />
<strong>of</strong> keys<strong>to</strong>ne species and the species<br />
dependent on them, moni<strong>to</strong>ring <strong>of</strong><br />
migra<strong>to</strong>ry species, etc 4<br />
• May also be involved in the<br />
implementation <strong>of</strong> additional<br />
conservation strategies 8,12<br />
• Part <strong>of</strong> the biodiversity vision plan is<br />
the development <strong>of</strong> management<br />
practices 4<br />
• No information found in literature<br />
or from interviews<br />
1 Interview Partner J<br />
2 Marshall R. M., Turner D., Gondor A., Gori D., Enquist C., Luna G., Paredes Aguilar R., Anderson<br />
S., Schwartz S., Watts C., Lopez E., Comer P. (2004): An ecological analysis <strong>of</strong> conservation<br />
194
APPENDIX<br />
priorities in the Apache Highlands; prepared by The Nature Conservancy <strong>of</strong> Arizona, Institu<strong>to</strong> del<br />
Medio Ambiente y el Desarrollo Sustentable del Estado de Sonora; agency and institutional partners<br />
3 Olson D. M., Dinerstein E. (1998): The Global 200: a representation approach <strong>to</strong> conserving the<br />
Earth’s most biologically valuable ecoregions. Conservation Biology; Vol. 12(3):502-515<br />
4 Dinerstein E., Powell G., Olson D., Wikramanayake E. D., Abell R., Loucks C., Underwood E., Allnutt<br />
T., Wettengel W., Ricketts T., Strand H., O'Connor S., Burgess N. (2000): A workbook for<br />
conducting biological assessments and developing biodiversity visions for ecoregion-based<br />
conservation; World Wildlife Fund, Washing<strong>to</strong>n, D. C.<br />
5 Abell R. M., Thieme M., Dinerstein E., Olson D. (2002): A sourcebook for conducting biological<br />
assessments and developing biodiversity visions for ecoregion conservation; Volume II: Freshwater<br />
ecoregions; World Wildlife Fund; Washing<strong>to</strong>n D. C.<br />
6 Conservation Online (2009)a: Conservation by design Gateway: Links <strong>to</strong> completed Ecoregional<br />
<strong>Assessment</strong>s; (retrieved10.10.2009)<br />
http://conserveonline.org/workspaces/cbdgateway/era/reports/index_html<br />
7 Interview Partner F<br />
8 Moore J. E., Kitchener D. J., Salim A., Pollard E. H. B., Stanley S. A. (2004): Ecoregional<br />
assessment <strong>of</strong> biological diversity conservation in East Kalimantan, Indonesia; Volume I - Report;<br />
The Nature Conservancy Asia/Pacific Region: Indonesia Program East Kalimantan Portfolio Office<br />
9 Interview Partner A<br />
10 Dinerstein E., Olson D., Atchley J., Loucks C., Contreras-Balderas S., Abell R., Iñigo E., Enkerlin E.,<br />
Williams C., Castilleja G. (2002): Ecoregion-based conservation in the Chihuahuan Desert; a<br />
biological assessment; a collaborative effort by World Wildlife Fund, Comisíon National para el<br />
Conocimien<strong>to</strong> y Uso de la Biodiversidad (CONABIO), The Nature Conservancy, PRONATURA<br />
Noreste, and the Institu<strong>to</strong> Tecnologico y de Estudios Superiores de Monterrey (ITESM)<br />
11 Interview Partner I<br />
12 Marshall R. M., Anderson S., Batcher M., Comer P., Cornelius S., Cox R., Gondor A., Gori D.,<br />
Humke J., Paredes Aguilar R., Parra I. E., Schwartz S. (2000): An Ecological Analysis <strong>of</strong><br />
Conservation Priorities in the Sonoran Desert Ecoregion; Prepared by The Nature Conservancy<br />
Arizona Chapter, Sonoran Institute, and Institu<strong>to</strong> del Medio Ambiente y el Desarrollo Sustentable del<br />
Estado de Sonora <strong>with</strong> support from Department <strong>of</strong> Defence Legacy Program, Agency and<br />
Institutional partners<br />
195
A5-4 Strength-Weakness Pr<strong>of</strong>ile: Focal Species Approach (FSA)<br />
Table 20: Overview <strong>of</strong> data obtained for the FSA strength-weakness pr<strong>of</strong>ile<br />
Criteria Strength Weakness<br />
A. Addressed<br />
biodiversity<br />
levels<br />
B. Addressed<br />
ecosystem<br />
types<br />
C. Geographical<br />
scale <strong>of</strong><br />
applicability<br />
D. Level <strong>of</strong><br />
approach<br />
E. Implementation<br />
style<br />
F. Suitability for<br />
different users<br />
J. Possibility <strong>of</strong><br />
scoping<br />
assessment<br />
K. Consideration<br />
<strong>of</strong> threats<br />
• Designed for implementation in<br />
heavily developed landscapes,<br />
primarily agriculture 1,2<br />
• Relies solely on locally<br />
threatened or endangered<br />
species<br />
• Designed for implementation in<br />
any terrestrial ecosystem –<br />
heavily developed<br />
• Has been implemented at a<br />
2,4 ,5<br />
global scale<br />
• Has been implemented at a local<br />
A5-5<br />
• Criteria used by this approach do<br />
not rely on globally or regionally<br />
rare, threatened, endangered and/<br />
or endemic species nor<br />
ecosystems<br />
• Focuses on a specific set <strong>of</strong><br />
species and assumes that by<br />
covering the needs <strong>of</strong> these 'focal<br />
species', the needs <strong>of</strong> all other<br />
species are covered 1,3<br />
• Genetic diversity has not been<br />
addressed<br />
• Has not been designed for<br />
implementation in aquatic<br />
ecosystems<br />
• No information found in literature<br />
or from interviews on a regional<br />
assessment<br />
• Provides a workable, useful and<br />
owned land 4<br />
scientifically sound method <strong>of</strong> or from interviews<br />
addressing conservation in<br />
agricultural lands, privately<br />
owned 7,8<br />
• Implementation <strong>with</strong>in regions <strong>of</strong><br />
both privately and publicly<br />
• No information on the use <strong>of</strong><br />
• Implementation typically through<br />
data is taken in<strong>to</strong> consideration 1<br />
partnerships between<br />
government, community-based<br />
organisations 2 and industry, land<br />
owners and the general public 5<br />
global and/ or national species<br />
status databases was found<br />
• To determine the focal<br />
community, only local or regional<br />
• Designed for use by experts • International experts not included<br />
experts 2,5<br />
• The identification <strong>of</strong> focal species in the identification process<br />
and their key threats requires • Local user groups not included in<br />
input from local or national<br />
the identification process<br />
• No information found in literature • No information found in literature<br />
or from interviews<br />
or from interviews<br />
• First step in <strong>identify</strong>ing the focal<br />
community is the identification <strong>of</strong><br />
threats, both external and<br />
internal 1<br />
• Threats divided in<strong>to</strong> four<br />
categories: areal-limited,<br />
dispersal-limited, resourcelimited,<br />
and ecological processlimited<br />
• Interaction <strong>of</strong> threatening<br />
processes not considered 10<br />
196
APPENDIX<br />
Criteria Strength Weakness<br />
K. Continued -<br />
Consideration<br />
<strong>of</strong> threats<br />
L. Moni<strong>to</strong>ring<br />
recommenddations<br />
M. Management<br />
recommenddations<br />
Source: Own design<br />
• No information found in literature<br />
• No information found in literature<br />
• Threatened species assigned <strong>to</strong><br />
threat categories and the most<br />
vulnerable species will be termed<br />
the focal species 1<br />
• All focal species are the focal<br />
community which is used <strong>to</strong><br />
determine the characteristics <strong>of</strong> a<br />
landscape that must exist if the<br />
needs <strong>of</strong> all other biota are <strong>to</strong> be<br />
met 2<br />
• These threats include habitat<br />
fragmentation, agriculture, forest<br />
fires, degradation <strong>of</strong> habitat<br />
structure and complexity, patch<br />
size, erosion, declining water<br />
quality, tree dieback, dry land<br />
salinity 9<br />
• Moni<strong>to</strong>ring recommendations are<br />
process is critically mportant 1<br />
made and include the extent <strong>of</strong> or from interviews<br />
and barriers <strong>to</strong> on-ground<br />
implementation <strong>of</strong> the FSA, costs<br />
and benefits <strong>of</strong> implementation,<br />
<strong>areas</strong> for improvement, and<br />
whether the designs achieved<br />
their stated objectives 2<br />
• Moni<strong>to</strong>ring is required for the<br />
approach <strong>to</strong> be <strong>of</strong> value for long<br />
term landscape res<strong>to</strong>ration 2<br />
• Establishment <strong>of</strong> a moni<strong>to</strong>ring<br />
• Aims <strong>to</strong> <strong>identify</strong> management<br />
strategies 2<br />
interventions needed for the<br />
or from interviews 10<br />
maintenance <strong>of</strong> species and<br />
habitats <strong>with</strong>in a degraded<br />
landscape 2<br />
• Guide the design and<br />
implementation <strong>of</strong> revegetation<br />
and vegetation management<br />
1 Lambeck R. J. (1997): Focal Species: A Multi-Species Umbrella for Nature Conservation;<br />
Conservation Biology;11(4): 849-856<br />
2 Huggett A. (2007): A review <strong>of</strong> the focal species approach in Australia; Land & Water Australia,<br />
Canberra<br />
3 Lindenmayer D. B., Manning A. D., Smith P. L., Possingham H. P., Fischer J., Oliver I., McCarthy M.<br />
A. (2002):The Focal Species approach and landscape res<strong>to</strong>ration: a critique; Conservation Biology;<br />
16(2):338-345<br />
4 Bani L., Baiet<strong>to</strong> M., Bot<strong>to</strong>ni L., Masse R. (2002): The use <strong>of</strong> focal species in designing a habitat<br />
network for a lowland area <strong>of</strong> Lombardy, Italy; Conservation Biology; 16(3):826-831<br />
197
A5-5<br />
5 Hess G. R., King T. J. (2002): Planning open spaces for wildlife; I. selecting focal species using a<br />
Delphi survey approach; Landscape and Urban Planning; 58(1):25-40<br />
6 Freudenberger D. (2001): Bush for the birds: Biodiversity enhancement guidelines for the Saltshaker<br />
Project, Boorowa, NSW; Consultancy report <strong>to</strong> Greening Australia ACT & SE NSW, Inc.; CSIRO<br />
Sustainable Ecosystems, Canberra<br />
7 Brooker L. (2002): The application <strong>of</strong> focal species knowledge <strong>to</strong> landscape design in agricultural<br />
lands using the ecological neighbourhood as a template; Landscape and Urban Planning; 60(4):185-<br />
210<br />
8 Freudenberger D. (1999): Guidelines for Enhancing Grassy Woodlands for the Vegetation<br />
Investment Project; CSIRO Wildlife & Ecology; Canberra<br />
9 Roberge J. M., Angelstam P. (2004): Usefulness <strong>of</strong> the umbrella species concept as a conservation<br />
<strong>to</strong>ol; Conservation Biology; 18(1):76-85<br />
198
APPENDIX<br />
A5-5 Strength-Weakness Pr<strong>of</strong>ile: Rapid Ecological <strong>Assessment</strong> (REA)<br />
Table 21: Overview <strong>of</strong> data obtained for REA strength-weakness pr<strong>of</strong>ile<br />
Criteria Strength Weakness<br />
A. Addressed<br />
biodiversity<br />
levels<br />
B. Addressed<br />
ecosystem<br />
types<br />
C. Geographical<br />
scale <strong>of</strong><br />
applicability<br />
D. Level <strong>of</strong><br />
approach<br />
E. Implementation<br />
style<br />
F. Suitability for<br />
different users<br />
J. Possibility <strong>of</strong><br />
scoping<br />
assessment<br />
• Performed at the species level and<br />
is extremely relevant <strong>to</strong> this level <strong>of</strong><br />
biodiversity 1<br />
• Has been implemented in a wide<br />
range <strong>of</strong> ecosystems, from<br />
grasslands, forests <strong>to</strong> various<br />
aquatic systems 2<br />
• Can be adapted <strong>to</strong> any ecosystem •<br />
type 1,2<br />
• Both terrestrial and aquatic REA<br />
3,4 ,5<br />
case studies exist<br />
• Implementation at both regional 4<br />
and local scale 7,8 throughout the<br />
world 2<br />
• Resulted in the establishment <strong>of</strong><br />
protected <strong>areas</strong>, development <strong>of</strong><br />
management plans and zonation,<br />
design <strong>of</strong> biological corridors and<br />
development <strong>of</strong> threat abatement<br />
programmes 2<br />
• Has been implemented at private<br />
and public sec<strong>to</strong>r level 3,4<br />
• An excellent approach for obtaining<br />
data on large <strong>areas</strong> <strong>with</strong> very little<br />
available data, benefitting research<br />
programmes, enabling planning and<br />
aiding in the identification <strong>of</strong><br />
stakeholders and constituencies 2, 6<br />
• Determines ecological information<br />
actually present in the area <strong>of</strong><br />
interest and identifies conservation<br />
targets 2<br />
• Implemented by national authorities<br />
and local user groups 2<br />
• Designed for use by preferably,<br />
local or national experts 2<br />
• Local users groups are able <strong>to</strong><br />
contribute <strong>to</strong> the identification<br />
stage 7,8<br />
• International experts have also<br />
taken part in REAs 7,8<br />
• Scoping assessment is performed<br />
during the initial planning stages 2<br />
• Cost, timing, team composition and<br />
objectives are identified 2<br />
• Objectives include the scale, and<br />
therefore, level <strong>of</strong> landscape<br />
classification and the number <strong>of</strong><br />
assessed taxonomic groups 2<br />
• Genetic diversity is not addressed<br />
• Further analysis <strong>of</strong> ecosystems<br />
requires guidance for<br />
understanding their functioning 1<br />
No information found in literature or<br />
from interviews<br />
• No information found in literature or<br />
from interviews<br />
• No information found in literature or<br />
from interviews<br />
• It does not rely on global and<br />
national species data<br />
• It does not rely on global<br />
ecosystem data<br />
• No information found in literature or<br />
from interviews<br />
• No information found in literature or<br />
from interviews<br />
199
A5-5<br />
Criteria Strength Weakness<br />
K. Consideration<br />
<strong>of</strong> threats<br />
L. Moni<strong>to</strong>ring<br />
recommenddations<br />
M. Management<br />
recommenddations<br />
Source: Own design<br />
• <strong>Assessment</strong> <strong>of</strong> existing and<br />
potential threats <strong>to</strong> species and<br />
vegetation types in and adjacent <strong>to</strong><br />
study area 2<br />
• Often divided in<strong>to</strong> low, medium or<br />
high risk 2<br />
• Moni<strong>to</strong>ring needs will be part <strong>of</strong> the<br />
management recommendations 2<br />
• Valuable data can be accumulated<br />
through moni<strong>to</strong>ring which may give<br />
an indication <strong>of</strong> the effectiveness <strong>of</strong><br />
conservation management 7<br />
• Management recommendations are<br />
formulated <strong>to</strong> promote long term<br />
viability <strong>of</strong> biodiversity 2<br />
• Include aspects such as how <strong>to</strong><br />
zone a site for mixed uses, active<br />
management actions, consideration<br />
<strong>of</strong> watershed issues and moni<strong>to</strong>ring<br />
needs 2<br />
• Exact recommendations are made<br />
case by case 7<br />
• No information found in literature or<br />
from interviews<br />
• No information found in literature or<br />
from interviews<br />
• No information found in literature or<br />
from interviews<br />
1 Convention on Biological Diversity (2005): Guidelines for the rapid ecological assessment <strong>of</strong><br />
biodiversity in inland water, coastal and marine <strong>areas</strong>. Secretariat <strong>of</strong> the Convention on Biological<br />
Diversity, Montreal, Canada, CBD Technical Series no. 22 and the Secretariat <strong>of</strong> the Ramsar<br />
Convention, Gland, Switzerland, Ramsar Technical Report no.1<br />
2 Sayre R., Rocca E., Sedaghatk G., Young B., Keel S., Rocca R. L., Shepard S. (1999): Nature in<br />
Focus: Rapid ecological assessment; The Nature Conservancy; Island Press; Washing<strong>to</strong>n D C<br />
3 Gillison A. N., Liswanti N., Arief Rachman I. (1996): Rapid ecological assessment; Kerinci Seblat<br />
National Park Buffer Zone; Preliminary report on plant ecology and overview <strong>of</strong> biodiversity<br />
assessment; Centre for International Forestry Research (CIFOR); Working Paper No. 14;<br />
4 Grabherr G. (2000): Rapid biodiversity assessment for the Alps ecoregion; WWF Alpine Programme<br />
5 Smith S. D. A. (2005): Rapid assessment <strong>of</strong> invertebrate biodiversity on rocky shores: where there’s<br />
a whelk there’s a way; Biodiversity and Conservation; 14:3565–3576<br />
6 Interview Partner I<br />
7 Meerman J. C., Holland B., Howe A., Jones H. L., Miller B. W. (2003): Rapid ecological assessment:<br />
Mayflower Bocawina National Park Volume I; prepared for: Friends <strong>of</strong> Mayflower under a grant<br />
provided by PACT & UNDP/GEF<br />
8 Meerman J. C. (2004): Rapid ecological assessment: Columbia River Forest Reserve: Past<br />
Hurricane Iris; commissioned by Ya`axché Conservation Trust and Toledo Institute for Development<br />
and Environment<br />
200
APPENDIX<br />
A6<br />
Methods for Site Choice: Detailed <strong>Assessment</strong> Results<br />
Criteria G: Which methods were employed for site choice? Site visits (C16), surveys (C17),<br />
additional methods (C18)<br />
A6-1 High Conservation Value (HCV) Concept<br />
Table 22: Overview <strong>of</strong> methods employed by the HCV concept for site choice<br />
General<br />
• Due <strong>to</strong> its flexibility HCV uses a wide range <strong>of</strong> different methods<br />
Remark<br />
Subcriteria<br />
methods<br />
Employed<br />
Inven<strong>to</strong>ries • No examples found in literature<br />
Site Visits<br />
(C16)<br />
Rapid<br />
assessment<br />
Indica<strong>to</strong>r<br />
species<br />
Ground<br />
truthing<br />
• Species recordings by the assessment team and/ or stakeholders 2<br />
• Use <strong>of</strong> bird indica<strong>to</strong>rs is useful <strong>to</strong> determine habitat quality 1<br />
• Used in high biodiversity <strong>areas</strong>, <strong>to</strong> indicate endemic, rare or<br />
threatened species 1<br />
• Ground truthing <strong>of</strong> maps 1<br />
Surveys<br />
(C17)<br />
Additional<br />
Methods<br />
(C18)<br />
Source: own design<br />
Stakeholder<br />
surveys<br />
Other<br />
methods<br />
• Important part <strong>of</strong> site identification 2<br />
• Used for gathering data on species sightings 3<br />
• Used <strong>to</strong> determine socio-economic situation, also in the wider<br />
landscape 4<br />
• Used <strong>to</strong> assess current management strategies or environmental<br />
considerations <strong>with</strong>in an operating area 3<br />
• Remote sensing 1<br />
• Literature reviews 1,3<br />
1 Rayden T., Kruglianskas I., Stewart C. (2009): An assessment <strong>of</strong> potential High Conservation Values<br />
<strong>with</strong>in Cabo Delgado Province, Mozambique; Testing the implementation <strong>of</strong> HCV criteria for bi<strong>of</strong>uels<br />
feeds<strong>to</strong>ck developments in Southern Africa; Pr<strong>of</strong>orest, Oxford; GTZ, Eschborn<br />
2 Stewart, C., George, P., Rayden, T., Nussbaum, R. (2008): Good Practice Guidelines for High<br />
Conservation Value <strong>Assessment</strong> - A practical Guide for Practioners and Audi<strong>to</strong>rs; Pr<strong>of</strong>orest; Oxford<br />
3<br />
Rainforest Alliance SmartWood Program (2005): High Conservation Value Forest (HCVF)<br />
<strong>Assessment</strong> Report for: Serapung Unit final report; Rainforest Alliance; New York<br />
4 Stewart C. (2009)b: An assessment <strong>of</strong> potential High Conservation Values in Northern Krabi<br />
Province, Thailand, final report; Pr<strong>of</strong>orest; Oxford<br />
201
A6<br />
A6-2 Key Biodiversity Areas (KBA) Approach<br />
Table 23: Overview <strong>of</strong> methods employed by the KBA approach for site choice<br />
Subcriteria<br />
methods<br />
Employed<br />
Inven<strong>to</strong>ries • Taxa for which inven<strong>to</strong>ries can be made include plants, birds,<br />
mammals, herpet<strong>of</strong>auna, freshwater fish, butterflies and<br />
dragonflies 1 , etc<br />
• Inven<strong>to</strong>ries should be made for as many species as possible from<br />
the entire taxonomic spectrum 2<br />
Site Visits<br />
(C16)<br />
Additional<br />
Methods<br />
(C18)<br />
Source: own design<br />
Stakeholder<br />
surveys<br />
Rapid<br />
assessment<br />
Indica<strong>to</strong>r<br />
species<br />
Other<br />
methods<br />
• Refinement <strong>of</strong> delineated KBA occurs by stakeholder involvement 3<br />
• Extensive field surveys prior <strong>to</strong> identification have been part <strong>of</strong> the<br />
most successful processes 2<br />
• Sites are identified using site-occurrence data for species <strong>of</strong><br />
conservation significance, following the aspects <strong>of</strong> vulnerability and<br />
irreplaceability 3<br />
• No examples found in literature<br />
• Identification has <strong>of</strong>ten solely been based on literature, museum<br />
specimens and remotely sensed data 2<br />
1 Eken G., Bozdoğan M., Karataş A., Lise Y. (2004): Key Biodiversity Areas: Identifying the world's<br />
priority sites for conservation – lessons learned from Turkey; Doğa Derneği, Ankara, Turkey<br />
2 Langhammer P. F., Bakarr M. I., Bennun L., Brooks T. M., Clay P. C., Darwall W., De Silva N., Edgar<br />
G. J., Eken G., Fishpool L. D. C., da Fonseca G. A. B., Foster M. N., Knox D. H., Matiku P., Radford<br />
E. A., Rodrigues A. S. L., Salaman P., Sechrest W., Tord<strong>of</strong>f A. W. (2007): Identification and analysis<br />
<strong>of</strong> Key Biodiversity Areas: Targets for comprehensive protected <strong>areas</strong> system; IUCN, Gland<br />
3 Eken G., Bennun L., Brooks T. M., Darwall W., Fishpool L. D. C., Foster M., Knox D., Langhammer<br />
P., Matiku P., Radford E., Salaman P., Sechrest W., Smith M. L., Spec<strong>to</strong>r S., Tord<strong>of</strong>f A. (2004): Key<br />
biodiversity <strong>areas</strong> as site conservation targets; Bioscience; 54(12):1110-1118<br />
202
APPENDIX<br />
A6-3 Ecoregion-Based Conservation (ERBC) Approach<br />
Table 24: Overview <strong>of</strong> methods employed by the ERBC approach for site choice<br />
• Global ecoregion map - ecoregions nested <strong>with</strong>in biogeographical<br />
biomes & realms 2<br />
• Delineation first at a coarse and then at a fine scale 1<br />
• Coarse scale is represented by ecological groups or assemblages <strong>of</strong><br />
General<br />
plant species in repeated patterns across the ecoregion 2<br />
Remark<br />
• Delineation resolution is then increased until sub-regions are drawn<br />
• Finer resolution: species for which distributional and population data<br />
are available through data and expert sources 3<br />
• Both rare & common species selected from representative taxa 3<br />
Subcriteria<br />
methods<br />
Employed<br />
Inven<strong>to</strong>ries • Used as part <strong>of</strong> an REA 3<br />
Site Visits<br />
(C16)<br />
Additional<br />
Methods<br />
(C18)<br />
Source: own design<br />
Stakeholder<br />
surveys<br />
Expert<br />
surveys<br />
Rapid<br />
assessment<br />
Indica<strong>to</strong>r<br />
species<br />
Other<br />
methods<br />
• Stakeholder surveys <strong>with</strong>in a workshop setting 4<br />
• Expert surveys <strong>with</strong>in a workshop setting 4<br />
• Used <strong>to</strong> aid delineation <strong>of</strong> sites 6 and as part <strong>of</strong> an REA 3<br />
• Used as part <strong>of</strong> an REA 3<br />
• Determine minimum habitat requirements <strong>of</strong> focal species, as proxies<br />
<strong>to</strong> cover requirements <strong>of</strong> all other species 4<br />
• Indica<strong>to</strong>rs, predictive models 4, 5<br />
• Threat assessments for <strong>identify</strong>ing priority sites 5<br />
• Remotely sensed data 6<br />
1 Olson D. M., Dinerstein E., Wikramanayake E. D., Burgess N. D., Powell G. V. N., Underwood E. C.,<br />
D’Amico J. A. J., I<strong>to</strong>ua I., Strand H. E., Morrison J. C., Loucks C. J., Allnutt T. F., Ricketts T. H.,<br />
Kura Y., Lamoreux J. F., Wettengel W. W., Hedao P., Kassem K. R. (2001): Terrestrial ecoregions<br />
<strong>of</strong> the world: A new map <strong>of</strong> life on earth; BioScience; 51(11):933-938<br />
2 Marshall R. M., Anderson S., Batcher M., Comer P., Cornelius S., Cox R., Gondor A., Gori D.,<br />
Humke J., Paredes Aguilar R., Parra I. E., Schwartz S. (2000): An ecological analysis <strong>of</strong><br />
conservation priorities in the Sonoran Desert ecoregion; prepared by TNC Arizona Chapter, Sonoran<br />
Institute, and Institu<strong>to</strong> del Medio Ambiente y el Desarrollo Sustentable del Estado de Sonora <strong>with</strong><br />
support from Department <strong>of</strong> Defense Legacy Program, Agency and Institutional partners<br />
3 Interview Partner I<br />
4 Dinerstein E., Powell G., Olson D., Wikramanayake E. D., Abell R., Loucks C., Underwood E., Allnutt<br />
T., Wettengel W., Ricketts T., Strand H., O'Connor S., Burgess N. (2000): A workbook for<br />
conducting biological assessments and developing biodiversity visions for ecoregion-based<br />
conservation; Conservation Science Program, World Wildlife Fund; Washing<strong>to</strong>n, D.C.<br />
5 Interview Partner J<br />
6 Dinerstein E., Olson D., Atchley J., Loucks C., Contreras-Balderas S., Abell R., Iñigo E., Enkerlin E.,<br />
Williams C., Castilleja G. (2001): Ecoregion-based conservation in the Chihuahuan Desert: A<br />
biological assessment; TNC, PRONATURA Noreste, and the Institu<strong>to</strong> Tecnologico y de Estudios<br />
Superiores de Monterrey (ITESM)<br />
203
A6<br />
A6-4 Focal Species Approach (FSA)<br />
Table 25: Overview <strong>of</strong> methods employed by the FSA for site choice<br />
• First, the focal community must be identified based on the threats<br />
present <strong>to</strong> the area <strong>of</strong> interest 4<br />
General<br />
• Statistical models have been used <strong>to</strong> <strong>identify</strong> focal species<br />
Remark<br />
following inven<strong>to</strong>ries 2,5<br />
• Mostly birds have been used as focal species 3<br />
Subcriteria<br />
methods<br />
Employed<br />
Inven<strong>to</strong>ries • Inven<strong>to</strong>ries <strong>of</strong> mammals and bird species 3<br />
Site Visits<br />
(C16)<br />
Surveys<br />
(C17)<br />
Additional<br />
Methods<br />
(C18)<br />
Source: own design<br />
Rapid<br />
assessment<br />
Indica<strong>to</strong>r<br />
species<br />
Expert<br />
surveys<br />
Other<br />
methods<br />
• To validate existing data sets through visual and audio sightings<br />
and thus, determine focal species 1<br />
• Vegetation surveys <strong>of</strong> remnant patches <strong>to</strong> validate delineation 4<br />
• Determining <strong>of</strong> habitat quality in remnant patches 2,4<br />
• Focal species 2,4,5<br />
• Focal species identified by expert surveys 3<br />
• Ranking <strong>of</strong> threats by expert survey 1<br />
• Expert surveys used <strong>to</strong> determine habitat requirements <strong>of</strong> focal<br />
species <strong>to</strong> estimate viable population sizes 1<br />
• Satellite imagery <strong>to</strong> map patches and assess patch connectivity 4,5<br />
1 Brooker L. (2002): The application <strong>of</strong> focal species knowledge <strong>to</strong> landscape design in agricultural<br />
lands using the ecological neighbourhood as a template; Urban and Landscape Planning; 60(4):185-<br />
210<br />
2 Bani L., Baiet<strong>to</strong> M., Bot<strong>to</strong>ni L., Masse R. (2002): The use <strong>of</strong> focal species in designing a habitat<br />
network for a lowland area <strong>of</strong> Lombardy, Italy; Conservation Biology; 16(3):826-831<br />
3 Hess G. R., King T. J. (2002): Planning open spaces for wildlife; I. selecting focal species using a<br />
Delphi survey approach; Landscape and Urban Planning; 58(1):25-40<br />
4<br />
Lambeck R. J. (1997): Focal species: A multi-species umbrella for nature conservation;<br />
Conservation Biology; 11(4):849-856<br />
5 Huggett, A. (2007): A review <strong>of</strong> the focal species approach in Australia; Land & Water Australia,<br />
Canberra<br />
204
APPENDIX<br />
A6-5 Rapid Ecological <strong>Assessment</strong> (REA)<br />
Table 26: Overview <strong>of</strong> methods employed by the REA for site choice<br />
General<br />
• Initially delineate vegetation or land use-land cover classes through<br />
Remark<br />
remote sensing 2<br />
• Overflight <strong>of</strong> study area <strong>to</strong> provide a general familiarity and <strong>to</strong><br />
collect valuable data on vegetation types 2<br />
Subcriteria<br />
methods<br />
Employed<br />
Inven<strong>to</strong>ries • Inven<strong>to</strong>ries <strong>of</strong> flora and fauna specimens 2<br />
Site Visits<br />
(C16)<br />
Surveys<br />
(C17)<br />
Additional<br />
Methods<br />
(C18)<br />
Source: own design<br />
Rapid<br />
assessment<br />
Indica<strong>to</strong>r<br />
species<br />
Stakeholder<br />
surveys<br />
Other<br />
methods<br />
• Vegetation surveys and fauna sampling <strong>of</strong> the most visible, easily<br />
surveyed and well known taxa 2<br />
• Use <strong>of</strong> indica<strong>to</strong>r taxa <strong>to</strong> <strong>identify</strong> species richness 2<br />
• Stakeholder surveys for gaining information on traditional<br />
knowledge 1<br />
• Used <strong>to</strong> conduct socio-economic assessment around and <strong>with</strong>in<br />
the study area 2<br />
• Aerial pho<strong>to</strong>graphy, satellite imagery 2,3<br />
1 Convention on Biological Diversity (2005): Guidelines for the rapid ecological assessment <strong>of</strong><br />
biodiversity in inland water, coastal and marine <strong>areas</strong>. Secretariat <strong>of</strong> the Convention on Biological<br />
Diversity, Montreal, Canada, CBD Technical Series no. 22 and the Secretariat <strong>of</strong> the Ramsar<br />
Convention, Gland, Switzerland, Ramsar Technical Report no.1<br />
2 Sayre R., Rocca E., Sedaghatk Young B., Keel S., Rocca R. L., Shepard S. (2000): Nature in Focus:<br />
Rapid ecological assessment; The Nature Conservancy; Island Press; Washing<strong>to</strong>n D. C.<br />
3 Gillison A. N., Liswanti N., Arief Rachman I. (1996): Rapid ecological assessment; Kerinci Seblat<br />
National Park Buffer Zone; Preliminary report on plant ecology and overview <strong>of</strong> biodiversity<br />
assessment; Centre for International Forestry Research (CIFOR); Working Paper No. 14<br />
205
A7<br />
A7<br />
Required Resources: Detailed <strong>Assessment</strong> Results<br />
Criterion H: Which resources are required for identification? Financial resources (C19), human<br />
resources (C220), required time (C21)<br />
A7-1 High Conservation Value (HCV) Concept<br />
Table 27: Overview <strong>of</strong> resources required for the HCV concept 107<br />
HCV<br />
Financial<br />
Resources (€) 108 Human Resources Time Required Site size<br />
(C20)<br />
(C21)<br />
(ha)<br />
(C19)<br />
Interview • 100,000 • n.d. • 3 months • 10 million<br />
Partner C<br />
Interview<br />
Partner D<br />
Interview<br />
Partner E<br />
Interview<br />
Partner F<br />
Interview<br />
Partner G<br />
• 7,500-11,000<br />
(medium - large<br />
sized operations)<br />
• Minimum cost:<br />
5,600<br />
• 20,000-25,000<br />
(extensive field<br />
work)<br />
• 6,500-10,000<br />
(valid data<br />
available)<br />
• n.d.<br />
• n.d.<br />
• High impact<br />
operations:<br />
combination <strong>of</strong><br />
international and<br />
national experts;<br />
• Low impact<br />
operations: nonexpert<br />
users,<br />
experts required<br />
for validation<br />
• Experts always<br />
required<br />
• Combination <strong>of</strong><br />
international and<br />
national experts<br />
• Combination <strong>of</strong><br />
international and<br />
national experts<br />
• 2 teams: 1 socioeconomic<br />
and 1<br />
inven<strong>to</strong>ry team<br />
• Combination <strong>of</strong><br />
international and<br />
national experts<br />
• If possible use<br />
national experts<br />
• Minimum team:<br />
3-4<br />
• Few days<br />
• 6-12 months<br />
(including<br />
seasonally based<br />
visits)<br />
• Within<br />
management<br />
plan: 2-3 years<br />
• Individual<br />
assessment: 3<br />
months<br />
• Within<br />
management<br />
plan: 2-3 years<br />
• Field work: 2<br />
weeks<br />
• n.d.<br />
• Small scale, low<br />
impact operations<br />
• 100-10,000<br />
(average FMU)<br />
• n.d.<br />
• > 200,000<br />
(Central Africa)<br />
• n.d.<br />
107 All information was obtained through expert interviews.<br />
108 Converted currency: XE (1995-2009): The Universal Currency Converter; (retrieved 18.10.2009)<br />
http://www.xe.com/<br />
1 US$ = 0.67 €; 1 € = 1.49 US$<br />
1 GB£ = 1.13 €; 1 € = 0.89 GB£<br />
206
APPENDIX<br />
HCV<br />
(continued)<br />
Interview<br />
Partner K<br />
Minimum<br />
and<br />
maximum<br />
values<br />
Financial<br />
Resources (€) 109<br />
(C19)<br />
• 35,000-65,000<br />
• 5,600 - 65,000<br />
Human Resources<br />
(C20)<br />
• 1 senior<br />
consultant<br />
• (20-30years<br />
international<br />
experience)<br />
• several<br />
consultants <strong>with</strong><br />
national expertise<br />
• Combination <strong>of</strong><br />
international and<br />
national experts<br />
• Minimum team:<br />
Time Required<br />
(C21)<br />
• Field work: 7-14<br />
days;<br />
• Individual<br />
assessment: 1-2<br />
months<br />
• Field work: 7-13<br />
days;<br />
• 1-6 months<br />
Site size<br />
(ha)<br />
• Large scale area:<br />
20,000-100,000<br />
~ 100-200,000<br />
3-4<br />
Key: n.d. = not determined; ha = hectares; FMU = forest management unit<br />
Source: Own design<br />
109 Converted currency: XE (1995-2009): The Universal Currency Converter; (retrieved 18.10.2009)<br />
http://www.xe.com/<br />
1 US$ = 0.67 €; 1 € = 1.49 US$<br />
1 GB£ = 1.13 €; 1 € = 0.89 GB£<br />
207
A7<br />
A7-2 Key Biodiversity Areas (KBA) Approach and<br />
A7-3 Ecoregion-Based Conservation (ERBC) Approach<br />
Table 28: Overview <strong>of</strong> resources required for the KBA and ERBC approach 110<br />
KBA<br />
Interview<br />
Partner M<br />
ERBC<br />
Interview<br />
Partner I<br />
Interview<br />
Partner J<br />
Interview<br />
Partner G<br />
Minimum<br />
and<br />
maximum<br />
values<br />
Financial<br />
Resources 111<br />
(€) (C19)<br />
• Average <strong>of</strong> 650/<br />
KBA<br />
• Country/ regions<br />
<strong>with</strong> 50 KBA =<br />
~ 32,500<br />
Financial<br />
Resources 76<br />
(€ ) (C19)<br />
• 170,000-200,000<br />
(USA)<br />
• ~ 135,000 (USA)<br />
• ~ 100,000-<br />
235,000<br />
(internationally)<br />
• Eg. 1,300,000<br />
(China)<br />
• n.d.<br />
• 100,000-235,000<br />
(excluding<br />
example from<br />
China)<br />
Human Resources<br />
(C20)<br />
In general:<br />
• For data collection<br />
and compilations:<br />
teams <strong>of</strong> 3-6<br />
experts<br />
• Data validation<br />
through expert<br />
review (normally<br />
workshop form)<br />
Human Resources<br />
(C20)<br />
• Very expert<br />
intensive<br />
• International and<br />
national experts<br />
• n.d.<br />
• Few international<br />
and/ national<br />
experts<br />
• Few <strong>to</strong> many<br />
international and<br />
national experts<br />
Key: n.d. = not determined; ha = hectares<br />
Source: Own design<br />
Time required<br />
(C21)<br />
• National<br />
identification:<br />
~ 3 years<br />
Time required<br />
(C21)<br />
Site size (ha)<br />
• n.d.<br />
Site size (ha)<br />
• 1,5-2 years (USA) • 400,000-<br />
3,600,000<br />
• ~ 2 years (USA)<br />
• Eg. Almost 3<br />
years (China)*<br />
• ~ 2 years<br />
• 1,5-2 years<br />
(excluding<br />
example from<br />
China)<br />
• n.d.<br />
• n.d.<br />
• 400,000-<br />
3,600,000<br />
110 All information was obtained through expert interviews.<br />
111 Converted currency: XE (1995-2009): The Universal Currency Converter; (retrieved 18.10.2009)<br />
http://www.xe.com/<br />
1 US$ = 0.67 €; 1 € = 1.49 US$<br />
1 GB£ = 1.13 €; 1 € = 0.89 GB£<br />
208
APPENDIX<br />
A7-4 Focal Species Approach (FSA) and<br />
A7-5 Rapid Ecological <strong>Assessment</strong> (REA)<br />
Table 29: Overview <strong>of</strong> resources required for the FSA 112 and REA 113<br />
Financial<br />
FSA Resources 114 Human Resources<br />
(€)<br />
(C20)<br />
(C19)<br />
• ~ 6,500-60,000<br />
Interview<br />
Partner O<br />
• University<br />
students<br />
• National experts<br />
• Non-experts:<br />
decrease quality<br />
and credibility <strong>of</strong><br />
outcome<br />
Time required<br />
(C21)<br />
• Identification <strong>of</strong><br />
focal species: 3-4<br />
months<br />
• Focal species<br />
already available:<br />
1-2 months<br />
Site size (ha)<br />
• ~ 1,000s -<br />
100,000s<br />
REA<br />
Interview<br />
Partner I<br />
Interview<br />
Partner J<br />
Sayre et<br />
al. 2000<br />
Minimum<br />
and<br />
maximum<br />
values<br />
Financial<br />
Resources 79 (€)<br />
(C19)<br />
• n.d.<br />
• ~ 6,500 - 60,000<br />
• Maybe even<br />
670,000<br />
• Terrestrial REA:<br />
50,000 - 170,000<br />
• 50,000-170,000<br />
Human Resources<br />
(C20)<br />
• Very expert<br />
intensive<br />
Time required<br />
(C21)<br />
• ~ 14 months<br />
• n.d.<br />
• n.d. • n.d. • n.d.<br />
• Experts required<br />
• Numbers can vary<br />
greatly<br />
• Common <strong>to</strong> have<br />
multidisciplinary,<br />
multi-institutional<br />
teams<br />
• In general: very<br />
expert intensive<br />
• Very expert<br />
intensive<br />
• International and<br />
national experts<br />
Key: n.d. = not determined; ha = hectares<br />
Source: Own design<br />
• ~ 12 months<br />
• 12 months<br />
• n.d.<br />
• n.d.<br />
Site size (ha)<br />
112 All information was obtained through expert interviews.<br />
113 All information was obtained through expert interviews and literature research.<br />
114 Converted currency: XE (1995-2009): The Universal Currency Converter; (retrieved 18.10.2009)<br />
http://www.xe.com/<br />
1 US$ = 0.67 €; 1 € = 1.49 US$<br />
1 GB£ = 1.13 €; 1 € = 0.89 GB£<br />
209
A8<br />
A8<br />
Data Requirements: Detailed <strong>Assessment</strong> Results<br />
Criterion I: Which data is required for the identification <strong>of</strong> important <strong>areas</strong>? Use <strong>of</strong> existing<br />
data (C22), data acquisition (C23), data validation (C24), use <strong>of</strong> remote sensing (C25)<br />
A8-1 High Conservation Value (HCV) Concept<br />
Table 30: List <strong>of</strong> data required by the HCV concept<br />
Criterion I<br />
Data<br />
Requirements<br />
Source: Own design<br />
Use <strong>of</strong> existing<br />
data (C22)<br />
Data<br />
acquisition<br />
(C23)<br />
Data validation<br />
(C24)<br />
Use <strong>of</strong> remote<br />
sensing (C25)<br />
• Use as much existing data as possible from a wide range<br />
<strong>of</strong> different sources (macro- and micro scale maps and<br />
data sources) 1<br />
• Remote sensing for landscape level assessments 1<br />
• Expert surveys 1<br />
• Stakeholder surveys 1<br />
• Field surveys 1<br />
• Documentary evidence 1<br />
• Depends on availability, quality and amount <strong>of</strong> existing<br />
data<br />
• Expert surveys 1<br />
• Field surveys 1<br />
• Ground truthing 1<br />
• Used in data acquisition 1<br />
• Used for macro-scale mapping 2<br />
• Essential in establishing broad framework for site scale<br />
decisions 3<br />
• Aids in determining appropriate limits <strong>to</strong> landscape scale<br />
assessment 3<br />
• Both aerial pho<strong>to</strong>graphy and satellite imagery 3<br />
1 Stewart C., George P., Rayden T., Nussbaum R. (2008): Good practice guidelines for High<br />
Conservation Value assessment - a practical guide for practitioners and audi<strong>to</strong>rs; Pr<strong>of</strong>orest; Oxford<br />
2 Stewart C., Rayden T. (2009): Mapping High Conservation Values at large scales for effective sitelevel<br />
management; public consultation draft 1, HCV Resource Network<br />
3 Stewart C., Rayden T. (2009): Mapping High Conservation Values at large scales for effective sitelevel<br />
management; public consultation draft 1, HCV Resource Network<br />
210
APPENDIX<br />
A8-2 Key Biodiversity Areas (KBA) Approach<br />
Table 31: List <strong>of</strong> data required by the KBA approach<br />
• IUCN red list provides essential information on<br />
conservation status; critically endangered, endangered or<br />
vulnerable 1<br />
• Supplement IUCN lists <strong>with</strong> secondary databases, such<br />
Use <strong>of</strong> existing<br />
as IBA, IPA, AZE 1<br />
data (C22)<br />
• Consults primary literature and experts 1<br />
• Uses his<strong>to</strong>rical and contemporary survey data on<br />
distribution and population trends 1<br />
• Museum specimens 2<br />
• Remote sensing 2<br />
• Field surveys 1<br />
Criterion I Data<br />
• Inven<strong>to</strong>ries 1<br />
acquisition<br />
• Museum specimens 1,2<br />
(C23)<br />
• Refinement <strong>of</strong> delineated KBA through stakeholder<br />
surveys 3<br />
Data<br />
Requirements<br />
Source: Own design<br />
Data validation<br />
(C24)<br />
Use <strong>of</strong> remote<br />
sensing (C25)<br />
• Existing IBA, IPA and AZE sites must be confirmed<br />
through field surveys 1<br />
• Changes in global threat status and taxonomy must also<br />
be verified through field surveys 1<br />
• Species identification must be tracked back <strong>to</strong> sources in<br />
museum collections or herbariums 1<br />
• Peer reviewing by experts 2<br />
• Aids in the identification <strong>of</strong> KBA 2<br />
• Not ideal for capturing environmental viability <strong>of</strong> aquatic<br />
systems 1<br />
• Used for moni<strong>to</strong>ring activities, however must be validated<br />
by ground truthing 1<br />
• Both aerial pho<strong>to</strong>graphy and satellite imagery 1<br />
1 Langhammer P. F., Bakarr M. I., Bennun L., Brooks T. M., Clay P. C., Darwall W., De Silva N., Edgar<br />
G. J., Eken G., Fishpool L. D. C., da Fonseca G. A. B., Foster M. N., Knox D., Matiku P., Radford E.<br />
A., Rodrigues A. S. L., Salaman P., Sechrest W., Tord<strong>of</strong>f A. W. (2007): Identification and analysis <strong>of</strong><br />
Key Biodiversity Areas: Targets for comprehensive protected <strong>areas</strong> system; IUCN, Gland<br />
2 Interview Partner M<br />
3 Eken G., Bennun L., Brooks T. M., Darwall W., Fishpool L. D. C., Foster M., Knox D., Langhammer<br />
P., Matiku P., Radford E., Salaman P., Sechrest W., Smith M. L., Spec<strong>to</strong>r S., Tord<strong>of</strong>f A. (2004): Key<br />
Biodiversity Areas as site conservation targets; Bioscience 54(12):1110-1118<br />
211
A8<br />
A8-3 Ecoregion-Based Conservation (ERBC) Approach<br />
Table 32: List <strong>of</strong> data required by the ERBC approach<br />
Criterion I<br />
Data<br />
Requirements<br />
Source: Own design<br />
Use <strong>of</strong> existing<br />
data (C22)<br />
Data<br />
acquisition<br />
(C23)<br />
Data validation<br />
(C24)<br />
Use <strong>of</strong> remote<br />
sensing (C25)<br />
• Use as much existing data as possible 1<br />
• Employs information from Global 200 ecoregion assessment 2<br />
• Determine and validate existing data during planning phase 2<br />
• Review scientific data, previous biodiversity action plans,<br />
conservation strategies and priority planning exercises 2<br />
• Biological assessments <strong>to</strong> record the distribution <strong>of</strong> species,<br />
communities and habitats, ecological processes and current<br />
and future threats 1<br />
• Field surveys help delineation 3 and fill in information gaps 2<br />
• Remote sensing 3<br />
• Expert workshops made up <strong>of</strong> experts and stakeholders 2,4<br />
• All acquired data is digitised in<strong>to</strong> GIS 4<br />
• Determine biophysical data sets <strong>to</strong> determine how well the<br />
area networks identified for conservation represent the<br />
biophysical diversity <strong>of</strong> the ecoregion 4<br />
• Field surveys 3<br />
• Ground truthing 3<br />
• Used <strong>to</strong> assess current conditions 3<br />
• Used <strong>to</strong> moni<strong>to</strong>r habitat quality trends, e<strong>special</strong>ly in<br />
inaccessible <strong>areas</strong> 2<br />
• Satellite imagery used <strong>to</strong> assess the effects <strong>of</strong> threats 3,5<br />
• Both aerial pho<strong>to</strong>graphy and satellite imagery 3<br />
A8-4 Focal species Approach (FSA)<br />
1 Groves G., Valutis L., Vosick D., Neely B., Whea<strong>to</strong>n K., Touval J., Runnels B. (2000): Designing a<br />
Geography <strong>of</strong> Hope: A practitioner’s handbook for ecoregional conservation planning; TNC<br />
2 Dinerstein E., Powell G., Olson D., Wikramanayake E. D., Abell R., Loucks C., Underwood E., Allnutt<br />
T., Wettengel W., Ricketts T., Strand H., O'Connor S., Burgess N. (2000): A workbook for<br />
conducting biological assessments and developing biodiversity visions for ecoregion-based<br />
conservation; Conservation Science Program, World Wildlife for Fund; Washing<strong>to</strong>n, D.C.<br />
3 Dinerstein E., Olson D., Atchley J., Loucks C., Contreras-Balderas S., Abell R., Iñigo E., Enkerlin E.,<br />
Williams C., Castilleja G. (2001): Ecoregion-based conservation in the Chihuahuan Desert: A<br />
biological assessment; TNC, PRONATURA Noreste, and the Institu<strong>to</strong> Tecnologico y de Estudios<br />
Superiores de Monterrey (ITESM)<br />
4 Marshall R. M., Anderson S., Batcher M., Comer P., Cornelius S., Cox R., Gondor A., Gori D.,<br />
Humke J., Paredes Aguilar R., Parra I. E., Schwartz S. (2000): An Ecological Analysis <strong>of</strong><br />
Conservation Priorities in the Sonoran Desert Ecoregion; Prepared by TNC Arizona Chapter,<br />
Sonoran Institute, and Institu<strong>to</strong> del Medio Ambiente y el Desarrollo Sustentable del Estado de<br />
Sonora <strong>with</strong> support from Department <strong>of</strong> Defense Legacy Program, Agency and Institutional<br />
partners.<br />
5 Lassen B., Savoia S. (2005): European Alpine Programme: Ecoregion conservation plan for the<br />
Alps; World Wildlife Fund<br />
212
APPENDIX<br />
Table 33: List <strong>of</strong> data required by the FSA<br />
Criterion I<br />
Data<br />
Requirements<br />
Source: Own design<br />
Use <strong>of</strong> existing<br />
data (C22)<br />
Data<br />
acquisition<br />
(C23)<br />
Data validation<br />
(C24)<br />
Use <strong>of</strong> remote<br />
sensing (C25)<br />
• Use <strong>of</strong> existing data sets <strong>to</strong> determine focal species<br />
occurrence 2<br />
• Use <strong>of</strong> national, regional or local digital data sources 1,2<br />
• Literature reviews <strong>to</strong> determine focal species habitat<br />
requirements and estimated range <strong>of</strong> distribution 2<br />
• Literature reviews <strong>to</strong> estimate viable population sizes 2<br />
• Expert surveys <strong>to</strong> determine habitat requirements and range<br />
<strong>of</strong> distribution <strong>of</strong> focal species 2<br />
• Expert surveys <strong>to</strong> estimate viable population sizes 2<br />
• Field surveys 1,4<br />
• Remote sensing <strong>to</strong> <strong>identify</strong> remnant patches 1,3<br />
• Field surveys <strong>to</strong> validate species occurrences 1<br />
• Vegetation surveys <strong>to</strong> validate delineation <strong>of</strong> remnant<br />
patches 2<br />
• Ground truthing <strong>of</strong> mapping results<br />
• Used <strong>to</strong> delineate remnant patches, aerial pho<strong>to</strong>graphy or<br />
satellite imagery 1,4<br />
1 Brooker L. (2002): The application <strong>of</strong> focal species knowledge <strong>to</strong> landscape design in agricultural<br />
lands using the ecological neighbourhood as a template; Landscape and Urban Planning; 60(4):<br />
185-210<br />
2 Hess G. R., King T. J. (2002): Planning open spaces for wildlife; I. selecting focal species using a<br />
Delphi survey approach; Landscape and Urban Planning; 58(1):25-40<br />
3 Watson J., Freudenberger D., Paull D. (2001): An assessment <strong>of</strong> the Focal Species Approach for<br />
conserving birds in variegated landscapes in southeastern Australia; Conservation Biology; 15(5):<br />
1364-1373<br />
4<br />
Lambeck R. J. (1997): Focal species: A multi-species umbrella for nature conservation;<br />
Conservation Biology; 11(4):849-856<br />
213
A8<br />
A8-5 Rapid Ecological <strong>Assessment</strong> (REA)<br />
Table 34: List <strong>of</strong> data required by the REA<br />
Criterion I<br />
Data<br />
Requirements<br />
Source: Own design<br />
Use <strong>of</strong><br />
existing data<br />
(C22)<br />
Data<br />
acquisition<br />
(C23)<br />
Data<br />
validation<br />
(C24)<br />
Use <strong>of</strong> remote<br />
sensing (C25)<br />
• Collect and review as much available data as possible 2<br />
• Identify previous studies, management plans, global, national<br />
and regional data sets 2<br />
• Organise species information in<strong>to</strong> groups or units 2<br />
• Use existing GIS systems, remote sensing information<br />
system 1,2<br />
• Published and unpublished data 1,2<br />
• Traditional knowledge and information given by local or<br />
indigenous people 1,2<br />
• Remote sensing 2<br />
• Vegetation surveys 2<br />
• Fauna sampling 2<br />
• Inven<strong>to</strong>ries <strong>of</strong> flora and fauna specimens 2<br />
• Vegetation surveys <strong>to</strong> validate delineation <strong>of</strong> vegetation<br />
classes 2<br />
• Sampling and inven<strong>to</strong>ries <strong>to</strong> validate existing data 2<br />
• Ground truthing 2<br />
• All results should contain an overall estimate <strong>of</strong> confidence 1<br />
• Both aerial pho<strong>to</strong>graphy and satellite imagery for the initial<br />
landscape characterisation 2<br />
1 Convention Biological Diversity (2006): Guidelines for the rapid ecological assessment <strong>of</strong> biodiversity<br />
in inland water, coastal and marine <strong>areas</strong>. Secretariat <strong>of</strong> the Convention on Biological Diversity,<br />
Montreal, Canada, CBD Technical Series no. 22 and the Secretariat <strong>of</strong> the Ramsar Convention,<br />
Gland, Switzerland, Ramsar Technical Report no.1<br />
2 Sayre R., Rocca E., Sedaghatk Young B., Keel S., Rocca R. L., Shepard S. (2000): Nature in Focus:<br />
Rapid ecological assessment; The Nature Conservancy; Island Press; Washing<strong>to</strong>n D. C.<br />
214
APPENDIX