Market Timing: Big Wins or Big Trouble? - Halliburton
Market Timing: Big Wins or Big Trouble? - Halliburton
Market Timing: Big Wins or Big Trouble? - Halliburton

Create successful ePaper yourself
Turn your PDF publications into a flip-book with our unique Google optimized e-Paper software.
Fund Perf<strong>or</strong>mance Update<br />
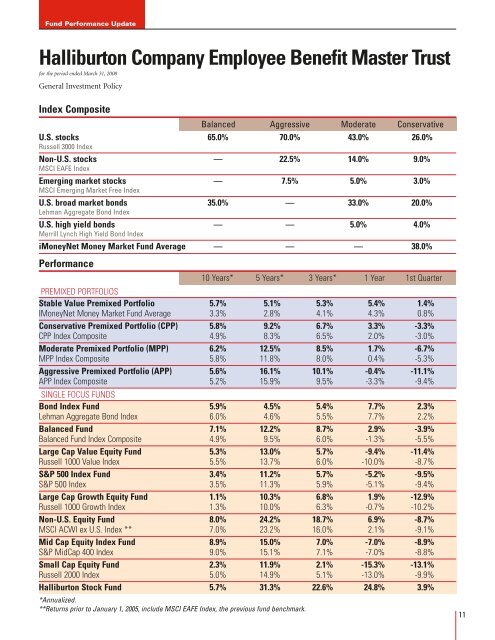
<strong>Halliburton</strong> Company Employee Benefit Master Trust<br />
f<strong>or</strong> the period ended March 31, 2008<br />
General Investment Policy<br />
Index Composite<br />
Balanced Aggressive Moderate Conservative<br />
U.S. stocks 65.0% 70.0% 43.0% 26.0%<br />
Russell 3000 Index<br />
Non-U.S. stocks — 22.5% 14.0% 9.0%<br />
MSCI EAFE Index<br />
Emerging market stocks — 7.5% 5.0% 3.0%<br />
MSCI Emerging <strong>Market</strong> Free Index<br />
U.S. broad market bonds 35.0% — 33.0% 20.0%<br />
Lehman Aggregate Bond Index<br />
U.S. high yield bonds — — 5.0% 4.0%<br />
Merrill Lynch High Yield Bond Index<br />
iMoneyNet Money <strong>Market</strong> Fund Average — — — 38.0%<br />
Perf<strong>or</strong>mance<br />
10 Years* 5 Years* 3 Years* 1 Year 1st Quarter<br />
Premixed P<strong>or</strong>tfolios<br />
Stable Value Premixed P<strong>or</strong>tfolio 5.7% 5.1% 5.3% 5.4% 1.4%<br />
IMoneyNet Money <strong>Market</strong> Fund Average 3.3% 2.8% 4.1% 4.3% 0.8%<br />
Conservative Premixed P<strong>or</strong>tfolio (CPP) 5.8% 9.2% 6.7% 3.3% -3.3%<br />
CPP Index Composite 4.9% 8.3% 6.5% 2.0% -3.0%<br />
Moderate Premixed P<strong>or</strong>tfolio (MPP) 6.2% 12.5% 8.5% 1.7% -6.7%<br />
MPP Index Composite 5.8% 11.8% 8.0% 0.4% -5.3%<br />
Aggressive Premixed P<strong>or</strong>tfolio (APP) 5.6% 16.1% 10.1% -0.4% -11.1%<br />
APP Index Composite 5.2% 15.9% 9.5% -3.3% -9.4%<br />
Single Focus Funds<br />
Bond Index Fund 5.9% 4.5% 5.4% 7.7% 2.3%<br />
Lehman Aggregate Bond Index 6.0% 4.6% 5.5% 7.7% 2.2%<br />
Balanced Fund 7.1% 12.2% 8.7% 2.9% -3.9%<br />
Balanced Fund Index Composite 4.9% 9.5% 6.0% -1.3% -5.5%<br />
Large Cap Value Equity Fund 5.3% 13.0% 5.7% -9.4% -11.4%<br />
Russell 1000 Value Index 5.5% 13.7% 6.0% -10.0% -8.7%<br />
S&P 500 Index Fund 3.4% 11.2% 5.7% -5.2% -9.5%<br />
S&P 500 Index 3.5% 11.3% 5.9% -5.1% -9.4%<br />
Large Cap Growth Equity Fund 1.1% 10.3% 6.8% 1.9% -12.9%<br />
Russell 1000 Growth Index 1.3% 10.0% 6.3% -0.7% -10.2%<br />
Non-U.S. Equity Fund 8.0% 24.2% 18.7% 6.9% -8.7%<br />
MSCI ACWI ex U.S. Index ** 7.0% 23.2% 16.0% 2.1% -9.1%<br />
Mid Cap Equity Index Fund 8.9% 15.0% 7.0% -7.0% -8.9%<br />
S&P MidCap 400 Index 9.0% 15.1% 7.1% -7.0% -8.8%<br />
Small Cap Equity Fund 2.3% 11.9% 2.1% -15.3% -13.1%<br />
Russell 2000 Index 5.0% 14.9% 5.1% -13.0% -9.9%<br />
<strong>Halliburton</strong> Stock Fund 5.7% 31.3% 22.6% 24.8% 3.9%<br />
*Annualized.<br />
**Returns pri<strong>or</strong> to January 1, 2005, include MSCI EAFE Index, the previous fund benchmark.<br />
11