Polar mesosphere summer echoes (PMSE): review of ... - HAL
Polar mesosphere summer echoes (PMSE): review of ... - HAL
Polar mesosphere summer echoes (PMSE): review of ... - HAL

You also want an ePaper? Increase the reach of your titles
YUMPU automatically turns print PDFs into web optimized ePapers that Google loves.
Atmos. Chem. Phys., 4, 2601–2633, 2004<br />
www.atmos-chem-phys.org/acp/4/2601/<br />
SRef-ID: 1680-7324/acp/2004-4-2601<br />
European Geosciences Union<br />
Atmospheric<br />
Chemistry<br />
and Physics<br />
<strong>Polar</strong> <strong>mesosphere</strong> <strong>summer</strong> <strong>echoes</strong> (<strong>PMSE</strong>): <strong>review</strong> <strong>of</strong> observations<br />
and current understanding<br />
M. Rapp and F.-J. Lübken<br />
Leibniz Institute <strong>of</strong> Atmospheric Physics, Schlossstr. 6, 18225 Kühlungsborn, Germany<br />
Received: 10 June 2004 – Published in Atmos. Chem. Phys. Discuss.: 24 August 2004<br />
Revised: 15 November 2004 – Accepted: 22 November 2004 – Published: 21 December 2004<br />
Abstract. <strong>Polar</strong> <strong>mesosphere</strong> <strong>summer</strong> <strong>echoes</strong> (<strong>PMSE</strong>) are<br />
very strong radar <strong>echoes</strong> primarily studied in the VHF<br />
wavelength range from altitudes close to the polar <strong>summer</strong><br />
mesopause. Radar waves are scattered at irregularities in the<br />
radar refractive index which at mesopause altitudes is effectively<br />
determined by the electron number density. For efficient<br />
scatter, the electron number density must reveal structures<br />
at the radar half wavelength (Bragg condition for monostatic<br />
radars; ∼3 m for typical VHF radars). The question<br />
how such small scale electron number density structures are<br />
created in the mesopause region has been a longstanding<br />
open scientific question for almost 30 years. This paper <strong>review</strong>s<br />
experimental and theoretical milestones on the way to<br />
an advanced understanding <strong>of</strong> <strong>PMSE</strong>. Based on new experimental<br />
results from in situ observations with sounding rockets,<br />
ground based observations with radars and lidars, numerical<br />
simulations with microphysical models <strong>of</strong> the life cycle<br />
<strong>of</strong> mesospheric aerosol particles, and theoretical considerations<br />
regarding the diffusivity <strong>of</strong> electrons in the ice loaded<br />
complex plasma <strong>of</strong> the mesopause region, a consistent explanation<br />
for the generation <strong>of</strong> these radar <strong>echoes</strong> has been<br />
developed. The main idea is that mesospheric neutral air turbulence<br />
in combination with a significantly reduced electron<br />
diffusivity due to the presence <strong>of</strong> heavy charged ice aerosol<br />
particles (radii ∼5–50 nm) leads to the creation <strong>of</strong> structures<br />
at spatial scales significantly smaller than the inner scale <strong>of</strong><br />
the neutral gas turbulent velocity field itself. Importantly,<br />
owing to their very low diffusivity, the plasma structures acquire<br />
a very long lifetime, i.e., 10 min to hours in the presence<br />
<strong>of</strong> particles with radii between 10 and 50 nm. This leads<br />
to a temporal decoupling <strong>of</strong> active neutral air turbulence and<br />
the existence <strong>of</strong> small scale plasma structures and <strong>PMSE</strong><br />
and thus readily explains observations proving the absence<br />
<strong>of</strong> neutral air turbulence at <strong>PMSE</strong> altitudes. With this expla-<br />
Correspondence to: M. Rapp<br />
(rapp@iap-kborn.de)<br />
nation at hand, it becomes clear that <strong>PMSE</strong> are a suitable tool<br />
to permanently monitor the thermal and dynamical structure<br />
<strong>of</strong> the mesopause region allowing insights into important atmospheric<br />
key parameters like neutral temperatures, winds,<br />
gravity wave parameters, turbulence, solar cycle effects, and<br />
long term changes.<br />
1 Introduction<br />
The polar <strong>mesosphere</strong> in <strong>summer</strong> is host to a number <strong>of</strong> fascinating<br />
geophysical phenomena that are primarily caused<br />
by its extreme thermal structure. Owing to the gravity wave<br />
driven mean meridional circulation with upwelling and adiabatically<br />
expanding air masses above the <strong>summer</strong> pole,<br />
mean minimum temperatures <strong>of</strong> ∼130 K are reached at the<br />
mesopause at around 88 km (e.g., Lübken, 1999). These extremely<br />
low temperatures marginally allow ice particles to<br />
form and grow at altitudes between ∼80 and 90 km, in spite<br />
<strong>of</strong> the minute abundance <strong>of</strong> water vapor with typical volume<br />
mixing ratios <strong>of</strong> only some ppm (e.g., Seele and Hartogh,<br />
1999). Under favourable conditions the largest <strong>of</strong> these<br />
ice particles (with radii larger than ∼20 nm) can even be visually<br />
observed in the form <strong>of</strong> noctilucent clouds (= NLC)<br />
which have been discovered as early as 1883 (Leslie, 1885;<br />
Jesse, 1885). With the advent <strong>of</strong> the MST radar (MST =<br />
<strong>mesosphere</strong>-stratosphere-troposphere) 100 years later, it was<br />
then found that also the smaller subvisible ice particles lead<br />
to measurable signatures in the form <strong>of</strong> strong radar <strong>echoes</strong>.<br />
These are nowadays known as polar <strong>mesosphere</strong> <strong>summer</strong><br />
<strong>echoes</strong> or <strong>PMSE</strong> (Ecklund and Balsley, 1981; Röttger et al.,<br />
1988; Hoppe et al., 1988).<br />
In recent years, these high atmospheric ice clouds have<br />
reached a considerable scientific interest since it was suspected<br />
that the mesopause environment should change due<br />
to anthropogenic activity. For example, models showed that<br />
the increase <strong>of</strong> atmospheric carbon dioxide concentrations<br />
© 2004 Author(s). This work is licensed under a Creative Commons License.
2602 M. Rapp and F. J. Lübken: Review <strong>of</strong> <strong>PMSE</strong><br />
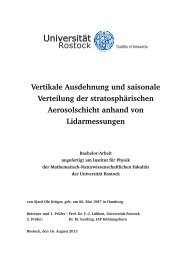
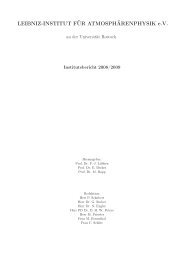
Fig. 1. Left panel: Schematic <strong>of</strong> the altitude pr<strong>of</strong>ile <strong>of</strong> the temperature<br />
and the frost point <strong>of</strong> water vapor. Right panel: Schematic<br />
<strong>of</strong> the altitude distribution <strong>of</strong> <strong>PMSE</strong> (black line, grey shading) and<br />
NLC (red line) and the relevant physical mechanisms at different<br />
altitudes.<br />
should lead to a temperature decrease in the mesopause<br />
region (Roble and Dickinson, 1989) and it was also argued<br />
that increasing atmospheric concentrations <strong>of</strong> methane<br />
should lead to enhanced water vapor at mesopause altitudes<br />
(Thomas et al., 1989).<br />
At the current stage the discussion as to whether we already<br />
observe long term changes in mesospheric ice particle<br />
properties is controversial (von Zahn, 2003; Thomas<br />
et al., 2003). However, it is evident that for a scientifically<br />
based judgement about these issues we require a detailed<br />
and rigorous understanding <strong>of</strong> the physical processes<br />
involved. While the basic physics <strong>of</strong> noctilucent clouds has<br />
been quite well understood (e.g., Thomas, 1991; Gadsden<br />
and Schröder, 1989), the understanding <strong>of</strong> polar <strong>mesosphere</strong><br />
<strong>summer</strong> <strong>echoes</strong> has bothered the scientific community until<br />
only recently (Cho and Röttger, 1997; Rapp and Lübken,<br />
2003a).<br />
In order to ease the reading <strong>of</strong> this <strong>review</strong>, we summarize<br />
the now available understanding <strong>of</strong> <strong>PMSE</strong> as follows (see<br />
Fig. 1): the altitude range between 80 and 90 km in the <strong>summer</strong><br />
polar mesopause region is just the altitude range where<br />
ice particles exist. Being formed close to the point with coldest<br />
temperatures (∼88 km), ice particles sediment and grow,<br />
until below ∼85 km, radii have become as large as ∼20 nm.<br />
With this size they can be optically observed as NLC, for<br />
example with the naked eye or with lidars. All these ice particles<br />
are immersed in the plasma <strong>of</strong> the D-region. Hence,<br />
electrons attach to the ice surfaces such that the particles become<br />
charged. In addition, the 80–90 km altitude range is<br />
the region in the atmosphere where gravity waves propagating<br />
from below grow unstable and produce turbulence. The<br />
charged ice particles are transported by the turbulent velocity<br />
field leading to small scale structures in the spatial distribution<br />
<strong>of</strong> the charged particles and – because <strong>of</strong> charge neutrality<br />
requirements – to small scale structures in the spatial<br />
distribution <strong>of</strong> the electron number density. Hence, the trans-<br />
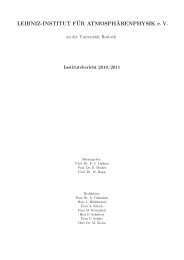
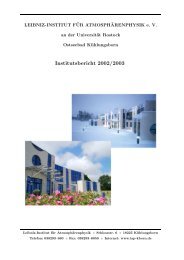
Fig. 2. Time averaged pr<strong>of</strong>iles <strong>of</strong> signal to noise ratio (in decibels)<br />
for typical <strong>summer</strong> and winter periods. This figure is reproduced<br />
from Ecklund and Balsley (1981), copyright by the American Geophysical<br />
Union.<br />
port <strong>of</strong> charged ice particles by the turbulent velocity field<br />
leads to the occurrence <strong>of</strong> irregularities in the radio refractive<br />
index (which is effectively determined by the electron<br />
number density at these altitudes) which is observed on the<br />
ground as <strong>PMSE</strong>. Importantly, the radius <strong>of</strong> the ice particle<br />
determines the lifetime <strong>of</strong> the irregularities. Typical values<br />
for the lifetime are just a few minutes for small radii at altitudes<br />
above ∼85 km and several ten minutes to hours for the<br />
larger radii below. Hence, at altitudes above ∼85 km, <strong>PMSE</strong><br />
can only exist during phases <strong>of</strong> active neutral air turbulence.<br />
In contrast, the long lifetime below this altitude ‘freezes’ in<br />
the plasma structures such that <strong>PMSE</strong> also occurs in the absence<br />
<strong>of</strong> neutral air turbulence. Since these frozen in structures<br />
once originated from turbulent advection, they are also<br />
<strong>of</strong>ten termed ‘fossil’-turbulent structures.<br />
The complex physical explanation shortly summarized<br />
above has become available through a multitude <strong>of</strong> observational<br />
and theoretical efforts. In this manuscript we attempt<br />
to describe the experimental and theoretical milestones<br />
that have led to the understanding sketched above.<br />
In Sect. 2 we summarize the most important experimental<br />
findings on <strong>PMSE</strong> based on classical radar measurements, in<br />
situ rocket probings and also active radar experiments where<br />
electromagnetic waves have been used to modify the <strong>PMSE</strong><br />
Atmos. Chem. Phys., 4, 2601–2633, 2004<br />
www.atmos-chem-phys.org/acp/4/2601/
M. Rapp and F. J. Lübken: Review <strong>of</strong> <strong>PMSE</strong> 2603<br />
environment directly from the ground and observe the corresponding<br />
response <strong>of</strong> the <strong>PMSE</strong> layer. In Sect. 3 we proceed<br />
with an overview <strong>of</strong> our theoretical understanding <strong>of</strong> the relevant<br />
physical mechansms including a detailed description<br />
<strong>of</strong> the most recent progress. This latest understanding <strong>of</strong> the<br />
physics <strong>of</strong> <strong>PMSE</strong> is discussed in depth in Sect. 4 followed<br />
by our conclusions and an outlook where we try to identify<br />
important open issues for future investigations.<br />
2 Experimental facts<br />
2.1 Initial observations and basic physical problem<br />
At the end <strong>of</strong> the 1970s, VHF radars operating at frequencies<br />
<strong>of</strong> ∼50 MHz discovered very strong radar <strong>echoes</strong> from<br />
around the <strong>summer</strong> mesopause region at altitudes between<br />
∼80 and 90 km both at polar and mid latitudes (Ecklund<br />
and Balsley, 1981; Czechowsky et al., 1979). The first long<br />
term data set covering observations at Poker Flat, Alaska<br />
(65 ◦ N) between February 1979 and December 1980 revealed<br />
a strong seasonal variation <strong>of</strong> both the observed echo power<br />
and the altitude range where the <strong>echoes</strong> were observed (Ecklund<br />
and Balsley, 1981). Figure 2 shows the time averaged<br />
altitude pr<strong>of</strong>iles <strong>of</strong> signal to noise ratio (SNR) for typical<br />
<strong>summer</strong> and winter periods taken from this study. Evidently,<br />
during the <strong>summer</strong> months the average signal peak is located<br />
considerably higher (i.e., at ∼86 km) than during winter<br />
time, where only weak <strong>echoes</strong> (average SNR ratios ∼5 dB)<br />
are received from altitudes below ∼75 km. During <strong>summer</strong><br />
time, however, the <strong>echoes</strong> are extremely strong reaching a<br />
maximum average SNR <strong>of</strong> ∼30 dB. Due to their predominant<br />
appearance in the polar regions these strong <strong>echoes</strong> are<br />
commonly called polar <strong>mesosphere</strong> <strong>summer</strong> <strong>echoes</strong> or <strong>PMSE</strong><br />
(Röttger et al., 1988; Hoppe et al., 1988).<br />
Radar waves are scattered by irregularities in the refractive<br />
index which at altitudes around 85 km is effectively determined<br />
by the electron number density (e.g., Sato, 1989,<br />
page 23–25). In general, one distinguishes between incoherent<br />
scatter (or Thomson scatter) which is due to the thermal<br />
random motion <strong>of</strong> the electrons and coherent scatter,<br />
i.e., the scatter at ordered structures in the electron density<br />
distribution. Coherent scatter only occurs when the refractive<br />
index irregularity spectrum possesses significant spectral<br />
power at scales around the radar half wavelength (=<br />
Bragg condition for monostatic radars) which is 3 m for a<br />
50 MHz radar (Tatarskii, 1971). The irregularities leading<br />
to the weak radar backscatter outside the polar <strong>summer</strong> season<br />
at altitudes below say ∼75 km have been traced back to<br />
neutral air turbulence (Woodman and Guillen, 1974; Balsley<br />
et al., 1983; Røyrvik and Smith, 1984) which in turn is<br />
generated by breaking gravity waves propagating upwards<br />
from the troposphere (note though that recent experimental<br />
evidence <strong>of</strong> so called ‘polar <strong>mesosphere</strong> winter <strong>echoes</strong>’ indicates<br />
that at least some <strong>of</strong> these <strong>echoes</strong> at lower altitudes<br />
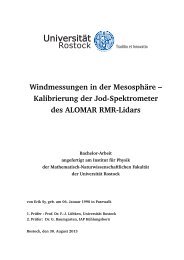
Fig. 3. Idealized power spectrum <strong>of</strong> a passive turbulent tracer θ<br />
for typical mesospheric conditions. The inertial and viscous subranges<br />
are characterized by a wavenumber dependence proportional<br />
to k −5/3 and ∼k −7 , respectively. The upper ordinate converts<br />
wavenumbers to lengths. The grey dashed line indicates the inner<br />
scale (see text for details) and the red dashed line indicates the<br />
Bragg scale <strong>of</strong> a 50 MHz radar.<br />
may not be understandable in the scope <strong>of</strong> pure turbulent activity;<br />
Kirkwood et al., 2002a, 2003). However, early efforts<br />
to explain the significantly stronger <strong>echoes</strong> from the <strong>summer</strong><br />
polar mesopause region by neutral air turbulence led to<br />
a paradox that was already identified in the early work on the<br />
subject (Balsley et al., 1983): In Fig. 3 we present a typical<br />
power spectrum <strong>of</strong> a tracer (like neutral air density fluctuations)<br />
for turbulent motions in the middle atmosphere. This<br />
power spectrum reveals two distinct parts. The first part is<br />
marked by a wavenumber dependence <strong>of</strong> k −5/3 and is called<br />
the inertial subrange, because at these scales the flow is dominated<br />
by inertial forces. The second part <strong>of</strong> the spectrum is<br />
called the viscous subrange and is characterized by a much<br />
faster drop <strong>of</strong>f <strong>of</strong> the spectral power, i.e., it is proportional<br />
to ∼k −7 . In this subrange, the tracer variance is effectively<br />
destroyed by molecular diffusion (e.g., Heisenberg, 1948).<br />
Note that the absolute power <strong>of</strong> the tracer variance strongly<br />
depends on the background gradient <strong>of</strong> the tracer distribution,<br />
i.e., at a given length scale, the tracer fluctutaions are<br />
the larger the larger the background gradient is (in the extreme<br />
opposite case <strong>of</strong> a zero background gradient, small<br />
scale fluctuations can certainly not be created by the turbulent<br />
eddies). From this figure, it is evident that in order to satisfy<br />
the Bragg criterium, the radar half wavelength must be located<br />
in the inertial subrange <strong>of</strong> the turbulent power spectrum<br />
since for smaller scales, i.e., in the viscous subrange, irregularities<br />
practically do not exist. The smallest scale to which<br />
the inertial subrange extends, depends on two quantities: the<br />
turbulence strength expressed by the turbulent energy dissipation<br />
rate ɛ (= the rate at which turbulent kinetic energy is<br />
dissipated into heat) and the kinematic viscosity ν which parameterizes<br />
the strength <strong>of</strong> molecular diffusion. A minimum<br />
necessary turbulent energy dissipation rate can be estimated<br />
by equating the inner scale l H 0 =9.9·(ν3 /ɛ) 1 4 (= the transition<br />
www.atmos-chem-phys.org/acp/4/2601/ Atmos. Chem. Phys., 4, 2601–2633, 2004
2604 M. Rapp and F. J. Lübken: Review <strong>of</strong> <strong>PMSE</strong><br />
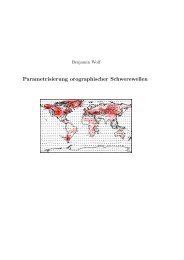
Fig. 4. Seasonal variation <strong>of</strong> the occurrence rate <strong>of</strong> <strong>PMSE</strong> with<br />
a SNR ratio larger than 10 dB after observations with the ALWIN<br />
radar on the North-Norwegian island Andøya during the years 1999,<br />
2000, and 2001. This figure is reproduced from Bremer et al.<br />
(2003), copyright by the American Geophysical Union.<br />
scale between the inertial and the viscous subrange; see also<br />
Lübken et al., 1993b) and the radar Bragg scale. Using a typical<br />
kinematic viscosity for an altitude <strong>of</strong> 85 km <strong>of</strong> 1 m 2 /s,<br />
this estimate yields ɛ≈100 W/kg equivalent to a heating rate<br />
<strong>of</strong> dT /dt=90 000 K/d. This heating rate is three orders <strong>of</strong><br />
magnitude larger than all other relevant heating and cooling<br />
rates at the same altitudes and is clearly unrealistic (e.g.,<br />
Mlynczak, 2000; Lübken, 1997).<br />
Ever since the initial observations, it has hence been a major<br />
goal <strong>of</strong> both experimental and theoretical investigations<br />
on <strong>PMSE</strong> to resolve this paradox and identify the physical<br />
processes responsible for the creation <strong>of</strong> structures in the<br />
electron number density where under normal conditions they<br />
should not exist. In the following subsections, we present<br />
an overview <strong>of</strong> the milestones regarding the available observational<br />
work on <strong>PMSE</strong> forming the background <strong>of</strong> our current<br />
knowledge. Note that given the wealth <strong>of</strong> experimental<br />
investigations we are aware <strong>of</strong> the fact that the results presented<br />
can only be a selection <strong>of</strong> some <strong>of</strong> the relevant work<br />
in the field. For further reading we also refer to the excellent<br />
previous <strong>review</strong> articles by Cho and Kelley (1993) and Cho<br />
and Röttger (1997).<br />
2.2 Climatology<br />
2.2.1 Seasonal variation<br />
As already evident from the pioneer work by Ecklund and<br />
Balsley (1981), <strong>PMSE</strong> reveal a pronounced seasonal variation.<br />
Figure 4 shows the seasonal variation <strong>of</strong> the occurrence<br />
rate <strong>of</strong> <strong>PMSE</strong> as observed with the 53 MHz ALWIN radar<br />
(ALWIN = ALOMAR Wind radar; ALOMAR = Arctic Lidar<br />
Observatory for Middle Atmosphere Research) on the<br />
North-Norwegian island Andøya (69.3 ◦ N, 16.0 ◦ E) during<br />
the years 1999, 2000, and 2001 (Bremer et al., 2003; Latteck<br />
et al., 1999a). The main characteristics are the steep<br />
increase during end <strong>of</strong> May/beginning <strong>of</strong> June, a rather high<br />
level near 90% in the middle <strong>of</strong> June until the middle/end <strong>of</strong><br />
Fig. 5. Contour plot <strong>of</strong> the degree <strong>of</strong> saturation S as a function<br />
<strong>of</strong> season and altitude (shaded areas) derived from a falling sphere<br />
temperature and density climatology and model water vapor mixing<br />
ratios from Garcia and Solomon (1994). In addition, relative occurrence<br />
probabilities are shown (normalized to 100% at the maximum)<br />
for <strong>PMSE</strong> (dashed line) and NLC (dotted line). This figure is<br />
reproduced from Lübken (1999), copyright by the American Geophysical<br />
Union.<br />
July, and a more gradual decrease during August. The observations<br />
shown in Fig. 4 are in general agreement with independent<br />
observations from different radars located at about<br />
the same geographical latitude (e.g., Balsley and Huaman,<br />
1997; Kirkwood et al., 1998). Intrigued by the fact that the<br />
seasonal variation <strong>of</strong> the NLC occurrence rate is very similar<br />
(Gadsden, 1998), several authors have tried to relate the occurrence<br />
<strong>of</strong> <strong>PMSE</strong> to the occurrence <strong>of</strong> ice particles that may<br />
form in the period from end <strong>of</strong> May until the end <strong>of</strong> August<br />
because <strong>of</strong> the very low temperatures <strong>of</strong> the mesopause region<br />
(e.g., Lübken, 1999). Figure 5 shows a comparison <strong>of</strong><br />
the NLC- and <strong>PMSE</strong>-occurrence rate as a function <strong>of</strong> season<br />
and the time and altitude range during which the degree <strong>of</strong><br />
water ice saturation S is larger than 1 (Lübken, 1999). S is<br />
the ratio between the actual water vapor partial pressure and<br />
the saturation vapor pressure over ice which Lübken (1999)<br />
derived from a climatology <strong>of</strong> temperatures and air densities<br />
obtained with the falling sphere technique and water vapor<br />
mixing ratios from model simulations (Garcia and Solomon,<br />
1994). The saturation water vapor pressure over ice was derived<br />
from the empirical formula <strong>of</strong> Marti and Mauersberger<br />
(1993). It is evident from this comparison that <strong>PMSE</strong> occur<br />
in exactly the height and time interval where ice particles<br />
can exist in the mesopause region and confirms earlier<br />
considerations that ice particles may play a decisive role in<br />
the creation <strong>of</strong> the radar <strong>echoes</strong> (Cho and Kelley, 1993; Cho<br />
and Röttger, 1997). Note that since the work <strong>of</strong> Lübken<br />
(1999) better data on both water vapor in the mesopause<br />
region and an updated empirical formula for the saturation<br />
vapor pressure have become available (Seele and Hartogh,<br />
1999; Körner and Sonnemann, 2001; McHugh et al., 2003;<br />
Mauersberger and Krankowsky, 2003). However, including<br />
Atmos. Chem. Phys., 4, 2601–2633, 2004<br />
www.atmos-chem-phys.org/acp/4/2601/
M. Rapp and F. J. Lübken: Review <strong>of</strong> <strong>PMSE</strong> 2605<br />
Table 1. <strong>PMSE</strong> studies at different frequencies.<br />
Frequency Location Reference Reflectivity<br />
(Bragg scale)<br />
[MHz (m)] [m −1 ]<br />
2.78 (53.9) Tromsø, (69 ◦ N) Bremer et al. (1996b)<br />
8–9 (18.8) Vasil’surk, Russia (56 ◦ N) Karashtin et al. (1997)<br />
3.3, 4.9, 7.6 Gakona, Alaska, (62 ◦ N) Kelley et al. (2002)<br />
9, 11, 13. 15 Hankasalmi, Finnland, (62 ◦ N) Ogawa et al. (2003)<br />
49.6 (3.0) Tromsø, (69 ◦ N) Röttger et al. (1990) 2.0·10 −12<br />
50.0 (3.0) Poker Flat (65 ◦ N) Ecklund and Balsley (1981)<br />
Kelley and Ulwick (1988) 9.0·10 −15<br />
51.5 (2.9) Resolut Bay (75 ◦ N) Huaman et al. (2001)<br />
53.5 (2.8) Andøya, (69 ◦ N) Inhester et al. (1990) 4.0·10 −12<br />
53.5 (2.8) Svalbard, (78 ◦ N) Röttger (2001) 2.2·10 −14<br />
224 (0.67) Tromsø, (69 ◦ N) Hoppe et al. (1988) 1.5·10 −16<br />
Röttger et al. (1988)<br />
Hocking and Röttger (1997) 1.3·10 −15<br />
500 (0.3) Svalbard, (78 ◦ N) Röttger (2001) 5.3·10 −19<br />
933 (0.16) Tromsø, (69 ◦ N) Röttger et al. (1990) 1.2·10 −18<br />
1290 (0.12) Sondrestrom, (67 ◦ N) Cho and Kelley (1992)<br />
this new information does not change the general conclusion<br />
that the <strong>PMSE</strong>- and ice particle- existence period and altitude<br />
region are identical.<br />
2.2.2 Latitudinal variation<br />
Apart from the aforementioned measurements at ∼65–69 ◦ N,<br />
<strong>PMSE</strong> have also been observed as far North as 75 ◦ N and<br />
78 ◦ N (Huaman et al., 2001; Rüster et al., 2001; Lübken<br />
et al., 2004) and as far South as 52–54 ◦ N where the <strong>echoes</strong><br />
are then consequently called ‘<strong>mesosphere</strong> <strong>summer</strong> <strong>echoes</strong>’<br />
or MSE (Czechowsky et al., 1979; Reid et al., 1989; Thomas<br />
et al., 1992; Latteck et al., 1999b; Zecha et al., 2003). While<br />
a lot <strong>of</strong> general features like the typical echo strengths and<br />
the altitude region <strong>of</strong> occurrence are independent <strong>of</strong> the geographic<br />
latitude, it has been found that the occurrence rate<br />
shows a pronounced gradient with latitude (all values for 1<br />
July): the occurrence rate drops from almost 100% at 78 ◦ N<br />
(Lübken et al., 2004), ∼90% at 69 ◦ N (Bremer et al., 2003),<br />
to only ∼10–20% at 54 ◦ N (Zecha et al., 2003). This general<br />
picture is in line with recent 3d-model results <strong>of</strong> the thermal<br />
and dynamical structure <strong>of</strong> the <strong>mesosphere</strong> suggesting<br />
colder temperatures closer to the pole and hence a more favorable<br />
environment for the formation <strong>of</strong> ice particles (von<br />
Zahn and Berger, 2003). This picture is only ‘disturbed’<br />
by the observations at Resolut Bay (75 ◦ N) where low occurrence<br />
frequencies <strong>of</strong> less than ∼50% have been reported<br />
(Huaman et al., 2001).<br />
Note though that occurrence frequencies reported from<br />
different stations and radars must be considered with some<br />
caution since the radars are not identical in design and hence<br />
do not have the same absolute sensitivity. In particular, it<br />
must be noted that the VHF radar at Resolut Bay operated<br />
at a significantly smaller peak transmitted power (i.e., only<br />
12 kW compared to 36 kW in the case <strong>of</strong> the radars at 69 ◦ N<br />
and 54 ◦ N, and even 60 kW in the case <strong>of</strong> the SOUSY Svalbard<br />
radar at 78 ◦ N). Unfortunately, absolutely calibrated<br />
volume reflectivities from these radars are only available for<br />
some selected case studies (see Sect. 2.3.1) since absolute<br />
calibrations are extremely difficult to obtain. Nevertheless, in<br />
future experiments every effort should be undertaken to obtain<br />
<strong>PMSE</strong> measurements using calibrated signal strengths,<br />
since only this will allow to perform unambiguous comparisons<br />
<strong>of</strong> observations at different sites.<br />
<strong>PMSE</strong> have also been observed at Southern latitudes even<br />
though significantly less frequent than in the Northern hemisphere<br />
(Balsley et al., 1993, 1995; Woodman et al., 1999;<br />
Ogawa et al., 2002; Hosokawa et al., 2004). Possible<br />
hemispheric differences in the thermal and dynamical structure<br />
have been discussed (Dowdy et al., 2001; Becker and<br />
Schmitz, 2003; Siskind et al., 2003; Chu et al., 2003), however,<br />
the experimental data base is scarce such that the reason<br />
for the apparent hemispheric asymmetry remains to be identified<br />
(Lübken et al., 1999).<br />
2.2.3 Long term and short term variations<br />
Recently, first results on long term changes <strong>of</strong> <strong>PMSE</strong> properties<br />
have been reported. Bremer et al. (2003) considered<br />
mean <strong>PMSE</strong> occurrence frequencies for the years 1994<br />
through 2001 and found a significant positive correlation<br />
with the solar Ly-α radiation (the Ly-α flux varies by about<br />
www.atmos-chem-phys.org/acp/4/2601/ Atmos. Chem. Phys., 4, 2601–2633, 2004
2606 M. Rapp and F. J. Lübken: Review <strong>of</strong> <strong>PMSE</strong><br />
Fig. 6. Spectra <strong>of</strong> incoherent scatter signals (left panel) and <strong>of</strong><br />
coherent-scatter polar <strong>mesosphere</strong> <strong>summer</strong> <strong>echoes</strong> measured with<br />
the EISCAT 224 MHz radar in Tromsø. This figure is reproduced<br />
from Röttger and LaHoz (1990).<br />
a factor <strong>of</strong> 2 during one 11-year solar cycle). The authors<br />
concluded that the observed variation is due to changes in<br />
the background ionization that is mainly controlled by the<br />
ionization <strong>of</strong> NO due to Ly-α. These arguments are in line<br />
with considerations by Rapp et al. (2002a) who argued that<br />
moderate changes <strong>of</strong> ionization should lead to a positive correlation<br />
with the <strong>PMSE</strong> signal strength.<br />
On shorter time scales a variety <strong>of</strong> other physical processes<br />
altering <strong>PMSE</strong> properties have been identified. For example,<br />
Kirkwood and Rechou (1998) and Kirkwood et al. (2002b)<br />
demonstrated that <strong>PMSE</strong> were modulated by 5-day planetary<br />
waves. H<strong>of</strong>fmann et al. (1999) reported a strong semidiurnal<br />
variation <strong>of</strong> both the SNR and the altitude where the maximum<br />
SNR was observed. This variation is in phase with<br />
similar semidiurnal variations in NLC properties (like centroid<br />
altitude and brightness) and has been traced back to the<br />
action <strong>of</strong> the semidiurnal tide with minor contributions from<br />
the diurnal variation <strong>of</strong> ionization (von Zahn et al., 1998; von<br />
Zahn and Bremer, 1999; Klostermeyer, 1999a). Other reasons<br />
for short term variability have been identified as solar<br />
and geomagnetic activity (Bremer et al., 1996a, 2001) as well<br />
as dynamical phenomena like e.g. gravity waves that mainly<br />
move the <strong>PMSE</strong> layers up and down and lead to substantial<br />
vertical velocities in <strong>PMSE</strong> reaching values <strong>of</strong> ∼±5 m/s<br />
(e.g., Hoppe and Fritts, 1994, 1995; Rüster et al., 1996). In<br />
addition, low frequency gravity waves may occasionally also<br />
have a pr<strong>of</strong>ound influence on the occurrence <strong>of</strong> <strong>PMSE</strong> (Chilson<br />
et al., 1997).<br />
2.3 Properties <strong>of</strong> <strong>PMSE</strong> layers<br />
2.3.1 Radar frequency dependence<br />
One <strong>of</strong> the most striking properties <strong>of</strong> <strong>PMSE</strong> is the pronounced<br />
dependence <strong>of</strong> the absolute observed volume reflectivity<br />
(= the backscattering cross section per unit volume) on<br />
the radar frequency: since the first observations at 50 MHz,<br />
<strong>PMSE</strong> have been observed at a variety <strong>of</strong> frequencies between<br />
2.78 MHz and 1.29 GHz. Table 1 gives an overview<br />
<strong>of</strong> different studies published to date together with some <strong>of</strong><br />
the most important results, including reported absolute volume<br />
reflectivities. Even though the different measurements<br />
<strong>of</strong> volume reflectivities were not performed at the same location<br />
and time (and must hence be compared with a cautionary<br />
note in mind since the geopyhsical situation is certainly<br />
different), it is evident from Table 1 that the volume reflectivity<br />
shows a tremendous decrease with increasing frequency<br />
(or decreasing Bragg scale). For example, from 50 MHz to<br />
500 MHz, the Bragg scale changes by only one order <strong>of</strong> magnitude,<br />
i.e., from 3 m to 30 cm, but the corresponding reflectivities<br />
change by as much as 6 orders <strong>of</strong> magnitude. This frequency<br />
dependence certainly poses severe constraints on any<br />
physical explanation <strong>of</strong> <strong>PMSE</strong> – we will come back to this<br />
issue when we discuss possible physical explanations (see<br />
Sect. 3.3.2).<br />
2.3.2 Spectral shape<br />
Further information on the physical mechanism responsible<br />
for the creation <strong>of</strong> the electron irregularities leading to <strong>PMSE</strong><br />
is obtained from the Doppler-broadened spectra <strong>of</strong> the received<br />
signals. As explained in detail for example in Hocking<br />
(1989), the Doppler spectral width yields information on<br />
the velocity variance <strong>of</strong> the detected scatterers in the radial<br />
direction (= the pointing direction <strong>of</strong> the radar beam). The<br />
highest precision data on <strong>PMSE</strong> spectral widths obtained so<br />
far have been measured with the EISCAT VHF radar operating<br />
at 224 MHz (Röttger et al., 1988). This radar possesses<br />
the advantage <strong>of</strong> a narrow beam (i.e., only 1 km horizontal<br />
extent at ∼85 km) such that the spectra are not significantly<br />
affected by effects like beam- or shear-broadening (Hocking,<br />
1989). Figure 6 shows a comparison <strong>of</strong> the spectra <strong>of</strong> incoherent<br />
signals from the ionosphere (left panel) and coherent<br />
signals from a <strong>PMSE</strong> (right panel) after Röttger and LaHoz<br />
(1990). Figure 6 shows several interesting features: First <strong>of</strong><br />
all, the comparison <strong>of</strong> the absolute spectral widths <strong>of</strong> incoherent<br />
and coherent spectra clearly demonstrates the completely<br />
different physical processes underlying the spectra:<br />
while the incoherent scatter spectra (being due to the Brownian<br />
motion <strong>of</strong> the electrons) show a typical width on the order<br />
<strong>of</strong> ∼100 Hz at 83.6 km, corresponding spectra from the<br />
coherent <strong>echoes</strong> are much narrower, i.e., the broadest spectra<br />
only yield widths <strong>of</strong> 10–15 Hz and can be as narrow as<br />
∼1 Hz. Following Hocking (1985), Röttger et al. (1988) related<br />
these widths to turbulent rms-velocity fluctuations with<br />
corresponding values between 0.5–10 m/s. Rms-fluctuations<br />
as small as 0.5 m/s underline the paradox already mentioned<br />
above: according to Hocking (1985) and Gibson-Wilde et al.<br />
(2000) the rms-velocity fluctuations w rms may be converted<br />
to a turbulent energy dissipation rate by ɛ=2·ω B ·w 2 rms where<br />
Atmos. Chem. Phys., 4, 2601–2633, 2004<br />
www.atmos-chem-phys.org/acp/4/2601/
M. Rapp and F. J. Lübken: Review <strong>of</strong> <strong>PMSE</strong> 2607<br />
√<br />
ω B = g<br />
T ( dT<br />
dz + g<br />
c p<br />
) is the Brunt-Väisälä frequency (where T<br />
is temperature, g is the acceleration due to gravity, and c p is<br />
the specific heat <strong>of</strong> air at constant pressure). Using a typical<br />
value <strong>of</strong> ω B =10 −2 1/s we see that w rms =0.5 m/s corresponds<br />
to ɛ=5×10 −3 W/kg. On the other hand, to have the inner<br />
scale <strong>of</strong> turbulence equal to the Bragg scale (which is 67 cm<br />
in the case <strong>of</strong> the EISCAT 224 MHz radar), ɛ=5×10 4 W/kg<br />
would be required. Hence, there is a discrepancy <strong>of</strong> seven orders<br />
<strong>of</strong> magnitude (!) between the required turbulent energy<br />
dissipation rate to explain the scatter as being due to pure<br />
neutral air turbulence and the value derived from the spectral<br />
width <strong>of</strong> the radar signal.<br />
In addition, Röttger and LaHoz (1990) pointed out that<br />
also the spectral shape <strong>of</strong> the <strong>PMSE</strong> is significantly different<br />
from the usually assumed Lorentzian shape <strong>of</strong> incoherent<br />
scatter spectra (e.g., Hoppe and Hansen, 1988). Rather,<br />
the <strong>PMSE</strong> spectra appear as a superposition <strong>of</strong> several narrow<br />
band spectra (Fig. 6, spectra for 2 July 1987) or as a<br />
single high amplitude spike superimposed on a weaker and<br />
wider spectral background (Fig. 6, spectra for 9 July 1987).<br />
Röttger and LaHoz hypothesized that these signatures were<br />
due to fairly small and localized refractive index structures<br />
coexisting within the radar beam (i.e., within a volume <strong>of</strong><br />
1 km in vertical and 2 km in horizontal extent) which move<br />
with different velocities. This would further imply that the<br />
structures causing <strong>PMSE</strong> are unlikely to be filling the scattering<br />
volume homogeneously.<br />
2.3.3 Aspect sensitivity<br />
A further property <strong>of</strong> the radar <strong>echoes</strong> that can potentially<br />
teach us a lot about the physics <strong>of</strong> the scattering process and<br />
the nature <strong>of</strong> the scatterers is the so called aspect sensitivity.<br />
The aspect sensitivity describes the radar signal dependence<br />
when the beam is tilted from the vertical direction. In<br />
general, a strong signal decrease with increasing beam tilting<br />
angle implies that the observed scatterers are specular<br />
(like in the case <strong>of</strong> Fresnel scatter, i.e., scattering on single<br />
pronounced gradients in the electron number density that extent<br />
horizontally over several kilometers), whereas no signal<br />
dependence on the tilting angle is usually identified with<br />
isotropically oriented scattering structures as they would be<br />
expected in the case <strong>of</strong> three-dimensionally isotropic turbulence.<br />
Quantitatively, the aspect sensitivity is usually expressed<br />
as the half width, θ S , <strong>of</strong> the angular polar diagram <strong>of</strong> the<br />
backscatter (Hocking et al., 1986). Hence, large values <strong>of</strong> θ S<br />
imply a small aspect sensitivity and vice versa. Czechowsky<br />
et al. (1988) reported the first measurements <strong>of</strong> the aspect<br />
sensitivity <strong>of</strong> <strong>PMSE</strong> and found indeed a significant aspect<br />
sensitivity with θ s between 2 and 10 ◦ . Interestingly, the results<br />
<strong>of</strong> Czechowsky et al. (1988) show large aspect sensitivities<br />
(small θ s ) in the lower part <strong>of</strong> the <strong>PMSE</strong> layer coincident<br />
with rather small values <strong>of</strong> the observed spectral width and<br />
small aspect sensitivities (large θ s ) in the upper part <strong>of</strong> the<br />
Fig. 7. (a) Mean power (P V ) measured in the vertical beam direction<br />
for a two day period, (b) aspect sensitivity parameter (θ s ),<br />
and (c) mean spectral width for the vertical beam uncorrected (solid<br />
line) and corrected (dashed line) for beam broadening. This figure<br />
is reproduced from Czechowsky et al. (1988), copyright by the<br />
American Geophysical Union.<br />
layer together with a considerably larger spectral width (see<br />
Fig. 7). This morphology <strong>of</strong> aspect sensitivity and spectral<br />
width suggests that in the upper part <strong>of</strong> the <strong>PMSE</strong> the scatterers<br />
are more isotropic (‘turbulent’) whereas they appear to be<br />
strongly stratified (specular or ‘non-turbulent’) in the lower<br />
part <strong>of</strong> the layer. Czechowsky and Rüster (1997) report that<br />
in 90% <strong>of</strong> their observations <strong>PMSE</strong> appear to have narrow<br />
spectral width and strong aspect sensitivity, whereas in 10%<br />
<strong>of</strong> their measurements they found cells <strong>of</strong> enhanced turbulence<br />
characterized by extremely broad spectral width that<br />
appear predominantly in the upper part <strong>of</strong> the <strong>PMSE</strong>-region,<br />
i.e., above 86 km. Similar features were later confirmed by<br />
several independent investigators (e.g., Hoppe et al., 1990;<br />
Zecha et al., 2001, 2003; Chilson et al., 2002).<br />
2.4 Rocket borne observations<br />
Apart from the wealth <strong>of</strong> radar studies, <strong>PMSE</strong> have been investigated<br />
during several sounding rocket campaigns. In Table<br />
2 we state a list <strong>of</strong> the campaigns conducted to date together<br />
with suitable references. The most important results<br />
derived from these measurements are summarized below.<br />
2.4.1 Evidence for ice particles causing <strong>PMSE</strong><br />
While satellite measurements have recently proven that the<br />
particles forming NLC are indeed made <strong>of</strong> water ice (Hervig<br />
et al., 2001) a similar direct confirmation is missing so far for<br />
<strong>PMSE</strong>. However, very strong indirect evidence that <strong>PMSE</strong><br />
are created through the involvement <strong>of</strong> water ice particles<br />
comes from in situ temperature measurements during the simultaneous<br />
observation <strong>of</strong> <strong>PMSE</strong> and common volume observations<br />
<strong>of</strong> <strong>PMSE</strong> and NLC (see Sect. 2.5). Inhester et al.<br />
www.atmos-chem-phys.org/acp/4/2601/ Atmos. Chem. Phys., 4, 2601–2633, 2004
2608 M. Rapp and F. J. Lübken: Review <strong>of</strong> <strong>PMSE</strong><br />
Fig. 8. Temperature pr<strong>of</strong>iles measured within <strong>PMSE</strong> layers. Measurements<br />
by the falling sphere technique (solid lines) and by the<br />
TOTAL/CONE ionization gauges (dotted lines) are shown. The<br />
dotted-dashed line presents the frost point temperature pr<strong>of</strong>ile using<br />
the model H 2 O values from Körner and Sonnemann (2001). This<br />
figure is reproduced from Lübken et al. (2002), copyright by the<br />
American Geophysical Union.<br />
(1994) reported a first systematic comparison <strong>of</strong> 22 temperature<br />
pr<strong>of</strong>iles measured with so called falling spheres and<br />
radar observations <strong>of</strong> <strong>PMSE</strong> (see e.g. Schmidlin, 1991, for a<br />
detailed discussion <strong>of</strong> the falling sphere technique). Inhester<br />
et al. (1994) found that the <strong>PMSE</strong> occurred in exactly the altitude<br />
range where the temperatures allowed the ice particles to<br />
exist. Recently, Lübken et al. (2002) have provided an update<br />
<strong>of</strong> this data base and compared additional falling sphere temperature<br />
measurements and temperature measurements that<br />
were performed with active ionization gauges with simultaneously<br />
measured <strong>PMSE</strong> pr<strong>of</strong>iles. The significant advantage<br />
<strong>of</strong> the ionization gauge measurements is their much better<br />
altitude resolution which is only 200 m independent <strong>of</strong> altitude<br />
and their high accuracy <strong>of</strong> better than ∼2% (Rapp et al.,<br />
2001, 2002b). Hence, these measurements allow for a much<br />
more precise comparison <strong>of</strong> temperatures with <strong>PMSE</strong> since<br />
they also show the small scale structure <strong>of</strong> the temperature<br />
pr<strong>of</strong>ile like for example gravity wave induced local temperature<br />
minima or maxima. Such features cannot be resolved<br />
by the falling sphere technique since the typical altitude resolution<br />
<strong>of</strong> falling sphere measurements at <strong>PMSE</strong> altitudes<br />
is ∼5 km (Schmidlin, 1991). Figure 8 shows a comparison<br />
<strong>of</strong> these temperature measurements with the frost point<br />
temperature for water ice (calculated from the density climatology<br />
from Lübken, 1999, and water vapor mixing ratios<br />
from Körner and Sonnemann, 2001) in the altitude range<br />
where <strong>PMSE</strong> was observed during ±0.5 h around the rocket<br />
launch. (This time interval was chosen in order to account<br />
for potential horizontal differences in the <strong>PMSE</strong> characteristics<br />
between the location <strong>of</strong> the radar and the location <strong>of</strong> the<br />
temperature measurements at a typical horizontal distance <strong>of</strong><br />
∼50 km). Figure 8 shows that the majority <strong>of</strong> falling sphere<br />
temperatures and ionization gauge temperatures are lower<br />
than the frost point temperature, i.e., they allow for the existence<br />
<strong>of</strong> ice particles. There are only two remarkable ‘outliers’,<br />
i.e., the pr<strong>of</strong>iles from the falling sphere flight TRS06<br />
and the ionization gauge flight NBT05 where the temperatures<br />
reach rather large values <strong>of</strong> ∼160 K, which is approximately<br />
10 K above the frost point temperature. However, in<br />
both cases a closer inspection <strong>of</strong> the <strong>PMSE</strong> measured during<br />
these rocket flights showed in fact that the <strong>PMSE</strong> had disappeared<br />
a few minutes prior to the sounding rocket flights.<br />
This is a remarkable correlation between the appearance <strong>of</strong><br />
<strong>PMSE</strong> and the thermal structure and provides very strong evidence<br />
that <strong>PMSE</strong> are indeed directly linked to the existence<br />
<strong>of</strong> ice particles.<br />
2.4.2 Neutral air turbulence measurements<br />
As described above, the first attempts to explain <strong>PMSE</strong> also<br />
considered neutral air turbulence as a possible mechanism<br />
to create the fluctuations in the electron number density in<br />
one or the other way (see also Sect. 3), but this was soon<br />
contested and debated in view <strong>of</strong> the newer observations at<br />
even smaller wavenumbers with the EISCAT radars (Röttger<br />
et al., 1988; Hoppe et al., 1988).<br />
During the NLC91 campaign, Lübken et al. (1993b) performed<br />
the first direct measurements <strong>of</strong> the turbulent energy<br />
dissipation rate in a <strong>PMSE</strong> layer. They measured fluctuations<br />
<strong>of</strong> neutral air density as a conservative and passive tracer<br />
for neutral air turbulence (see Lübken, 1992, for details on<br />
this technique) and identified turbulent fluctuations only in<br />
the upper part <strong>of</strong> the altitude range where the CUPRI radar<br />
(CUPRI = Cornell University Portable Radar Interferometer,<br />
see Swartz et al., 1993) observed strong <strong>PMSE</strong> and concluded<br />
that processes different from neutral air turbulence<br />
must be responsible for the creation <strong>of</strong> at least the lower<br />
<strong>PMSE</strong> layer. These findings were further supported by different<br />
spectral shapes <strong>of</strong> electron irregularities in the upper and<br />
lower part <strong>of</strong> the <strong>PMSE</strong> as well as different spectral width<br />
<strong>of</strong> the radar signals in the two altitude parts (Ulwick et al.,<br />
1993; Cho et al., 1993).<br />
Since these first observations <strong>of</strong> neutral air turbulence in<br />
the vicinity <strong>of</strong> <strong>PMSE</strong>, 12 additional rocket borne turbulence<br />
measurements at <strong>PMSE</strong> altitudes have been performed (2<br />
Atmos. Chem. Phys., 4, 2601–2633, 2004<br />
www.atmos-chem-phys.org/acp/4/2601/
M. Rapp and F. J. Lübken: Review <strong>of</strong> <strong>PMSE</strong> 2609<br />
Fig. 10. Occurrence rates <strong>of</strong> <strong>PMSE</strong> (solid line) and neutral air turbulence<br />
(histogram and dashed line) according to Rapp and Lübken<br />
(2003a).<br />
Fig. 9. Comparison <strong>of</strong> turbulent energy dissipation rates ɛ (color<br />
coded) and the <strong>PMSE</strong> intensity for 8 sounding rocket flights. This<br />
figure is reproduced from Lübken et al. (2002), copyright by the<br />
American Geophysical Union.<br />
during the NLC91 campaign, 2 during the SCALE campaign,<br />
3 during the ECHO campaign, 1 during the DROPPS<br />
campaign, 2 during the SOLSTICE campaign and 3 during<br />
the MIDAS/MACWAVE campaign; see Table 2). The results<br />
from the first 8 launches were summarized by Lübken<br />
et al. (2002). The turbulence measurements during the SOL-<br />
STICE campaign are reported in Müllemann et al. (2003)<br />
and results from the three sounding rocket flights during the<br />
MIDAS/MACWAVE campaign have just recently been published<br />
in Strelnikov et al. (2003) and Rapp et al. (2004), respectively.<br />
Individual comparisons <strong>of</strong> <strong>PMSE</strong> observations<br />
and turbulence measurements are shown in Fig. 9. It is evident<br />
from this figure that there is clearly no one to one correlation<br />
between the occurrence <strong>of</strong> turbulence and the occurrence<br />
<strong>of</strong> <strong>PMSE</strong>. Lübken et al. (2002) performed a statistical<br />
analysis <strong>of</strong> these data and found that in more than 50% <strong>of</strong> all<br />
altitude bins where <strong>PMSE</strong> was observed there was no neutral<br />
air turbulence present. If, however, turbulence and <strong>PMSE</strong><br />
occurred at the same altitudes it regularly only happened in<br />
the upper portion <strong>of</strong> the <strong>PMSE</strong> layer (i.e., in flight NBT05,<br />
SCT06, ECT02, ECT07, MDMI05; it is worth noting here<br />
that this is also consistent with radar observations showing<br />
enhanced spectral widths predominantly in the upper altitude<br />
range <strong>of</strong> the <strong>PMSE</strong> layers; see for example Czechowsky<br />
et al.,1988). In addition, it must be noted that turbulence was<br />
<strong>of</strong>ten observed at altitudes where no <strong>PMSE</strong> was present, i.e.,<br />
normally above the <strong>PMSE</strong> layer and in two cases (NBT05,<br />
ECT12) also below the <strong>PMSE</strong> layer. The more recent observations<br />
by Müllemann et al. (2003), Strelnikov et al. (2003),<br />
and Rapp et al. (2004) confirm this general picture <strong>of</strong> the<br />
morphology <strong>of</strong> turbulence and <strong>PMSE</strong>.<br />
To summarize, in Fig. 10 we compare the occurrence rate<br />
<strong>of</strong> <strong>PMSE</strong> with the occurrence rate <strong>of</strong> neutral air turbulence<br />
as determined from the sounding rocket flights mentioned<br />
above (see Rapp and Lübken, 2003a, for details how these<br />
occurrence rates were determined). Figure 10 shows that in<br />
a climatological sense neutral air turbulence indeed occurs in<br />
the entire altitude range where <strong>PMSE</strong> is observed. At altitudes<br />
above ∼86 km the turbulence occurrence rate is even<br />
larger than the <strong>PMSE</strong> occurrence rate. At lower altitudes,<br />
however, the <strong>PMSE</strong> occurrence rate is significantly larger<br />
than the turbulence occurrence rate, for example at 85 km<br />
<strong>PMSE</strong> occur with a rate <strong>of</strong> ∼65% whereas turbulence only<br />
occurs with a rate <strong>of</strong> ∼35%. Hence, at the lower altitudes in<br />
the <strong>PMSE</strong> altitude range, neutral air turbulence can clearly<br />
not directly account for the occurrence <strong>of</strong> <strong>PMSE</strong>.<br />
2.4.3 Electron biteouts and small scale plasma structures<br />
One <strong>of</strong> the most prominent features <strong>of</strong> the <strong>PMSE</strong> environment<br />
is the fact that the electron number density appears to be<br />
frequently disturbed in the altitude region <strong>of</strong> the radar <strong>echoes</strong>.<br />
Figure 11 shows one <strong>of</strong> the earliest observations from the<br />
www.atmos-chem-phys.org/acp/4/2601/ Atmos. Chem. Phys., 4, 2601–2633, 2004
2610 M. Rapp and F. J. Lübken: Review <strong>of</strong> <strong>PMSE</strong><br />
Table 2. Sounding rocket campaigns dedicated to the study <strong>of</strong> <strong>PMSE</strong>.<br />
Campaign Location Date Reference<br />
STATE Poker Flat, Alaska June 1983 Ulwick et al. (1988)<br />
MAC/SINE Andøya, Norway July 1987 Inhester et al. (1990)<br />
NLC91 Kiruna, Sweden July/August 1991 Goldberg et al. (1993)<br />
SCALE Andøya, Norway July/August 1993 Blix (1999)<br />
ECHO Andøya, Norway July/August 1994 Havnes et al. (1996b)<br />
DROPPS Andøya, Norway July 1999 Goldberg et al. (2001)<br />
SOLSTICE Andøya, Norway June 2001 Smiley et al. (2003)<br />
MIDAS/MACWAVE Andøya, Norway July 2002 Blix et al. (2003a)<br />
since the STATE observations, similar depletions <strong>of</strong> the electron<br />
number density, also called ‘biteouts’, were observed<br />
in almost all rocket borne electron number density measurements<br />
in the vicinity <strong>of</strong> <strong>PMSE</strong> (see Table 2 for suitable references)<br />
and could also be detected with incoherent scatter<br />
radars in the UHF wavelength range (Röttger et al., 1990).<br />
Hence, they must be considered as a typical feature <strong>of</strong> the<br />
<strong>PMSE</strong> environment. In Sect. 3 we address our understanding<br />
<strong>of</strong> this feature in detail and show that the electron biteouts are<br />
direct evidence for the presence <strong>of</strong> charged ice aerosol particles<br />
at <strong>PMSE</strong> altitudes. Note also that such biteouts were<br />
observed much earlier than <strong>PMSE</strong> itself (e.g., Pedersen et al.,<br />
1969) – see Lübken and Rapp (2001) and Friedrich et al.<br />
(1994) for overviews <strong>of</strong> plasma measurements in the high<br />
latitude <strong>summer</strong> mesopause region.<br />
Fig. 11. Height pr<strong>of</strong>iles <strong>of</strong> rocket borne DC probe measurements<br />
<strong>of</strong> the electron number density (solid line) and VHF radar <strong>echoes</strong><br />
(solid circles) for the STATE-3 rocket flight conducted on 17 June<br />
1983 from Poker Flat, Alaska. The dashed line illustrates a more<br />
typical D-region electron number density. This figure is reproduced<br />
from Ulwick et al. (1988), copyright by the American Geophysical<br />
Union.<br />
STATE campaign in 1983 (Ulwick et al., 1988). Figure 11<br />
shows that the electron number density is depleted by as<br />
much as a factor <strong>of</strong> ten in the altitude region where strong<br />
<strong>echoes</strong> were observed from the Poker Flat VHF radar. Ever<br />
Apart from this large scale characteristics <strong>of</strong> the electron<br />
number density in the <strong>PMSE</strong> altitude range, Ulwick<br />
et al. (1988) further showed that the observed radar <strong>echoes</strong><br />
are quantitatively characterized by the structure <strong>of</strong> the electron<br />
pr<strong>of</strong>ile at the radar Bragg scale: following the work <strong>of</strong><br />
Røyrvik and Smith (1984) (who made similar rocket measurements<br />
in order to explain VHF <strong>echoes</strong> at ∼70 km altitude<br />
observed at Jicarmarca, Peru, 11.95 ◦ S) they directly computed<br />
the radar signal to noise ratio from the power spectral<br />
density <strong>of</strong> the measured electron number density irregularities<br />
at the Bragg scale and found a very good quantitative<br />
agreement. These results were later confirmed by several independent<br />
investigators (Inhester et al., 1990; Lübken et al.,<br />
1993b; Blix et al., 2003c) and hence showed that the characteristics<br />
<strong>of</strong> <strong>PMSE</strong> observations are consistent with the assumption<br />
<strong>of</strong> volume scatter from electron number density irregularities<br />
and can not be due to specular reflections from<br />
single steep gradients as they appear for example at the edges<br />
<strong>of</strong> the electron biteouts (see also Hocking and Röttger, 1997,<br />
for a discussion <strong>of</strong> the feasibility <strong>of</strong> specular reflection to explain<br />
<strong>PMSE</strong>). Still, it must be noted that the aspect sensitivity<br />
<strong>of</strong> <strong>PMSE</strong> shows that the scattering structures can not be<br />
purely isotropic. See Sect. 2.3.3 for a more detailed discussion<br />
<strong>of</strong> this particular point.<br />
Atmos. Chem. Phys., 4, 2601–2633, 2004<br />
www.atmos-chem-phys.org/acp/4/2601/
M. Rapp and F. J. Lübken: Review <strong>of</strong> <strong>PMSE</strong> 2611<br />
Fig. 12. Left panel: Pr<strong>of</strong>ile <strong>of</strong> the radar signal to noise ratio (SNR)<br />
measured with the ALOMAR-SOUSY VHF radar during sounding<br />
rocket flight ECT02. Right panel: pr<strong>of</strong>iles <strong>of</strong> electron number<br />
densities (black line) and aerosol charge number densities (red<br />
line) measured during sounding rocket flight ECT02. These data<br />
are taken from Havnes et al. (1996b) and Lübken et al. (1998).<br />
Fig. 13. Scatter plot showing the dependence <strong>of</strong> the <strong>PMSE</strong> SNR<br />
values on the electron number densities at 87 km during the major<br />
solar proton event on 14 July 2000. While no correlation is<br />
detectable for electron number densities lower than ∼7·10 4 /cm 3 a<br />
clear anti-correlation is observed for higher electron number densities.<br />
This figure is reproduced from Rapp et al. (2002a), copyright<br />
by the American Geophysical Union.<br />
2.4.4 Observation <strong>of</strong> charged ice particles<br />
While the observation <strong>of</strong> electron biteouts, the occurrence <strong>of</strong><br />
<strong>PMSE</strong> in the vicinity <strong>of</strong> noctilucent clouds (see Sect. 2.5),<br />
and the tight coupling <strong>of</strong> the seasonal dependence <strong>of</strong> <strong>PMSE</strong><br />
and NLC occurrence provided strong evidence that <strong>PMSE</strong><br />
are closely related to aerosol particles, the first direct in situ<br />
measurement <strong>of</strong> (charged) ice particles 1 in an <strong>PMSE</strong> environment<br />
must be considered as one <strong>of</strong> the major steps towards an<br />
understanding <strong>of</strong> <strong>PMSE</strong>. The pioneering work was done by<br />
Havnes et al. (1996b) who applied a Faraday-cup-like instrument<br />
(the ‘DUSTY’-detector) to measure the charge number<br />
density associated with the particles. Figure 12 shows<br />
the first altitude pr<strong>of</strong>ile <strong>of</strong> charged aerosol particles measured<br />
during the ECHO sounding rocket campaign from the Norwegian<br />
Andøya Rocket Range on 28 July 1994. Havnes<br />
et al. (1996b) observed negatively charged particles in two<br />
distinct layers, one centered at 87.5 km and the other centered<br />
at 85.5 km altitude. Most interestingly, the measurement<br />
<strong>of</strong> the number density <strong>of</strong> free electrons made on the<br />
same sounding rocket revealed two distinct electron biteouts<br />
exactly at the same altitudes indicating that biteouts form because<br />
the aerosol particles act as an efficient sink for electrons<br />
(and hence acquire a net negative charge; see Sect. 3).<br />
During the same campaign, Havnes et al. (1996b) also observed<br />
a layer <strong>of</strong> positively charged aerosol particles collocated<br />
with an electron enhancement (instead <strong>of</strong> the more<br />
common biteout) in the altitude range where a noctilucent<br />
1 Note that we distinguish between particles and large cluster<br />
ions: while the largest cluster ions reported from measurements in<br />
the <strong>mesosphere</strong> so far had masses <strong>of</strong> less than a couple <strong>of</strong> hundred<br />
amu, particles are considered to be more massive than several thousand<br />
amu.<br />
cloud was observed by a ground based lidar. These measurements<br />
are however much more difficult to explain than the<br />
observations <strong>of</strong> negatively charged particles. In subsequent<br />
campaigns, several investigations have provided further evidence<br />
for the existence <strong>of</strong> negatively charged aerosol particles<br />
in <strong>PMSE</strong> (Havnes et al., 2001; Mitchell et al., 2001,<br />
2003; Smiley et al., 2003). Concerning positively charged<br />
particles there seem to be further indications that they do exist<br />
(Mitchell et al., 2001, 2003; Smiley et al., 2003), however,<br />
our current understanding <strong>of</strong> these measurements is far from<br />
being conclusive.<br />
2.4.5 The charge balance at <strong>PMSE</strong> altitudes<br />
As seen in the previous section, the plasma environment <strong>of</strong><br />
<strong>PMSE</strong> is characterized by the presence <strong>of</strong> electrons, positive<br />
ions and charged particles. In the theoretical treatment <strong>of</strong><br />
<strong>PMSE</strong> (see Sect. 3 below) it was suggested that the relative<br />
abundance <strong>of</strong> these different species is a critical parameter.<br />
Following the work by Cho et al. (1992), this relative abundance<br />
is typically quantified by the ratio between the charge<br />
number density <strong>of</strong> the aerosol particles (|Z A |N A ) and the free<br />
electron number density (N e ) and several authors claimed<br />
that this ratio should be larger than ∼1 for <strong>PMSE</strong> to occur<br />
(i.e., the charge balance should be dominated by the abundance<br />
<strong>of</strong> charged aerosol particles, see e.g., Cho et al., 1992;<br />
Hagfors, 1992).<br />
First doubts if this condition is indeed satisfied under real<br />
<strong>PMSE</strong> conditions arose when Havnes et al. (2001) reported<br />
measurements <strong>of</strong> the aerosol charge number density and the<br />
electron number density from a miniaturized sounding rocket<br />
launched into a <strong>PMSE</strong> event. These measurements showed<br />
www.atmos-chem-phys.org/acp/4/2601/ Atmos. Chem. Phys., 4, 2601–2633, 2004
2612 M. Rapp and F. J. Lübken: Review <strong>of</strong> <strong>PMSE</strong><br />
Fig. 14. Left panel: Comparison <strong>of</strong> radar power in dB and electron<br />
number density fluctuations in % at 3 m scale measured on both<br />
upleg and downleg <strong>of</strong> the ECT02 flight. Right panel: Calculated<br />
ratio between aerosol charge number density (|Z A |N A ) and electron<br />
density (N e ) for the upleg part <strong>of</strong> the ECT02 flight. The red vertical<br />
red lines mark ratios <strong>of</strong> |Z A |N A /N e =1. This figure is reproduced<br />
from Blix et al. (2003c), copyright by the American Geophysical<br />
Union.<br />
a nice correspondence between the general occurrence <strong>of</strong><br />
charged particles and <strong>PMSE</strong>, however, Havnes et al. (2001)<br />
also noted that <strong>PMSE</strong> occurred in altitude regions where the<br />
ratio |Z A |N A /N e was as small as 0.05.<br />
In a completely different study, Rapp et al. (2002a) investigated<br />
the <strong>PMSE</strong> dependence on the background electron<br />
number density during the strong solar proton event on 14<br />
July 2000. These authors found a significant negative correlation<br />
between electron number densities determined from<br />
flux measurements <strong>of</strong> energetic protons from the geostationary<br />
GOES-8 and ACE satellites and <strong>PMSE</strong> observed with<br />
the ALWIN VHF radar at the Andøya Rocket Range (69 ◦ N)<br />
for electron number densities larger than a threshold value<br />
<strong>of</strong> ∼7·10 5 /cm 3 (see Fig. 13). Rapp et al. (2002a) argued<br />
that the overall decay <strong>of</strong> the <strong>PMSE</strong> during a significant rise<br />
<strong>of</strong> the background ionization was expected on the ground<br />
<strong>of</strong> the Cho et al. (1992) theory since a rise in N e would<br />
correspond to a decrease in |Z A |N A /N e such that at a certain<br />
threshold value the electron diffusivity should not be<br />
reduced any more. However, these authors were also puzzled<br />
by the fact that the <strong>PMSE</strong> was unaffected for a very<br />
wide range <strong>of</strong> electron number densities, i.e., between some<br />
10 3 electrons/cm 3 up to ∼7·10 5 /cm 3 and pointed out that<br />
current knowledge about the abundance <strong>of</strong> aerosol particles<br />
at mesopause altitudes and their charging properties could<br />
not explain that |Z A |N A /N e remained larger than ∼1 for all<br />
these electron number densities. Rapp et al. (2002a) concluded<br />
that ‘. . .either our current understanding <strong>of</strong> the nucleation<br />
<strong>of</strong> ice particles in the polar <strong>summer</strong> mesopause region<br />
is incomplete or that current <strong>PMSE</strong> theories (i.e., the Cho<br />
et al., 1992-theory) fail in their interpretation <strong>of</strong> the role <strong>of</strong><br />
charged aerosol particles’.<br />
Motivated by these observations, Blix et al. (2003c) performed<br />
a detailed comparison <strong>of</strong> |Z A |N A /N e and <strong>PMSE</strong> pr<strong>of</strong>iles.<br />
These authors derived |Z A |N A /N e from in situ measurements<br />
<strong>of</strong> either positive ion and electron number densities<br />
(making use <strong>of</strong> the assumption <strong>of</strong> local charge neutrality,<br />
i.e., the assumption that the sum <strong>of</strong> all charges over<br />
length scales significantly larger than the Debye-length <strong>of</strong><br />
the plasma is zero) or directly from aerosol charge number<br />
densities and electron number densities. As an example,<br />
Fig. 14 shows the comparison <strong>of</strong> the |Z A |N A /N e - and<br />
<strong>PMSE</strong> pr<strong>of</strong>ile as measured on sounding rocket ECT02 during<br />
the ECHO campaign (see Table 2). The comparison <strong>of</strong><br />
electron number density fluctuations at the Bragg scale (3 m)<br />
and the power received by the ALWIN radar shown in the left<br />
panel <strong>of</strong> Fig. 14 showed that the radar <strong>echoes</strong> were indeed<br />
due to the small scale structure <strong>of</strong> the electron number density<br />
as expected. (Technically speaking, this consistency also<br />
proves that the sounding rocket indeed probed the <strong>PMSE</strong> observed<br />
with the ground based VHF radar.) The comparison<br />
<strong>of</strong> |Z A |N A /N e -values within the <strong>PMSE</strong> layer shown in the<br />
right panel, however, showed that |Z A |N A /N e was smaller<br />
than 1 in almost the entire altitude range where <strong>PMSE</strong> (and<br />
strong fluctuations in the electron number density) were observed.<br />
Blix et al. (2003c) considered a total <strong>of</strong> four sounding<br />
rocket flights and found that only in 15% <strong>of</strong> all altitude bins<br />
with <strong>PMSE</strong> |Z A |N A /N e -values larger than 1 were observed<br />
and that even in ∼75% <strong>of</strong> all altitude bins |Z A |N A /N e was<br />
smaller than 0.5.<br />
Taken together, these observations showed that the plasma<br />
environment <strong>of</strong> <strong>PMSE</strong> does not need to be dominated by the<br />
concentration <strong>of</strong> charged aerosol particles, though the presence<br />
<strong>of</strong> these charged particles is indeed a necessary condition<br />
for the existence <strong>of</strong> the radar <strong>echoes</strong>.<br />
2.4.6 Electric field measurements in <strong>PMSE</strong><br />
Electric field measurements in <strong>PMSE</strong> layers have proven to<br />
be extremely difficult to perform because <strong>of</strong> the severe interaction<br />
<strong>of</strong> the charged aerosol particles with the supersonically<br />
moving sounding rocket payload. Zadorozhny et al.<br />
(1993) reported strong electric fields on the order <strong>of</strong> ∼1 V/m<br />
in a <strong>PMSE</strong> layer, however, based on laboratory investigations<br />
on the impact <strong>of</strong> supersonic water clusters on their electric<br />
field mill, they later published corrections with values <strong>of</strong><br />
about the same order <strong>of</strong> magnitude (Zadorozhny et al., 1997).<br />
In a more recent investigation, Holzworth et al. (2001), applying<br />
a different technique, also found strong V/m perturbations<br />
at <strong>PMSE</strong> altitudes. However, Holzworth et al. (2001)<br />
also showed that these signatures were artificially created by<br />
payload/charged particle flow interactions during the traverse<br />
<strong>of</strong> the <strong>PMSE</strong> layer and concluded that if there was any DCelectric<br />
field, it was smaller than just a few ten mV/m. Pfaff<br />
et al. (2001) analyzed the same data set for small scale irregularities<br />
and identified small scale structures with amplitudes<br />
<strong>of</strong> ∼10 mV/m that they claimed were not artificially created<br />
but geophysical. In summary, electric field measurements<br />
conducted to date do not yield a conclusive picture such that<br />
Atmos. Chem. Phys., 4, 2601–2633, 2004<br />
www.atmos-chem-phys.org/acp/4/2601/
M. Rapp and F. J. Lübken: Review <strong>of</strong> <strong>PMSE</strong> 2613<br />
Fig. 15. Radar signal to noise ratio (SNR, colored contours) detected<br />
with the ALOMAR SOUSY radar as a function <strong>of</strong> altitude<br />
and time. The black isolines mark the noctilucent cloud detected<br />
by the ALOMAR RMR lidar. This figure is reproduced from<br />
Nussbaumer et al. (1996), copyright by the American Geophysical<br />
Union.<br />
further experimental efforts are needed to obtain quantitative<br />
results on the strength <strong>of</strong> large and small scale electric fields<br />
at <strong>PMSE</strong> altitudes.<br />
2.5 Common volume observations with NLCs<br />
Also common volume observations <strong>of</strong> noctilucent clouds and<br />
<strong>PMSE</strong> confirmed the close relationship between the radar<br />
<strong>echoes</strong> and ice particles in the mesopause region. Nussbaumer<br />
et al. (1996) presented the first common volume observation<br />
<strong>of</strong> a noctilucent cloud with the ALOMAR RMRlidar<br />
and a <strong>PMSE</strong> with the ALOMAR SOUSY radar at the<br />
Andøya Rocket Range (von Zahn et al., 2000; Singer et al.,<br />
1995). As shown in Fig. 15, these authors found a close relationship<br />
between the two phenomena with the NLC layer<br />
located at the lower edge <strong>of</strong> the <strong>PMSE</strong> layer in most <strong>of</strong> the<br />
cases. von Zahn and Bremer (1999) significantly expanded<br />
the data base presented in this first study by analyzing a total<br />
<strong>of</strong> 22 joint NLC/<strong>PMSE</strong> observations and basically confirmed<br />
the close relationship between NLC and <strong>PMSE</strong>. Altogether,<br />
they identified three distinct empirical types <strong>of</strong> <strong>PMSE</strong>/NLC<br />
observations: in the standard case (= type 1; in 66% <strong>of</strong> all<br />
observations), NLC and <strong>PMSE</strong> occurred simultaneously in<br />
the same volume, with the NLC layer located in the lower<br />
part <strong>of</strong> the <strong>PMSE</strong> layer and with identical lower edges. Type<br />
2 allowed for temporal differences between the layers, i.e.,<br />
at times there were NLC present but no <strong>PMSE</strong> (in 16% <strong>of</strong><br />
all observations), and type 3 allowed for spatial differences<br />
between the layers, i.e., at times the NLC was not located<br />
at the lower edge <strong>of</strong> the <strong>PMSE</strong> (in 21% <strong>of</strong> all observations).<br />
The close coupling <strong>of</strong> NLC and <strong>PMSE</strong> is further strong evidence<br />
that ice particles play a substantial role for the creation<br />
<strong>of</strong> the radar <strong>echoes</strong>. In particular, the frequent occurrence <strong>of</strong><br />
type 1 observations leads to the conclusion that NLC are evidence<br />
<strong>of</strong> the particles that have grown large enough to be<br />
visually observable whereas <strong>PMSE</strong> are related to both large<br />
Fig. 16. Upper panel: <strong>PMSE</strong> observed with the EISCAT VHF radar<br />
at Tromsø on 10 July 1999. The lower bar code indicates when the<br />
heater was turned on (blue) and <strong>of</strong>f (white), respectively. This figure<br />
is reproduced from Chilson et al. (2000), copyright by the American<br />
Geophysical Union.<br />
(i.e., when they coincide with NLC) but also the smaller ice<br />
particles that are not yet visually observable. These conclusions<br />
are in line with the standard growth and sedimentation<br />
scenario <strong>of</strong> mesospheric ice particles. In this scenario it is<br />
considered that the ice particles nucleate at the altitude with<br />
largest supersaturation (i.e., close to the mesopause) and then<br />
grow by further condensation <strong>of</strong> water vapor onto their surface.<br />
Then the particles sediment down due to gravity, and<br />
gain further size until they are large enough to be visually<br />
observed as NLC (see also Turco et al., 1982, and Sect. 3.1).<br />
2.6 Active modulation <strong>of</strong> <strong>PMSE</strong>: the heating experiments<br />
Recently, Chilson et al. (2000) have opened a new experimental<br />
‘window’ for the study <strong>of</strong> <strong>PMSE</strong>: these authors used<br />
a powerful HF heater in order to modify the electron temperature<br />
at altitudes where <strong>PMSE</strong> was simultaneously observed<br />
with the EISCAT VHF radar to temperatures <strong>of</strong> ∼3000 K<br />
(Belova et al., 2001). Stunningly, the <strong>PMSE</strong> immediately<br />
disappeared when the electron gas was heated and immediately<br />
reappeared when the heater was switched <strong>of</strong>f (see<br />
Fig. 16).<br />
While Chilson et al. (2000) used a rather short cycling <strong>of</strong><br />
heater ‘on’ and ‘<strong>of</strong>f’ phases, Havnes et al. (2003) applied a<br />
different heating sequence with a short heating period followed<br />
by a long heater ‘<strong>of</strong>f’ phase. As shown in Fig. 17,<br />
these authors observed a strengthening <strong>of</strong> the <strong>PMSE</strong> after the<br />
www.atmos-chem-phys.org/acp/4/2601/ Atmos. Chem. Phys., 4, 2601–2633, 2004
2614 M. Rapp and F. J. Lübken: Review <strong>of</strong> <strong>PMSE</strong><br />
Fig. 17. String <strong>of</strong> four <strong>PMSE</strong> ‘overshoots’ in a 12-min interval<br />
on 2 July 2003. The bottom figure shows the raw data observed<br />
with the EISCAT VHF radar, while the top figure shows the same<br />
data but smoothed. The middle figure shows the sum <strong>of</strong> the three<br />
highest intensities at each time sample and is a measure <strong>of</strong> the total<br />
<strong>PMSE</strong> intensity as a function <strong>of</strong> time. The vertical lines indicate the<br />
periods when the heater was switched on. This figure is reproduced<br />
from Havnes et al. (2003), copyright by the American Geophysical<br />
Union.<br />
Fig. 18. Time-altitude dependence <strong>of</strong> water vapor mixing ratio, saturation<br />
ratio, total ice number density and mean ice radius during<br />
the formation and growth <strong>of</strong> a noctilucent cloud. The black isolines<br />
overlayed on each plot show lines <strong>of</strong> constant backscatter ratio as<br />
it would be observed by a lidar with a laser wavelength <strong>of</strong> 532 nm<br />
(after Rapp et al., 2002b, copyright by the American Geophysical<br />
Union).<br />
initial reduction during the periods <strong>of</strong> enhanced electron temperatures.<br />
Both effects, the weakening <strong>of</strong> the <strong>PMSE</strong> at times <strong>of</strong> enhanced<br />
electron temperatures and the strengthening if a long<br />
recovery time during two heater ‘on’ phases is allowed for,<br />
have been convincingly explained in the meantime. For a<br />
detailed description <strong>of</strong> the theoretical understanding <strong>of</strong> both<br />
effects see Sect. 3.3.3.<br />
3 Physical mechanisms<br />
3.1 Ice particles in the polar <strong>summer</strong> mesopause<br />
As repeatedly mentioned above, there is compelling evidence<br />
that the presence <strong>of</strong> ice particles is a major prerequisite for<br />
the existence <strong>of</strong> <strong>PMSE</strong>. Thus we start our <strong>review</strong> <strong>of</strong> the current<br />
understanding <strong>of</strong> <strong>PMSE</strong> with a short description <strong>of</strong> the<br />
general microphysical life cycle <strong>of</strong> ice particles in the vicinity<br />
<strong>of</strong> the polar <strong>summer</strong> mesopause.<br />
Starting with the comprehensive pioneering work by Turco<br />
et al. (1982) microphysical models <strong>of</strong> the generation and<br />
growth <strong>of</strong> mesospheric aerosol particles have been a major<br />
tool for identifying the relevant physical processes. After this<br />
initial study, similar microphysical models were successfully<br />
applied to the interpretation <strong>of</strong> satellite borne observations<br />
<strong>of</strong> polar mesospheric clouds (PMC = NLC observed from<br />
space) with the SME satellite (Jensen and Thomas, 1988;<br />
Jensen et al., 1989; Jensen and Thomas, 1994) and to the<br />
interpretation <strong>of</strong> combined rocket borne and ground based<br />
measurements <strong>of</strong> relevant parameters like the local thermal<br />
and dynamical structure and the brightness <strong>of</strong> the ice particles<br />
when being probed by a lidar (Rapp et al., 2002b).<br />
These models treated three completely interactive constituents:<br />
meteoric smoke particles which act as the condensation<br />
nuclei <strong>of</strong> the ice particles, ice particles, and mesospheric<br />
water vapor. The height pr<strong>of</strong>ile and the size distribution<br />
<strong>of</strong> meteoric smoke particles were calculated as described<br />
in Hunten et al. (1980). For the ice particles, microphysical<br />
processes like nucleation, condensational growth, and coagulation<br />
were treated, as well as particle sedimentation and<br />
transport. Figure 18 shows the results <strong>of</strong> such a microphysical<br />
model simulation taken from the work by Rapp et al.<br />
(2002b). Figure 18 reveals the picture <strong>of</strong> the well known<br />
growth and sedimentation scenario <strong>of</strong> mesospheric ice particles.<br />
Ice particle nucleation on meteoric smoke particles<br />
takes place at the altitudes with the lowest temperatures and<br />
hence largest saturation ratios S (= ratio between water vapor<br />
partial pressure and saturation pressure over water ice), i.e.,<br />
between 84 and 90 km altitude yielding ice particle number<br />
densities close to ∼10 3 cm −3 . The particles then sediment<br />
down due to their gravity and further grow by direct condensation<br />
<strong>of</strong> water vapor onto their surface reaching maximum<br />
mean particle radii between 40 and 50 nm. The potential optical<br />
signature <strong>of</strong> these ice particles is indicated by the black<br />
isolines which show values <strong>of</strong> the backscatter ratio BSR that<br />
Atmos. Chem. Phys., 4, 2601–2633, 2004<br />
www.atmos-chem-phys.org/acp/4/2601/
M. Rapp and F. J. Lübken: Review <strong>of</strong> <strong>PMSE</strong> 2615<br />
would be observed by a lidar at 532 nm wavelength (BSR<br />
= total received signal at a certain altitude divided by the<br />
signal due to pure molecular Rayleigh scattering. BSR>1<br />
when Mie scattering due to ice particles enhances the scatter<br />
significantly over the Rayleigh background). The maximum<br />
brightness is reached at altitudes <strong>of</strong> ∼81.5 km with<br />
corresponding particle radii <strong>of</strong> ∼40 nm and number densities<br />
<strong>of</strong> 50–100 cm −3 . These numbers are generally consistent<br />
with values derived from multi-color lidar observations<br />
by von Cossart et al. (1999). Figure 18a further shows that<br />
the formation and growth <strong>of</strong> the ice particles leads to significant<br />
redistribution <strong>of</strong> water vapor due to the freeze drying<br />
effect (because the ice particles ‘consume’ the available water<br />
vapor when they grow) and subsequent deposition <strong>of</strong> the<br />
ice contained water vapor at the bottom <strong>of</strong> the cloud. Note<br />
that recent satellite water vapor measurements indeed find<br />
evidence for this local water vapor maximum at the cloud<br />
bottom height (e.g., Summers et al., 2001; McHugh et al.,<br />
2003).<br />
Besides these studies that aimed at understanding the general<br />
microphysics, progress has also been made in the modeling<br />
<strong>of</strong> large scale and even global structures <strong>of</strong> these ice<br />
clouds. In particular, Berger and von Zahn (2002) and von<br />
Zahn and Berger (2003) have recently presented the first<br />
model study <strong>of</strong> global features <strong>of</strong> the mesospheric ice particle<br />
population by combining a microphysical ice particle<br />
model with a 3-dimensional general circulation model <strong>of</strong> the<br />
middle atmosphere.<br />
3.2 Aerosol charging<br />
As seen in Sect. 2.4.4, mesospheric ice particles modify the<br />
charge balance <strong>of</strong> the ionospheric D-region plasma. This is<br />
particularly evident from the observations <strong>of</strong> strong depletions<br />
in the electron number density at <strong>PMSE</strong> altitudes which<br />
show that the aerosol particles act as a sink for the electrons<br />
and hence become negatively charged. Reid (1990) was the<br />
first to consider this process quantitatively: based on the electron<br />
and positive ion capture rates due to Natanson (1960)<br />
he studied the concentration <strong>of</strong> singly and doubly charged<br />
ice particles and the feedback <strong>of</strong> their charging on the background<br />
electron and positive ion number density as a function<br />
<strong>of</strong> the number density <strong>of</strong> available ice particles. Keeping also<br />
the ice-equivalent water vapor content inside reasonable limits,<br />
Reid (1990) concluded that several thousand ice particles<br />
per cubic-centimeter with a radius <strong>of</strong> ∼10 nm were the most<br />
likely candidate to explain the observed biteouts in the free<br />
electron number density. Consequently, most <strong>of</strong> the ice particles<br />
should be singly negatively charged. The drawback <strong>of</strong><br />
this study, however, was its restriction to singly and doubly<br />
charged particles such that Jensen and Thomas (1991) developed<br />
this model further by allowing for an arbitrary negative<br />
particle charge and derived the statistical charge distribution<br />
as a function <strong>of</strong> particle radius for standard background conditions<br />
<strong>of</strong> the D-region (production rate <strong>of</strong> electrons and pos-<br />
Fig. 19. Relative disturbance <strong>of</strong> electron (blue lines) and positive<br />
ion number density (green and red lines), n e and n i in percent,<br />
as a function <strong>of</strong> the particle radius, r A , and number density, N A . The<br />
calculations have been perfomed for an electron/ion production rate<br />
Q=10/(cm 3 s) and a recombination coefficient α=10 −6 cm 3 /s (Rapp<br />
and Lübken, 2001).<br />
itive ions Q=10 7 m −3 s −1 and electron-positive ion recombination<br />
rate α=10 −12 m 3 s −1 , corresponding to an undisturbed<br />
plasma density <strong>of</strong> √ Q/α≈3·10 9 m −3 which is a reasonable<br />
value for the polar D-region; Friedrich and Torkar, 2001).<br />
Jensen and Thomas (1991) found an average aerosol charge<br />
<strong>of</strong> -1e for particles with radii between 1 and 10 nm, and then<br />
a linear increase <strong>of</strong> the aerosol charge, i.e., ∼−2e for 30 nm<br />
particles and −3e for particles with a radius <strong>of</strong> 50 nm (with e<br />
being the elementary charge). These results were then further<br />
generalized by Rapp and Lübken (2001) who also systematically<br />
considered the dependence <strong>of</strong> the aerosol charge on the<br />
background plasma conditions and studied the expected response<br />
not only <strong>of</strong> the electron number density but also the<br />
positive ion number density. Figure 19 shows the change<br />
<strong>of</strong> the electron and positive ion number density relative to<br />
a background where no particles are present as a function <strong>of</strong><br />
both particle number density N A and particle radius r A . Rapp<br />
and Lübken (2001) pointed out that the ice particles leave a<br />
characteristic ‘fingerprint’ in the plasma if the effect on both<br />
electrons and ions is considered: while the electron number<br />
density is expected to be depleted for all aerosol particle parameters<br />
considered, the positive ion number density can be<br />
either depleted (when being controlled by the capture on the<br />
ice particles) or even enhanced (when being controlled by<br />
the recombination with electrons). Hence, Rapp and Lübken<br />
(2001) showed that the combined measurement <strong>of</strong> the disturbance<br />
in the electrons and ions allows for a characterization<br />
<strong>of</strong> the aerosol particles themselves. This idea was then applied<br />
by Lübken and Rapp (2001) who derived aerosol parameters<br />
like radii and number densities from the observation<br />
<strong>of</strong> positive ion and electron disturbances under <strong>PMSE</strong><br />
and/or NLC conditions. In summary, the interaction <strong>of</strong> the<br />
www.atmos-chem-phys.org/acp/4/2601/ Atmos. Chem. Phys., 4, 2601–2633, 2004
2616 M. Rapp and F. J. Lübken: Review <strong>of</strong> <strong>PMSE</strong><br />
Fig. 20. Power spectral densities (PSD) <strong>of</strong> a passive tracer θ for<br />
two different Schmidt numbers <strong>of</strong> Sc=1 and Sc=100, respectively.<br />
The upper ordinate converts wavenumbers to lengths. The numbers<br />
‘−5/3’ and ‘−1’ indicate the wavenumber power law at the scales<br />
shown. The vertical dashed line indicates the inner scale (see text<br />
for details) and the vertical dashed dotted line indicates the Bragg<br />
scale <strong>of</strong> a 50 MHz radar.<br />
electrons and positive ions with mesospheric aerosol particles<br />
appears to be quantitatively understood. Nevertheless, it<br />
must be noted that so far there is no physical explanation for<br />
the occasional observation <strong>of</strong> positively charged aerosol particles<br />
(see Sect. 2.4). It has been proposed that photo emission<br />
<strong>of</strong> ‘dirty’ ice particles may be involved (Havnes et al.,<br />
1990), however, quantitative calculations <strong>of</strong> the charging <strong>of</strong><br />
ice aerosol particles by photo emission are hampered by the<br />
fact that the details <strong>of</strong> the complex index <strong>of</strong> refraction <strong>of</strong> such<br />
‘dirty’ ice particles are not yet available (Rapp and Lübken,<br />
1999).<br />
3.3 Turbulence with high Schmidt number: the hydrodynamic<br />
theory <strong>of</strong> <strong>PMSE</strong><br />
3.3.1 The concept<br />
The first breakthrough in our understanding <strong>of</strong> <strong>PMSE</strong> was<br />
achieved through the work <strong>of</strong> Kelley et al. (1987) who<br />
proposed that electron diffusivity around the polar <strong>summer</strong><br />
mesopause region could be reduced due to the presence <strong>of</strong><br />
large positive ion clusters. If a tracer diffusivity D is considerably<br />
smaller than the kinematic viscosity <strong>of</strong> air ν, or in<br />
other words, if the Schmidt number Sc=ν/D is considerably<br />
larger than 1 then fluctuations in the tracer field can extend<br />
to much smaller scales than the fluctuations <strong>of</strong> the turbulent<br />
velocity field. This basic result <strong>of</strong> the theory <strong>of</strong> turbulent<br />
tracer advection goes back to Batchelor (1959) who demonstrated<br />
that tracer structures at scales around the inner scale<br />
are compressed by a pure strain motion due to the velocity<br />
gradient (∼ √ ɛ/ν) acting on scales around the inner scale l0<br />
H<br />
(= the transition scale between the inertial and the viscous<br />
subrange). This strain leads to the creation <strong>of</strong> structures significantly<br />
smaller than l0<br />
H which subsequently can only be<br />
erased by the action <strong>of</strong> molecular diffusion. If, however, the<br />
Fig. 21. Electron diffusion coefficient D e in units <strong>of</strong> the positive<br />
ion diffusion coefficient D i as a function <strong>of</strong> the ratio between the<br />
aerosol charge number density |Z A |N A and the free electron number<br />
density N e according to Cho et al. (1992), copyright by the<br />
American Geophysical Union.<br />
diffusion coefficient <strong>of</strong> the tracer is much smaller than the<br />
kinematic viscosity <strong>of</strong> air (being responsible for the damping<br />
<strong>of</strong> the velocity fluctuations) tracer structures can persist<br />
at scales ≪l0<br />
H (see Fig. 20). Batchelor (1959) further estimated<br />
the shape <strong>of</strong> the tracer spectrum beyond l0<br />
H and found<br />
that the spectrum should reveal a so called viscous convective<br />
subrange characterized by a k −1 dependence (where k is the<br />
wavenumber). Note that indeed this spectral behaviour has<br />
been verified by laboratory investigations on high Schmidt<br />
number tracers (Gibson and Schwartz, 1963; Gibson et al.,<br />
1970) and by direct numerical simulation methods (Bogucki<br />
et al., 1997). Quantitative considerations based on Kelley<br />
et al. (1987)’s ideas and the available experimental knowledge<br />
on proton hydrates in the polar <strong>summer</strong> mesopause region<br />
(Johannessen and Krankowsky, 1972; Kopp et al., 1985)<br />
showed, however, that the mass <strong>of</strong> the positive ions was far<br />
too small in order to lead to an electron Schmidt number ≫1<br />
required to explain the <strong>PMSE</strong> observations. Subsequently,<br />
Cho et al. (1992) considered larger particles, namely charged<br />
ice particles. Cho et al. (1992) applied the multipolar diffusion<br />
theory <strong>of</strong> Hill (1978) to a diffusion system consisting<br />
<strong>of</strong> electrons, positive ions and charged aerosol particles.<br />
They found that if somewhat more than 50% <strong>of</strong> the overall<br />
negative charge is bound on the aerosol particles, i.e.,<br />
|Z A |N A /N e >1.2 (|Z A |: number <strong>of</strong> charges per particle, N A :<br />
particle number density, N e : electron number density), the<br />
electron diffusivity should drop down by several orders <strong>of</strong><br />
magnitude to the value <strong>of</strong> the aerosol diffusivity (see Fig. 21).<br />
Thus at the time <strong>of</strong> Cho et al. (1992)’s work the picture<br />
<strong>of</strong> our understanding <strong>of</strong> <strong>PMSE</strong> seemed to be complete:<br />
The presence <strong>of</strong> neutral air turbulence in combination with a<br />
Atmos. Chem. Phys., 4, 2601–2633, 2004<br />
www.atmos-chem-phys.org/acp/4/2601/
M. Rapp and F. J. Lübken: Review <strong>of</strong> <strong>PMSE</strong> 2617<br />
Fig. 22. Measured (symbols) and calculated volume reflectivities<br />
(lines) for different radar Bragg wave numbers (lower abscissa) and<br />
Bragg scale (upper abscissa), respectively. Parameters used in the<br />
calculations for all black lines are given in the black colored insert.<br />
Parameters used in the calculations for all red lines are given in<br />
the red colored insert. The horizontal lines indicate the incoherent<br />
scatter reflectivity (Thomson scatter) for an electron number density<br />
<strong>of</strong> 5000 cm −3 (black) and 500 cm −3 (red), respectively. The two<br />
red symbols mark the observations reported by Röttger (2001).<br />
reduced diffusivity <strong>of</strong> electrons due to the presence <strong>of</strong> a considerable<br />
amount <strong>of</strong> charged aerosol particles seemed to be<br />
sufficient to explain the existence <strong>of</strong> the electron irregularities<br />
at the Bragg scale and subsequently this concept was further<br />
elaborated and applied by several authors (Klostermeyer,<br />
1997, 1999b; Chaxel, 1997; Hill et al., 1999). However,<br />
the observation by Lübken et al. (1993b) (see Sect. 2.4.2)<br />
that soon followed the publication <strong>of</strong> the theory created a<br />
dilemma since they showed that one <strong>of</strong> the crucial requirements<br />
<strong>of</strong> the Cho et al. (1992)-theory, i.e., the presence <strong>of</strong><br />
neutral air turbulence, was not fulfilled. This dilemma triggered<br />
a variety <strong>of</strong> approaches that tried to explain <strong>PMSE</strong> in<br />
the complete absence <strong>of</strong> neutral air turbulence (see Sect. 3.6).<br />
A solution to this dilemma is presented in Sect. 3.5.<br />
3.3.2 Absolute volume reflectivities<br />
Recent observations <strong>of</strong> turbulent energy dissipation rates and<br />
Schmidt-numbers around the polar <strong>summer</strong> mesopause now<br />
also allow for a quantitative comparison <strong>of</strong> observed and<br />
computed radar volume reflectivities based on the above described<br />
theory (Lübken et al., 1994, 1998, 2002). In Fig. 22<br />
we compare the measured absolute reflectivities stated in Table<br />
1 with calculations <strong>of</strong> the volume reflectivity based on a<br />
Schmidt-number dependent turbulence model (Driscoll and<br />
Kennedy, 1985) (for details on the calculation <strong>of</strong> the volume<br />
reflectivity based on the Driscoll and Kennedy-model<br />
see Giebeler, 1995). Figure 22 shows that with reasonable<br />
values for the Schmidt-number (Lübken et al., 1998), the<br />
turbulent energy dissipation rate (Lübken et al., 2002), the<br />
Fig. 23. Decay times <strong>of</strong> a Gaussian electron perturbation (with a<br />
width = 67 cm) as a function <strong>of</strong> =|Z A |N A /Ne for the case <strong>of</strong><br />
positive ions and singly negatively charged aerosol particles with a<br />
radius <strong>of</strong> 10 nm and different values <strong>of</strong> T e /T n . This figure is reproduced<br />
from Rapp and Lübken (2000), copyright by the American<br />
Geophysical Union.<br />
electron number density N e and the electron irregularity dissipation<br />
rate ɛ e (Giebeler, 1995) the observations at 50 MHz,<br />
224 MHz and 500 MHz can be readily explained (thick black<br />
line). It is also interesting to note that using the same parameters<br />
but ɛ=2.5 W/kg (which is the largest value that has so far<br />
been reported Lübken et al., 2002) also allows to explain the<br />
observed reflectivity at 933 MHz (thick dashed line). Note<br />
further that the product N 2 e · ɛ e is ∝ N e , where N e an absolute<br />
small scale fluctuation <strong>of</strong> the electron number density<br />
(Driscoll and Kennedy, 1985). Hence, N 2 e · ɛ e characterizes<br />
the absolute magnitude <strong>of</strong> the electron number density fluctuations<br />
due to turbulence and determines the absolute level<br />
<strong>of</strong> the calculated reflectivity. With this information in mind,<br />
we also see that the considerably lower values reported by<br />
Röttger (2001) can be directly explained in the scope <strong>of</strong> the<br />
Cho et al. (1992)-theory (red dotted line). In summary, the<br />
Cho et al. (1992)-theory can explain <strong>PMSE</strong> observations at<br />
all radar frequencies provided that indeed neutral air turbulence<br />
is present.<br />
3.3.3 Evidence for electron diffusivity controlling <strong>PMSE</strong><br />
As described in Sect. 2.6 the observations <strong>of</strong> an active modulation<br />
<strong>of</strong> <strong>PMSE</strong> through RF-heating <strong>of</strong> the ambient electrons<br />
have opened a new experimental window for the study<br />
<strong>of</strong> <strong>PMSE</strong>. Rapp and Lübken (2000) interpreted the observations<br />
by Chilson et al. (2000) in the scope <strong>of</strong> the electron<br />
temperature dependence <strong>of</strong> the electron diffusion in the<br />
vicinity <strong>of</strong> charged aerosol particles and found that an electron<br />
temperature rise indeed explains the observed features.<br />
Figure 23 shows calculated decay times for idealized disturbances<br />
<strong>of</strong> Gaussian shape in the electron number density in<br />
www.atmos-chem-phys.org/acp/4/2601/ Atmos. Chem. Phys., 4, 2601–2633, 2004
2618 M. Rapp and F. J. Lübken: Review <strong>of</strong> <strong>PMSE</strong><br />
Fig. 24. Grey shaded area: Mean observed <strong>PMSE</strong> signal power during<br />
the months June and July 2000. Dotted line: Mean proxy pr<strong>of</strong>ile<br />
obtained by time averaging 24 h CARMA model simulations. Solid,<br />
dotted, and dashed-dotted line: Mean proxy pr<strong>of</strong>iles obtained from<br />
CARMA simulations including gravity wave activity for wave periods<br />
<strong>of</strong> 8 h and 1 h, respectively. This figure is reproduced from Rapp<br />
et al. (2003c), copyright by the American Geophysical Union.<br />
the presence <strong>of</strong> similar disturbances in the negatively charged<br />
aerosol number density and positive ion number density (see<br />
the figure caption <strong>of</strong> Fig. 23 for further details). The calculations<br />
were performed for different values <strong>of</strong> |Z A |N A /N e<br />
and T e /T n , where T e is the electron temperature and T n<br />
the temperature <strong>of</strong> the neutral gas. Note that during heating<br />
only the electron temperature is affected whereas the<br />
positive ion temperature and the temperatures <strong>of</strong> the neutral<br />
gas and the aerosol particles do not change (e.g., Rietveld<br />
et al., 1986). Similar to the results <strong>of</strong> Cho et al.<br />
(1992), Fig. 23 shows that for considerably large values <strong>of</strong><br />
|Z A |N A /N e and T e /T n =1, the decay times are much larger<br />
than without charged aerosol particles (i.e., |Z A |N A /N e ≪1),<br />
indicative <strong>of</strong> a significantly reduced electron diffusivity and<br />
hence the possibility to maintain fluctuations in the electron<br />
gas at the radar Bragg scale. Belova et al. (2001) have estimated<br />
that during the heating pulse, the electron temperature<br />
rises by about a factor <strong>of</strong> T e /T n =20, i.e., to a temperature<br />
<strong>of</strong> ∼2500 K. With this T e /T n -ratio and for |Z A |N A /Ne≥1,<br />
Fig. 23 predicts the decay time to decrease by several orders<br />
<strong>of</strong> magnitude leading to a fast disappearance <strong>of</strong> the <strong>PMSE</strong>.<br />
In addition, the calculations <strong>of</strong> Rapp and Lübken (2000) suggested<br />
that when the heater is <strong>of</strong>f, the electrons immediately<br />
acquire the neutral gas temperature due to collisions with the<br />
neutral molecules and diffuse back to their original positions<br />
since the disturbance in the charged aerosol particle distribution<br />
has not been affected by the heating. In a second investigation,<br />
Rapp and Lübken (2003b) have further shown that<br />
the <strong>PMSE</strong> decay and reappearance are expected to happen<br />
on time scales on the order <strong>of</strong> 1 ms which is also in accordance<br />
with a recent reanalysis <strong>of</strong> the original Chilson et al.<br />
(2000)-data by Belova et al. (2003).<br />
With a similar theoretical approach, Havnes (2004) have<br />
recently also succeeded to explain the <strong>PMSE</strong> overshoot effect<br />
reported by Havnes et al. (2003) (see Sect. 2.6). In addition<br />
to the electron temperature dependence <strong>of</strong> the multipolar<br />
diffusion system, Havnes also considered the timeand<br />
temperature-dependent charging <strong>of</strong> the aerosol particles.<br />
Havnes (2004) showed that during periods <strong>of</strong> enhanced electron<br />
temperatures the aerosol particles acquire a larger negative<br />
charge (because the charging rates are temperature dependent)<br />
leading to a steepening <strong>of</strong> aerosol charge density<br />
gradients. After the heating was switched <strong>of</strong>f, the structures<br />
in the electron gas reformed, this time, however, also with<br />
steeper gradients in order to compensate for the enhanced<br />
gradients in the aerosol charge density distribution. This finally<br />
leads to a stronger <strong>PMSE</strong> signal than before the heater<br />
was switched on.<br />
The combined experimental and model results from Chilson<br />
et al. (2000), Belova et al. (2003), Havnes et al. (2003),<br />
Rapp and Lübken (2000, 2003b), and Havnes (2004) hence<br />
provide strong direct evidence that the reduction <strong>of</strong> electron<br />
diffusivity due to the presence <strong>of</strong> charged aerosol particles<br />
and their charging due to diffusional fluxes <strong>of</strong> electrons<br />
onto their surface are two key physical processes leading to<br />
<strong>PMSE</strong>.<br />
3.4 A microphysical proxy for <strong>PMSE</strong><br />
As demonstrated in Sect. 3.1, microphysical models satisfactorily<br />
describe the physics <strong>of</strong> the formation and growth<br />
<strong>of</strong> mesospheric ice particles. Furthermore, models <strong>of</strong> the<br />
charging <strong>of</strong> aerosol particles and their multipolar diffusion<br />
readily account for a variety <strong>of</strong> observations like in situ observations<br />
<strong>of</strong> charged particles and electron biteouts and also<br />
the active modulation <strong>of</strong> <strong>PMSE</strong> through RF-heating. Subsequently,<br />
Rapp et al. (2003c) combined a microphysical ice<br />
particle model with an aerosol charging model hence allowing<br />
to simulate not only neutral but also charged aerosol particles.<br />
In order to test the idea that the main features <strong>of</strong> <strong>PMSE</strong><br />
depend on microphysical properties <strong>of</strong> these charged aerosol<br />
particles, they suggested a simple empirical proxy for <strong>PMSE</strong><br />
that can be studied with the available microphysical models.<br />
Rapp et al. (2003c) assumed that the most important physical<br />
process creating <strong>PMSE</strong> is the reduction <strong>of</strong> electron diffusivity<br />
due to the presence <strong>of</strong> charged aerosol particles. If this<br />
Atmos. Chem. Phys., 4, 2601–2633, 2004<br />
www.atmos-chem-phys.org/acp/4/2601/
M. Rapp and F. J. Lübken: Review <strong>of</strong> <strong>PMSE</strong> 2619<br />
were the case, <strong>PMSE</strong> signal strength should be proportional<br />
to the charge number density (|Z A |N A ) and the square <strong>of</strong> the<br />
radius <strong>of</strong> these particles (rA 2 ) since the aerosol particle diffusion<br />
coefficient is expected to vary like 1/rA 2 (e.g., Cho et al.,<br />
1992). Taken together, the proxy P was defined as<br />
P = |Z A |N A · rA 2 . (1)<br />
Rapp et al. (2003c) showed that the proxy calculations<br />
indeed reproduce the observed mean <strong>PMSE</strong> pr<strong>of</strong>ile. Figure<br />
24 compares mean proxy pr<strong>of</strong>iles derived from averaging<br />
24 h model simulation runs for different background conditions<br />
(i.e., undisturbed and with two different gravity waves)<br />
with the mean <strong>PMSE</strong> signal strength as observed during the<br />
months June and July 2000. Evidently, the main features like<br />
altitude range and the altitude <strong>of</strong> the average <strong>PMSE</strong> maximum<br />
are nicely reproduced. In addition, the proxy calculations<br />
further suggested that individual <strong>PMSE</strong> (i.e., not averaged)<br />
should usually have their absolute maximum close to<br />
the lower edge <strong>of</strong> the layer due to the predicted dependence<br />
<strong>of</strong> the <strong>PMSE</strong> signal on the particle radius which is largest<br />
at the bottom <strong>of</strong> the ice cloud. This can be seen in Fig. 25<br />
where we show pr<strong>of</strong>iles <strong>of</strong> the proxy and the lidar backscatter<br />
ratio, the charge number density and the ice particle radius<br />
at an arbitrarily selected time during a model simulation.<br />
Evidently, the proxy pr<strong>of</strong>ile peaks at the altitude where<br />
the particles have grown largest, i.e., to radii <strong>of</strong> ∼50 nm at<br />
an altitude <strong>of</strong> 82 km, whereas the maximum particle charge<br />
number density occurs considerably higher, i.e., at 85 km instead<br />
<strong>of</strong> 82 km. In fact, a statistical analysis <strong>of</strong> <strong>PMSE</strong> data<br />
from three complete <strong>PMSE</strong> seasons studied with the ALWIN<br />
VHF radar confirms that the <strong>PMSE</strong> maximum is usually located<br />
in the lower part <strong>of</strong> the <strong>PMSE</strong> layer (see Fig. 8 in Rapp<br />
et al., 2003c).<br />
In summary, the overall good agreement <strong>of</strong> proxy- and<br />
<strong>PMSE</strong>-properties strongly supported the view that charged<br />
aerosol particles and their influence on electron diffusivity<br />
are the key physical process for our understanding <strong>of</strong> <strong>PMSE</strong>.<br />
This triggered Rapp and Lübken (2003a) to reconsider the<br />
corresponding theory. Their main results are discussed in the<br />
next section.<br />
3.5 The diffusion <strong>of</strong> electrons in the vicinity <strong>of</strong> charged particles<br />
revisited<br />
Based on the pioneer-work <strong>of</strong> Hill (1978), Rapp and Lübken<br />
(2003a) have recently reconsidered the diffusion <strong>of</strong> electrons<br />
in the presence <strong>of</strong> charged particles and positive ions. In<br />
such a plasma, the diffusion <strong>of</strong> the differently charged species<br />
is coupled through the Coulomb interaction between all the<br />
constituents. Since there are Coulomb forces between the<br />
positive ions and electrons on the one hand and charged particles<br />
and electrons on the other hand, it turns out that such a<br />
system possesses two distinct diffusion modes characterized<br />
by two different eigenvalues for the electron diffusion coefficient.<br />
In short, the one diffusion coefficient has the same<br />
Fig. 25. Model results <strong>of</strong> the proxy P (black,left), the calculated<br />
backscatter ratio that would be seen by a lidar operating at a wavelength<br />
<strong>of</strong> 532 nm (red, left), the charged particle number density<br />
(black, right) and the aerosol particle radius (red, right) (after Rapp<br />
et al., 2003c, copyright by the American Geophysical Union).<br />
order <strong>of</strong> magnitude as the ion diffusion coefficient but shows<br />
some dependence on the relative charge number density <strong>of</strong><br />
particles and electrons. The second diffusion coefficient is<br />
roughly given by the aerosol diffusion coefficient and varies<br />
with the aerosol radius like 1/r 2 A .<br />
The basic physical idea is now as follows: the charged<br />
aerosol particles are transported due to the turbulent velocity<br />
field and the accompanying shear (Batchelor, 1959). This<br />
transport, however, is equivalent to a charge current that must<br />
be compensated by an oppositely directed current <strong>of</strong> the electrons<br />
in order to maintain zero net current and local charge<br />
neutrality. This leads to anticorrelated spatial structures in<br />
the electron and charged particle distributions (see Sect. 4.4<br />
for experimental evidence for this morphology). The calculations<br />
<strong>of</strong> Rapp and Lübken (2003a) then showed that after<br />
a short initial time, the diffusion speed <strong>of</strong> the electron disturbances<br />
is entirely determined by the diffusion speed <strong>of</strong><br />
the charged aerosol particle disturbances. Note that unlike<br />
in Cho et al. (1992)’s treatment this general behaviour is almost<br />
independent <strong>of</strong> the parameter , i.e., the ratio between<br />
the charge number density <strong>of</strong> aerosol particles and the free<br />
electron number density 2 .<br />
These results have been independently confirmed by a<br />
comprehensive numerical investigation performed by Lie-<br />
Svendsen et al. (2003). These authors studied the temporal<br />
development <strong>of</strong> structures in the positive ion and electron<br />
number density distribution arising as a consequence <strong>of</strong><br />
a predefined structure in the distribution <strong>of</strong> aerosol particles<br />
2 Closer inspection <strong>of</strong> Cho et al. (1992)’s work actually shows<br />
that the 1-criterium is artificially created by an unphysical initial<br />
condition for their model calculations (see appendix B in Rapp and<br />
Lübken, 2003a, for a detailed discussion).<br />
www.atmos-chem-phys.org/acp/4/2601/ Atmos. Chem. Phys., 4, 2601–2633, 2004
2620 M. Rapp and F. J. Lübken: Review <strong>of</strong> <strong>PMSE</strong><br />
Fig. 26. Radar scatter decay time for a relative reflectivity decrease<br />
by 10 dB after the <strong>PMSE</strong> generation mechanism has ceased.<br />
This figure is reproduced from Rapp et al. (2003b), copyright by<br />
COSPAR.<br />
and being subject to all relevant physical processes like diffusion,<br />
aerosol charging, production and recombination <strong>of</strong><br />
charge carriers, transport by a vertical wind, and sedimentation<br />
due to gravity.<br />
Rapp and Lübken (2003a) further studied the implications<br />
<strong>of</strong> these results for radio wave scattering. According to<br />
Røyrvik and Smith (1984) the volume reflectivity is basically<br />
proportional to the power spectral density <strong>of</strong> the (absolute)<br />
electron number density perturbation at the Bragg scale. Using<br />
this result, Rapp and Lübken (2003a) were able to derive<br />
the decay time <strong>of</strong> the radar signal once the mechanism that<br />
had initially generated the small scale structures in the electron<br />
number density had stopped. According to their work,<br />
the decay time for a signal decay by dB may be written as<br />
τ −dB<br />
diff<br />
= λ2 · /10 · ln(10)<br />
8π 2 · D 0 2<br />
≈ 0.02 · · λ2 · r 2 A<br />
ν<br />
Here, D2 0 is the electron diffusion coefficient due to their coupling<br />
to the charged aerosol particles, λ is the radar wavelength,<br />
r A is the aerosol radius, and ν is the kinematic viscosity<br />
<strong>of</strong> air. In the approximate formula on the right hand side<br />
<strong>of</strong> Eq. (2), the radar wavelength is in m, the aerosol radius is<br />
in nm and the kinematic viscosity <strong>of</strong> air is given in m 2 /s, resulting<br />
in τ diff being given in s. Equation (2) shows that the<br />
diffusional decay time is proportional to the square <strong>of</strong> the radius<br />
<strong>of</strong> the charged particles involved and the square <strong>of</strong> radar<br />
wavelength. In Fig. 26 we present this decay time for a decay<br />
by 10 dB as a function <strong>of</strong> aerosol radius. Evidently, for particles<br />
smaller than 10 nm the decay time is rather short, i.e.,<br />
only 2.5 min for particles with a radius <strong>of</strong> 5 nm and 10 min for<br />
particles with a radius <strong>of</strong> 10 nm. Due to the quadratic dependence<br />
<strong>of</strong> the decay time on the aerosol radius, the decay time<br />
is already 40 min for aerosol particles with a radius <strong>of</strong> 20 nm<br />
and even several hours for particles with a radius <strong>of</strong> 50 nm<br />
(2)<br />
which exist in an NLC environment. These long decay times<br />
for particle radii larger than say 15 nm suggest that <strong>PMSE</strong><br />
potentially are a manifestation <strong>of</strong> fossil neutral air turbulence<br />
(for details on the term ‘fossil turbulence’ see Woods et al.,<br />
1969), an idea that was first suggested by Cho et al. (1996).<br />
However, these authors estimated that the decay time <strong>of</strong> the<br />
radar echo should not exceed ∼7 min such that the repeated<br />
absence <strong>of</strong> neutral air turbulence in the lower altitude range<br />
<strong>of</strong> the <strong>echoes</strong> (Lübken et al., 2002) was not likely to be explained<br />
by this effect. However, the calculations presented<br />
by Rapp and Lübken (2003a) strongly suggest that at low altitudes,<br />
say below 85 km, where particles are believed to have<br />
grown to sizes larger than 15–20 nm due to growth and sedimentation<br />
(see also Fig. 18), the long lifetime <strong>of</strong> the structure<br />
can ‘freeze in’ turbulent structures for a considerable time<br />
such that the observations <strong>of</strong> Lübken et al. (2002) become<br />
understandable. In Sect. 4 we show that these model ideas<br />
indeed explain the statistics <strong>of</strong> <strong>PMSE</strong> observations based on<br />
available data <strong>of</strong> turbulence observations.<br />
3.6 ‘Non-turbulent’ theories<br />
As mentioned above, the proven absence <strong>of</strong> neutral air turbulence<br />
in an altitude range where <strong>PMSE</strong> was simultaneously<br />
observed triggered the formulation <strong>of</strong> a couple <strong>of</strong> ‘nonturbulent’<br />
theories for <strong>PMSE</strong>. The dust hole scatter theory<br />
by Havnes et al. (1992), the opalescence theory by Trakhtengerts<br />
and Demekhov (1995) and Trakhtengerts (1994), and<br />
the consideration <strong>of</strong> charged dust diffusive waves (Hocking<br />
et al., 1991) were <strong>review</strong>ed and abandoned in the previous<br />
<strong>review</strong> article by Cho and Röttger (1997). Hence, we do<br />
not repeat their treatment but concentrate on two approaches<br />
that were not discussed in depth previously, i.e, the dressed<br />
aerosol scatter theory proposed by e.g. Hagfors (1992) and<br />
the particle growth-feedback mechanism proposed by Gumbel<br />
and Witt (2002).<br />
3.6.1 Dressed aerosol scatter<br />
It has been suggested that the <strong>PMSE</strong> observations in the UHF<br />
wavelength range, i.e., at frequencies larger than 224 MHz,<br />
can be explained by a mechanism called ‘dressed aerosol<br />
scatter’ (Havnes et al., 1990; Cho and Kelley, 1992; Hagfors,<br />
1992). The basic idea is that the charged aerosol particles<br />
attract a cloud <strong>of</strong> electrons (if they are positively charged;<br />
if they are negatively charged it is thought that they lead<br />
to a clustering <strong>of</strong> electrons in between the charged aerosol<br />
particles) with a typical cloud radius given by the Debyelength.<br />
Consequently, if the radar wavelength is larger than<br />
the Debye-length, then these electron clouds should lead to<br />
coherent scatter, i.e., under certain conditions the cross section<br />
is expected to be larger than the incoherent Thomson<br />
scattering cross section 3 . The most rigorous treatment <strong>of</strong><br />
3 The Thomson scattering cross section due to one electron is<br />
given by 2πr 2 e where r e is the classical electron radius.<br />
Atmos. Chem. Phys., 4, 2601–2633, 2004<br />
www.atmos-chem-phys.org/acp/4/2601/
M. Rapp and F. J. Lübken: Review <strong>of</strong> <strong>PMSE</strong> 2621<br />
Fig. 27. Scattering cross-section <strong>of</strong> the charged dust component<br />
relative to the Thomson scattering cross section as a function <strong>of</strong><br />
f =|Z A |N A /N e , with N e =1000 cm −3 and and an electron temperature<br />
T e =150 K for three values <strong>of</strong> the dust charge (Z A =Z=1,10,100)<br />
for the radar frequencies 224 MHz and 933 MHz (Hagfors, 1992).<br />
this process has so far been presented by Hagfors (1992).<br />
Figure 27 shows the scattering cross-section <strong>of</strong> the charged<br />
dust component relative to the Thomson scattering cross section<br />
as a function <strong>of</strong> =f =|Z A |N A /N e , with an electron<br />
number density N e =1000 cm −3 for three values <strong>of</strong> the dust<br />
charge (Z A =Z=1,10,100) for the radar frequencies 224 MHz<br />
and 933 MHz (Hagfors, 1992). Figure 27 shows that also<br />
this approach to explain <strong>PMSE</strong> in the UHF wavelength range<br />
is highly problematic: first <strong>of</strong> all, it becomes clear that<br />
the dressed aerosol scattering cross section only becomes<br />
larger than the cross section for Thomson scatter if either the<br />
aerosol particle charge becomes very high (i.e., Z A =Z>100)<br />
or if =f =|Z A |N A /N e ≫1, i.e., when the overall charge<br />
balance is completely dominated by the particle charge number<br />
density. While the first possibility (i.e., large Z A ) contradicts<br />
the available experimental and theoretical evidence<br />
on aerosol particle charging, the second possibility might<br />
at least in some cases be fulfilled (see Sect. 2.4.5). However,<br />
even if indeed =f =|Z A |N A /N e ≫1, it is clear that<br />
the dressed aerosol approach cannot explain the observed reflectivity<br />
dependence on the radar frequency (see Table 1)<br />
since the observations show that the scattering cross section<br />
at 224 MHz is ∼2–3 orders <strong>of</strong> magnitude larger than the one<br />
at 933 MHz whereas the dressed aerosol scatter theory only<br />
predicts a factor
2622 M. Rapp and F. J. Lübken: Review <strong>of</strong> <strong>PMSE</strong><br />
Fig. 29. Temporal development <strong>of</strong> the radar SNR after regular<br />
pulses <strong>of</strong> neutral air turbulence (indicated by grey dashed lines)<br />
leading to a SNR <strong>of</strong> 15 dB. The colored lines indicate the SNRdecay<br />
for different aerosol particle radii assumed. The thin horizontal<br />
line at SNR=5 dB indicates the detection limit assumed. This<br />
figure is reproduced from Rapp and Lübken (2003a), copyright by<br />
the American Geophysical Union.<br />
be problematic: as discussed in Gumbel and Witt (2002),<br />
even under optimum conditions (i.e., low temperatures, many<br />
particles, and sufficient water vapor) nucleation rates can not<br />
exceed ∼10 cm −3 s −1 such that it takes at least several minutes<br />
to produce 1000 cm −3 new particles with radii larger<br />
than 3–5 nm. This time scale needs to be compared to the diffusion<br />
time <strong>of</strong> ice particles at 3–5 nm size which is <strong>of</strong> about<br />
the same order <strong>of</strong> magnitude (Cho et al., 1992). Hence, only<br />
under optimum conditions can the particle/cluster feedback<br />
provide structure amplification that is sufficient for <strong>PMSE</strong><br />
generation. If such optimum conditions do exist regularly<br />
must however be doubted since for example recent in situ observations<br />
have shown <strong>PMSE</strong> at altitudes where no considerable<br />
electron biteouts have been observed (such that particle<br />
growth is not favored; see Blix et al., 2003c, and Sect. 2.4.5).<br />
In addition, also the demand for sufficient water vapor is<br />
problematic since the freeze drying effect is expected to significantly<br />
reduce the available water vapor in the presence <strong>of</strong><br />
ice particles (Inhester et al., 1994; Rapp et al., 2002b; von<br />
Zahn and Berger, 2003). All these caveats led Gumbel and<br />
Witt (2002) themselves to conclude that ‘the particle/cluster<br />
feedback to be only a weak candidate for an explanation <strong>of</strong><br />
<strong>PMSE</strong> generation’.<br />
4 An updated hydrodynamic theory <strong>of</strong> <strong>PMSE</strong><br />
4.1 Turbulence statistics<br />
In this section, we discuss if neutral air turbulence in combination<br />
with the long lifetime <strong>of</strong> plasma fluctuations due to<br />
the presence <strong>of</strong> heavy charged particles <strong>of</strong> low mobility can<br />
account for the observed statistics <strong>of</strong> <strong>PMSE</strong> observations.<br />
Rapp and Lübken (2003a) have suggested a simple method<br />
to estimate the <strong>PMSE</strong> occurrence frequency based on observed<br />
turbulence occurrence frequencies (see Fig. 29 for<br />
a schematic illustrating this idea). Neglecting any horizontal<br />
transport, they started from a given occurrence frequency<br />
<strong>of</strong> neutral air turbulence, T OR (= Turbulence Occurrence<br />
Rate), and assumed that a turbulent event lasts<br />
τ turb ∼15 min in accordance with model results and observations<br />
(Andreassen et al., 1994; Czechowsky and Rüster,<br />
1997). They further assumed that the turbulent events are<br />
equally distributed over a given time interval. Then they calculated<br />
the decay times for a decay by 10 dB according to<br />
Eq. (2) for aerosol radii as determined with a microphysical<br />
aerosol model. Adding now these decay times to the<br />
time where turbulence was active and dividing this sum by<br />
the total time interval considered, they derived an estimate <strong>of</strong><br />
the occurrence rate <strong>of</strong> <strong>PMSE</strong>, P OR 4 , (= <strong>PMSE</strong> Occurrence<br />
Rate), as<br />
⎧<br />
)<br />
⎨<br />
T OR ·<br />
(1 + τ diff<br />
−10dB<br />
P OR =<br />
τ turb<br />
; if < 100%<br />
(3)<br />
⎩<br />
100% ; else<br />
Note that Eq. (3) is certainly a strong idealization <strong>of</strong> reality<br />
since it assumes Lagrangian observation geometry. In contrast<br />
to this, radar observations are certainly performed at a<br />
fixed location (i.e., in an Eulerian reference frame), such that<br />
horizontal transport further complicates the situation. Still,<br />
we consider Eq. (3) useful to demonstrate the following aspects:<br />
Based on the turbulence occurrence frequency determined<br />
from the available rocket borne observations (see also<br />
Sect. 2.4.2) and a modeled altitude distribution <strong>of</strong> aerosol<br />
radii as shown in the left panel <strong>of</strong> Fig. 30, Rapp and Lübken<br />
(2003a) estimated the <strong>PMSE</strong> occurrence frequency based on<br />
Eq. (3). The result is shown as the thick black line in Fig. 30.<br />
Comparing this estimate <strong>of</strong> P OR with the observed altitude<br />
pr<strong>of</strong>ile <strong>of</strong> the <strong>PMSE</strong> occurrence rate, it turns out that the<br />
general altitude distribution is well reproduced by the model<br />
approach presented here, in fact the model even overestimates<br />
the <strong>PMSE</strong> occurrence frequency at all altitudes (while<br />
formerly the problem has been to explain that <strong>PMSE</strong> can<br />
be there at all). Considering, however, the strong idealization<br />
underlying this result (i.e., no horizontal transport, assumed<br />
permanent existence <strong>of</strong> ice particles in the polar <strong>summer</strong><br />
mesopause region, etc.), this minor discrepancy is not<br />
surprising. More importantly, the calculations show some<br />
other very interesting features: at high altitudes, i.e., above<br />
∼88 km, P OR follows T OR almost one to one. This is due<br />
to the fact that ice particles at these altitudes are rather small<br />
such that the <strong>PMSE</strong> decay time (defined by the diffusional<br />
decay time by 10 dB according to Eq. 2) is short compared<br />
4 It is interesting to note that Eq. (3) may also be used to estimate<br />
the turbulence occurrence rate T OR provided the <strong>PMSE</strong> occurrence<br />
rate P OR is given, see Lübken et al. (2004)<br />
Atmos. Chem. Phys., 4, 2601–2633, 2004<br />
www.atmos-chem-phys.org/acp/4/2601/
M. Rapp and F. J. Lübken: Review <strong>of</strong> <strong>PMSE</strong> 2623<br />
Fig. 30. Left panel: assumed aerosol radii (solid lines, lower abscissa) and corresponding decay times for <strong>PMSE</strong> for a decay by 10 dB (dotted<br />
lines, upper abscissa). Right panel: Histogram <strong>of</strong> the measured turbulence occurrence rate from a total <strong>of</strong> 10 rocket soundings (Lübken et al.,<br />
2002) together with a Gaussian fit to the data (dotted line). The thick dashed line shows the <strong>PMSE</strong> occurrence frequency at Andøya in the<br />
period from 1 June 2000–31 July 2000 (only <strong>PMSE</strong> with SNR >5 dB were counted) and the thick solid line shows our estimate <strong>of</strong> the <strong>PMSE</strong><br />
occurrence frequency. This figure is reproduced from Rapp and Lübken (2003a), copyright by the American Geophysical Union.<br />
to the duration <strong>of</strong> a typical turbulence event (here assumed<br />
to be 15 min). This finding is consistent with the fact that<br />
neutral air turbulence was almost always observed in the upper<br />
part <strong>of</strong> a <strong>PMSE</strong> layer (see Sect. 2.4.2). At altitudes below<br />
85 km, however, it is striking that P OR is significantly<br />
larger than T OR, which is certainly a direct consequence <strong>of</strong><br />
the enhanced lifetime <strong>of</strong> plasma structures due to the presence<br />
<strong>of</strong> charged particles with larger radii. These findings<br />
can thus readily explain why turbulence was very seldomly<br />
observed in the lower part <strong>of</strong> a <strong>PMSE</strong> layer (Lübken et al.,<br />
2002) and shows that either active or fossil neutral air turbulence<br />
(together with the details <strong>of</strong> charged particle- and electron<br />
diffusivity discussed above) can account for all observed<br />
<strong>PMSE</strong>.<br />
4.2 Absolute volume reflectivities<br />
It was shown already in Sect. 3.3.2 that observed volume reflectivities<br />
can be quantitatively reproduced on the basis <strong>of</strong><br />
the neutral air turbulence in combination <strong>of</strong> a large Schmidt<br />
number <strong>of</strong> the electrons. In this section, this question is reconsidered<br />
from a more microscopic viewpoint, i.e., we determine<br />
absolute volume reflectivities based on the model<br />
ideas presented above. It was shown in Rapp and Lübken<br />
(2003a) that the volume reflectivity due to an idealized Gaussian<br />
disturbances with amplitude n e0 and width σ may be<br />
written as<br />
η(k) = −n<br />
k2 e 4<br />
(8π) 3 ɛ0 2m2 e f 4 · n2 e0 · σ 2 · e −k2 σ 2<br />
( )<br />
Di − D2<br />
0 2<br />
·<br />
D1 0 − · e −2D0 2 k2t , (4)<br />
D0 2<br />
where n is the typical spectral index at the radar Bragg scale,<br />
k is the wavenumber <strong>of</strong> the radar, e is the electron charge,<br />
ɛ 0 is the permittivity <strong>of</strong> space, m e is the electron mass, σ is<br />
the width <strong>of</strong> the Gaussian, and D1 0 and D0 2<br />
are the diffusion<br />
coefficients describing the two diffusion modes <strong>of</strong> electrons<br />
in the presence <strong>of</strong> charged particles and positive ions (see<br />
Sect. 3.5).<br />
Using typical values <strong>of</strong> n=−1 (i.e., from the viscous convective<br />
subrange according to Batchelor, 1959), k=2π/6 m,<br />
r A =15 nm, =0.1 ( enters the calculation <strong>of</strong> D1 0 and D0 2 ),<br />
f =50 MHz, σ =1.27 m (yielding a full width at half maximum<br />
<strong>of</strong> 3 m), n e0 =250 cm −3 and t=100 s we arrive at a volume<br />
reflectivity <strong>of</strong> η≈9 · 10 −13 m −1 . Comparing this value<br />
to the absolute reflectivities observed at ∼50 MHz stated in<br />
Table 1 we see that this value has indeed the correct order<br />
<strong>of</strong> magnitude. This estimate (together with the arguments<br />
presented in Sect. 3.3.2) demonstrates that also the absolute<br />
volume reflectivities summarized in Table 1 can be readily<br />
explained in the scope <strong>of</strong> the theory by Rapp and Lübken<br />
(2003a).<br />
4.3 Doppler broadening and aspect sensitivity<br />
As pointed out in Sect. 2.3 one <strong>of</strong> the most intriguing properties<br />
<strong>of</strong> <strong>PMSE</strong> is the <strong>of</strong>ten very narrow Doppler spectrum<br />
<strong>of</strong> the received signal. The Doppler spectrum is expected to<br />
be broad in the presence <strong>of</strong> active neutral air turbulence due<br />
to the turbulent velocity fluctuations. According to Gibson-<br />
Wilde et al. (2000) the width <strong>of</strong> the Doppler spectrum is directly<br />
related to the velocity variance in the volume probed<br />
by the radar and can be expressed in terms <strong>of</strong> the turbulent<br />
energy dissipation rate ɛ as<br />
√<br />
ɛ<br />
w rms = ±<br />
, (5)<br />
5 · 0.4 ω B<br />
where ω B is the mean Brunt-Väisälä frequency over the altitude<br />
range where the turbulent event takes place, and the factor<br />
5 is a correction factor to an earlier formula from Hocking<br />
www.atmos-chem-phys.org/acp/4/2601/ Atmos. Chem. Phys., 4, 2601–2633, 2004
2624 M. Rapp and F. J. Lübken: Review <strong>of</strong> <strong>PMSE</strong><br />
Fig. 31. Perturbations <strong>of</strong> electron (black line) and aerosol charge number densities (red line) during four selected time intervals during<br />
sounding rocket flight ECT02 in July 1994. Note that the two data sets must be shifted by ∼2.5 ms for comparison since one measurement<br />
was made at the tip <strong>of</strong> the sounding rocket and the other in the rear (with a separation <strong>of</strong> 2.5 m and a rocket speed <strong>of</strong> 1000 m/s) (Rapp et al.,<br />
2003a).<br />
(1985) which Gibson-Wilde et al. (2000) derived from a direct<br />
numerical simulation <strong>of</strong> the VHF-radio scatter created<br />
by mesospheric turbulence. If we use ω B =1.5·10 −2 s −1 and<br />
a rather large value for ɛ <strong>of</strong> 0.5 m 2 /s 3 (=0.5 W/kg) for the<br />
polar <strong>summer</strong> mesopause region (Lübken et al., 2002) we<br />
see that ±5.8 m/s is a typically expected velocity variance<br />
due to relatively strong turbulence. Contrary to this, velocity<br />
variances derived from Doppler spectra in <strong>PMSE</strong> are <strong>of</strong>ten<br />
less than ±1 m/s (Cho and Kelley, 1993). However, in<br />
Sect. 3.5 we have made the point that the electron irregularities<br />
are expected to prevail a significant time after the neutral<br />
air turbulence has ceased. Under these conditions the velocity<br />
variance which determines the spectral width <strong>of</strong> the radar<br />
echo is in fact expected to be very small. For example, if we<br />
roughly estimate the ‘minimum’ turbulent energy dissipation<br />
rate from ɛ min =ν·ωB 2 as suggested by Lübken (1992) and use<br />
ν=2 m 2 /s and the same Brunt-Väisälä frequency as before,<br />
we get ɛ min =0.0005 m 2 /s 3 resulting in w rms =0.1 m/s which<br />
has the correct order <strong>of</strong> magnitude. These estimates indicate<br />
that the observed spectral width can be explained in the<br />
scope <strong>of</strong> the theory presented here. Furthermore, these ideas<br />
also directly explain the altitude dependence <strong>of</strong> the spectral<br />
width as described in Sect. 2.3: with a higher turbulence occurrence<br />
rate at the higher altitudes and a rather low turbulence<br />
occurrence rate at the lower altitudes (see Sect. 2.4.2)<br />
the spectral width is expected to be large at the upper altitudes<br />
and small at the lower altitudes, respectively. Taking it<br />
the other way round, these results imply that spectral width<br />
measured in <strong>PMSE</strong> can indeed be used to determine turbulent<br />
energy dissipation rates (provided also, that other details like<br />
the observed spectral shape – see Fig. 6 – are understood). It<br />
is though important to note that the information on the turbulence<br />
strength comes only from the spectral width and not<br />
from the total echo power <strong>of</strong> the observed signal since the<br />
echo power also depends on quantities that are not related<br />
to neutral air turbulence like the size <strong>of</strong> the charged aerosol<br />
particles involved.<br />
Regarding observed aspect sensitivities (i.e., large at the<br />
bottom and low at the top <strong>of</strong> the <strong>PMSE</strong> layer) we further note<br />
that at least the low aspect sensitivities at the top <strong>of</strong> the <strong>PMSE</strong><br />
layers are understandable in the scope <strong>of</strong> enhanced turbulent<br />
activity at these altitudes. The reason for the enhanced aspect<br />
sensitivity at lower altitudes is more difficult to interpret:<br />
one reason could be that the turbulent velocity field itself has<br />
been anisotropic from the very beginning as suggested by recent<br />
theoretical and numerical investigations (Petterson-Reif<br />
and Andreassen, 2003; Werne and Fritts, 2001). As another<br />
possibility, Thrane et al. (2004) have recently suggested that<br />
at the lower altitudes a horizontal layering <strong>of</strong> small scale<br />
structures could take place similar to mechanisms known to<br />
acount for specular reflections in the HF-wavelength range<br />
(Thrane et al., 1981). For the time being, all these explanations<br />
remain speculative and will need closer inspection in<br />
the future (see also Sect. 5).<br />
4.4 Small scale structure <strong>of</strong> plasma species and related<br />
power spectra<br />
Recently, Rapp et al. (2003a) have further checked if observed<br />
small scale fluctuations in the electrons and charged<br />
Atmos. Chem. Phys., 4, 2601–2633, 2004<br />
www.atmos-chem-phys.org/acp/4/2601/
M. Rapp and F. J. Lübken: Review <strong>of</strong> <strong>PMSE</strong> 2625<br />
particle distribution show indeed all the features predicted<br />
by Rapp and Lübken (2003a). In particular, Rapp et al.<br />
(2003a) checked if the small scale fluctuations <strong>of</strong> electrons<br />
and charged particles are indeed anticorrelated and if the<br />
spectra <strong>of</strong> these small scale fluctuations indeed show the<br />
spectral form as predicted from a combination <strong>of</strong> the theory<br />
by Batchelor (1959) (in the case <strong>of</strong> active turbulence)<br />
and Rapp and Lübken (2003a) (in the case that the active turbulent<br />
activity has stopped, i.e., in the absence <strong>of</strong> an inertial<br />
subrange in the energy spectrum <strong>of</strong> the velocity fluctuations).<br />
In Fig. 31 data samples <strong>of</strong> such observed disturbances in<br />
the electron and charged aerosol number density as measured<br />
during flight ECT02 in 1994 are presented (see Havnes et al.,<br />
1996a,b, for more details on this data set). In panels (a) and<br />
(b), the anticorrelation between the two data sets is obvious<br />
with corresponding correlation coefficients as large as<br />
∼−0.8. Panel (c) shows one example, where the instruments<br />
did not observe any fine scale structure and panel (d) shows<br />
one example where in fact a strong positive correlation between<br />
electrons and negatively charged aerosol particles was<br />
observed. A possible explanation <strong>of</strong> such a feature was presented<br />
in the model study by Lie-Svendsen et al. (2003) who<br />
proposed that a positive correlation could either occur in the<br />
in the presence <strong>of</strong> large and hence quickly sedimenting particles<br />
or in the presence <strong>of</strong> evaporating particles (see Fig. 32).<br />
In a recent study, Blix et al. (2003b) analyzed similar observations<br />
together with simultaneous temperature measurements<br />
and found indeed support for the idea that evaporating<br />
ice particles are causing the observed positive correlations.<br />
In any case, such features have only been observed at the<br />
bottom <strong>of</strong> <strong>PMSE</strong> layers and must be considered as a specialty<br />
whereas the standard shows indeed the anticorrelation<br />
predicted by multipolar diffusion theory.<br />
Rapp et al. (2003a) further considered the spectral shape<br />
<strong>of</strong> small scale disturbances in the electron and charged particle<br />
distribution. Based on the model <strong>of</strong> Rapp and Lübken<br />
(2003a) they found that the general spectral shape acquired<br />
during a phase <strong>of</strong> active neutral air turbulence (as described<br />
by Batchelor, 1959) should develop according to<br />
Ɣ(k, t) = 2χ √ ν<br />
(−2l<br />
k ɛ · exp B 2 k2) ·e −D Ak 2t , (6)<br />
} {{ }<br />
Batchelor, 1959<br />
where the underbraced part <strong>of</strong> the equation is the power spectrum<br />
at the time the neutral air turbulence stopped (Batchelor,<br />
1959). Here, χ is the rate at which fluctuations <strong>of</strong> the considered<br />
tracer are dissipated, l B =(νD 2 /ɛ) 1 4 is the so-called<br />
Batchelor-scale, and D denotes the diffusion coefficient <strong>of</strong><br />
the tracer. Hence, power spectra <strong>of</strong> electrons and charged<br />
particles should reveal a viscous convective subrange with its<br />
prominent k −1 -power law as predicted by Batchelor (1959)<br />
even a considerable time after the active neutral air turbulence<br />
has stopped. Indeed, the power spectra <strong>of</strong> the fluctuations<br />
shown in Fig. 31 reveal indications <strong>of</strong> a viscous con-<br />
Fig. 32. Electron (dashed curves) and positive ion (solid curves)<br />
density perturbations at the end <strong>of</strong> model runs for different values<br />
<strong>of</strong> the aerosol particle evaporation rate I a . For comparison, model<br />
results neglecting the influence <strong>of</strong> particle evaporation are shown in<br />
the upper left panel. This figure is reproduced from Lie-Svendsen<br />
et al. (2003), copyright by the American Geophysical Union.<br />
vective subrange and hence confirm these ideas (see Fig. 33).<br />
Rapp et al. (2003a) also tried to classify the spectra shown<br />
in Fig. 33 as ‘actively turbulent’ or ‘fossil’ based on neutral<br />
air turbulence measurements onboard the same sounding<br />
rocket and attributed spectrum (a) as ‘active’ whereas spectra<br />
(b) and (d) were ‘fossil’. However, Rapp et al. (2003a)<br />
also pointed out that turbulence and plasma measurements<br />
were conducted during different parts <strong>of</strong> the rocket trajectories,<br />
i.e., the plasma measurements were made on the ascent<br />
and the turbulence measurements were made on the descent<br />
part <strong>of</strong> the rocket trajectory. Hence, this classification must<br />
be considered with some caution since the turbulent structure<br />
(as well as the structure <strong>of</strong> the plasma pr<strong>of</strong>iles) might be<br />
horizontally non-uniform.<br />
In any case, all the results regarding small scale observations<br />
<strong>of</strong> plasma consituents at <strong>PMSE</strong> altitudes are consistent<br />
with the theoretical ideas described above suggesting that<br />
<strong>PMSE</strong> can be explained by a combination <strong>of</strong> active and fossil<br />
turbulence acting on the large and heavy charged aerosol particles<br />
which are subsequently mirrored in the electron number<br />
density distribution that becomes visible to a VHF radar.<br />
www.atmos-chem-phys.org/acp/4/2601/ Atmos. Chem. Phys., 4, 2601–2633, 2004
2626 M. Rapp and F. J. Lübken: Review <strong>of</strong> <strong>PMSE</strong><br />
Fig. 33. Power spectra <strong>of</strong> electron number density (black lines) and particle charge number density fluctuations (red lines) shown in Fig. 31.<br />
The inclined line represents a spectral slope <strong>of</strong> −1 and the vertical line marks the radar Bragg scale (=2.8 m) (Rapp et al., 2003a).<br />
5 Conclusions<br />
In the current paper we have <strong>review</strong>ed the experimental<br />
and theoretical milestones that have led to an advanced understanding<br />
<strong>of</strong> <strong>PMSE</strong>. Based on experimental results from<br />
in situ observations with sounding rockets, ground based<br />
observations with radars and lidars, numerical simulations<br />
with microphysical models <strong>of</strong> the life cycle <strong>of</strong> mesospheric<br />
aerosol particles, and theoretical considerations regarding the<br />
diffusivity <strong>of</strong> electrons in the ice loaded complex plasma <strong>of</strong><br />
the mesopause region, an explanation for the generation <strong>of</strong><br />
these radar <strong>echoes</strong> has been described that is consistent with<br />
the entire available experimental data base. The main idea is<br />
that mesospheric neutral air turbulence in combination with<br />
a significantly reduced electron diffusivity due to the presence<br />
<strong>of</strong> heavy charged ice aerosol particles (radii ∼5–50 nm)<br />
lead to the creation <strong>of</strong> structures at spatial scales significantly<br />
smaller than the inner scale <strong>of</strong> the turbulent velocity field.<br />
Importantly, owing to their very low diffusivity, the plasma<br />
structures acquire a very long lifetime, i.e., 10 min to hours,<br />
in the presence <strong>of</strong> particles with radii between 10 and 50 nm.<br />
This leads to a temporal decoupling <strong>of</strong> active neutral air turbulence<br />
and the existence <strong>of</strong> small scale plasma structures<br />
and <strong>PMSE</strong> and thus readily explains observations proving<br />
the absence <strong>of</strong> neutral air turbulence at <strong>PMSE</strong> altitudes.<br />
With this explanation at hand, it becomes clear that <strong>PMSE</strong><br />
are a unique geophysical phenomenon from many different<br />
points <strong>of</strong> view: Through their close relationship to ice particles,<br />
<strong>PMSE</strong> are a direct indicator for extremely low temperatures<br />
(i.e., less than ∼150 K) at mesopause altitudes. Importantly,<br />
radar observations <strong>of</strong> <strong>PMSE</strong> are independent from tropospheric<br />
weather conditions in contrast to optical soundings<br />
from the ground for example with lidars. Long term observations<br />
<strong>of</strong> <strong>PMSE</strong> have the potential to yield insight into the<br />
long term behaviour <strong>of</strong> the mesopause temperature, a quantity<br />
that has been suspected to change due to anthropogenic<br />
action. From a more technical point <strong>of</strong> view, the observation<br />
<strong>of</strong> <strong>PMSE</strong> allows for consistency checks with remote sensings<br />
<strong>of</strong> temperatures from satellites (e.g., Mertens et al., 2004) in<br />
an altitude range where other direct measurements <strong>of</strong> temperatures<br />
are almost unavailable (with the exception <strong>of</strong> in<br />
situ temperature measurements from sounding rockets that<br />
due to their significant costs can only be performed sporadically).<br />
In addition, these ice particles are conservative and<br />
passive tracers for the background wind field to a very good<br />
approximation, such that the observation <strong>of</strong> <strong>PMSE</strong> also allows<br />
for the derivation <strong>of</strong> winds and its short term variability<br />
induced for example by gravity waves. Owing to their usually<br />
very high signal to noise ratio (<strong>of</strong>ten in excess <strong>of</strong> 30 dB)<br />
<strong>PMSE</strong> observations allow to track wave motions in the atmosphere<br />
on the shortest time scales (down to a couple <strong>of</strong><br />
minutes) that can otherwise not be accessed at all. Since<br />
these wave motions are usually excited in the troposphere<br />
and lower stratosphere (Fritts and Alexander, 2003), <strong>PMSE</strong><br />
also provide a suitable tool for the study <strong>of</strong> the coupling <strong>of</strong><br />
different atmospheric altitude regions. As described in the<br />
Atmos. Chem. Phys., 4, 2601–2633, 2004<br />
www.atmos-chem-phys.org/acp/4/2601/
M. Rapp and F. J. Lübken: Review <strong>of</strong> <strong>PMSE</strong> 2627<br />
current manuscript, Doppler spectral width measurements in<br />
<strong>PMSE</strong> further allow for a near continuous characterization<br />
<strong>of</strong> mesospheric turbulence which is a significant contribution<br />
to the energy budget at these altitudes with corresponding<br />
heating rates in excess <strong>of</strong> the radiative input. Finally, apart<br />
from its obvious importance for the study <strong>of</strong> the Earth’s middle<br />
atmosphere, <strong>PMSE</strong> further allow to study basic physical<br />
processes with significance far beyond atmospheric physics:<br />
Being caused by the transport <strong>of</strong> charged particles, electrons<br />
and positive ions due to the turbulent velocity field, the study<br />
<strong>of</strong> <strong>PMSE</strong> also allow insights into the characteristics <strong>of</strong> turbulence<br />
itself and the behaviour <strong>of</strong> complex plasmas which are<br />
both areas <strong>of</strong> current intensive research.<br />
Outlook<br />
As far as future work on <strong>PMSE</strong> is concerned we see the<br />
following promising areas:<br />
1.) Simultaneous and continuous observations <strong>of</strong> mesospheric<br />
turbulence strength (for example with a narrow beam<br />
MF radar as introduced by Hocking, 1983, and recently<br />
further developed by Latteck et al., submitted, 2004 5 ),<br />
<strong>PMSE</strong> (observed with a VHF radar) and aerosol particles<br />
sizes (with a multi-color lidar) should be conducted in<br />
order to check the above described scenario with frequent<br />
turbulent activity and small ice particles in the upper portion<br />
<strong>of</strong> the <strong>PMSE</strong> layer and only occasional turbulent activity but<br />
large ice particles in the lower part <strong>of</strong> the layer. The same<br />
experiment could also yield useful data to check the relation<br />
between spectral width in <strong>PMSE</strong> and turbulent activity.<br />
2.) The recently performed active experiments to modify<br />
<strong>PMSE</strong> with a powerful HF-heater are very promising and<br />
should be further continued and expanded in the future. As<br />
pointed out by Havnes et al. (2003), such experiments have<br />
the potential to teach us more details about the charging<br />
characteristics <strong>of</strong> the ice particles, as well as intrinsic<br />
properties <strong>of</strong> the particles themselves (like radii and number<br />
densities) and the background ionosphere.<br />
3.) Only very little is known so far about the degree <strong>of</strong><br />
isotropy <strong>of</strong> mesospheric turbulence as well as its horizontal<br />
homogeneity. Indications for anisotropy and horizontal<br />
inhomogeneity come from the details <strong>of</strong> radar Doppler<br />
spectra (see Sect. 2.3.2), the observed aspect sensitivity<br />
(see Sect. 2.3.3), and comparisons between electron number<br />
density pr<strong>of</strong>iles and <strong>PMSE</strong> (see Rapp et al., 2003a). In order<br />
to study these issues, sounding rocket payloads carrying<br />
several small ‘daughter’ payloads should be developed that<br />
are to be ejected from the main payload during the traverse<br />
5 Latteck, R., Singer, W., and Hocking, W. K.: Measurement <strong>of</strong><br />
turbulent kinetic energy dissipation rates in the <strong>mesosphere</strong> by a<br />
3 MHz Doppler radar, Adv. Space Res., submitted, 2004.<br />
<strong>of</strong> a <strong>PMSE</strong> layer and hence yield a horizontal picture <strong>of</strong><br />
the turbulent irregularity field. First attempts have been<br />
made before (Blix and Thrane, 1985), however, at that time<br />
experiments were just at the edge <strong>of</strong> feasibility. Today, the<br />
miniaturization <strong>of</strong> electronics allows for a much more robust<br />
design <strong>of</strong> such rocket probes so that the success-rate should<br />
be much better than during previous attempts.<br />
4.) Regarding the microphysics <strong>of</strong> the involved ice<br />
particles the most important remaining open question is<br />
about the actual origin <strong>of</strong> the ice particles. It has long been<br />
assumed that the ice particles nucleate on meteoric smoke<br />
particles, however, direct experimental evidence for the<br />
existence <strong>of</strong> these particles is not available. In order to<br />
confirm the existence <strong>of</strong> these nuclei, Rapp et al. (2003d)<br />
have recently proposed a rocket experiment that is based<br />
on the idea to charge the particles photo-electrically by<br />
the radiation <strong>of</strong> a UV-flashlamp and subsequently detect<br />
them by a sensitive electrometer. Should this attempt be<br />
successful, further work should be done in order to identify<br />
the composition <strong>of</strong> the particles and their creation through<br />
the ablation <strong>of</strong> meteorides in the mesopause region and the<br />
subsequent microphysical processes.<br />
5.) Both from rocket borne experiments (Mitchell et al.,<br />
2001; Croskey et al., 2001; Chesworth and Hale, 1974) and<br />
from the observation <strong>of</strong> so called polar <strong>mesosphere</strong> winter<br />
<strong>echoes</strong> (Kirkwood et al., 2002a, 2003) evidence is emerging<br />
for the existence <strong>of</strong> aerosol particles throughout the entire<br />
<strong>mesosphere</strong> during all times <strong>of</strong> the year. At altitudes below<br />
80 km and outside the <strong>summer</strong> season temperatures are far<br />
to warm to allow for the existence <strong>of</strong> ice particles (Lübken,<br />
1999). Hence, rocket borne experiments should be designed<br />
to identify the nature <strong>of</strong> these aerosol particles that may<br />
have influences on both the local chemistry (through the<br />
possibility for heterogeneous reactions) but also the radiative<br />
transfer and hence the energy budget <strong>of</strong> the middle atmosphere.<br />
This is particularly important for the interpretation<br />
<strong>of</strong> observed significant temperature trends in the <strong>mesosphere</strong><br />
(Beig et al., 2003).<br />
Last not least, it should be mentioned that given the physical<br />
understanding <strong>of</strong> <strong>PMSE</strong> presented in this manuscript,<br />
these layers are a perfect tool to study the dynamics and thermal<br />
structure <strong>of</strong> the mesopause region. Actually, it turns out<br />
that the complex interplay between turbulence, ice particles,<br />
and multipolar diffusion <strong>of</strong> the plasma constituents provides<br />
us with a monitoring tool (with a typical signal to noise ratio<br />
<strong>of</strong> ∼30 dB or three orders <strong>of</strong> magnitude!) that allows<br />
to study the polar <strong>summer</strong> mesopause region almost permanently<br />
by just applying standard radar technique that is nowadays<br />
commercially available. In summary, <strong>PMSE</strong> will also<br />
in the future be an intriguing geophysical phenomenon in its<br />
own right, and a useful tool in order to gather insight into the<br />
complex behaviour <strong>of</strong> the polar <strong>summer</strong> mesopause region.<br />
www.atmos-chem-phys.org/acp/4/2601/ Atmos. Chem. Phys., 4, 2601–2633, 2004
2628 M. Rapp and F. J. Lübken: Review <strong>of</strong> <strong>PMSE</strong><br />
Acknowledgements. This work was supported by the Bundesministerium<br />
für Bildung und Forschung under DLR grants 50 OE 9802<br />
and 50 OE 9901, and the AFO-2000 grant 07ATF41.<br />
Edited by: W. Ward<br />
References<br />
Andreassen, O., Wasberg, C., Fritts, D., and Isler, J.: Gravity wave<br />
breaking in two and three dimensions 1. Model description and<br />
comparison <strong>of</strong> two-dimensional evolutions, J. Geophys. Res., 99,<br />
8095–8108, 1994.<br />
Balsley, B. B. and Huaman, M.: On the relationship between seasonal<br />
occurrence <strong>of</strong> northern hemispheric polar <strong>mesosphere</strong> <strong>summer</strong><br />
<strong>echoes</strong> and mean mesopause temperatures, J. Geophys. Res.,<br />
102, 2021–2024, 1997.<br />
Balsley, B. B., Ecklund, W. L., and Fritts, D. C.: VHF <strong>echoes</strong> form<br />
the high-latitude <strong>mesosphere</strong> and lower thermosphere: observations<br />
and interpretations, J. Atmos. Sci., 40, 2451–2466, 1983.<br />
Balsley, B. B., Woodman, R. F., Sarango, M., Urbina, J., Rodriguez,<br />
R., Ragaini, E., and Carey, J.: Southern-hemisphere <strong>PMSE</strong>:<br />
where are they ?, Geophys. Res. Lett., 20, 1983–1985, 1993.<br />
Balsley, B. B., Woodman, R. F., Sarango, M., Rodriguez, R.,<br />
Urbina, J., Ragaini, E., Carey, J., Huaman, M., and Giraldez, A.:<br />
On the lack <strong>of</strong> southern-hemisphere <strong>PMSE</strong>, J. Geophys. Res.,<br />
100, 11 685–11 693, 1995.<br />
Batchelor, G. K.: Small-scale variation <strong>of</strong> convected quantities like<br />
temperature in a turbulent fluid, J. Fluid Mech., 5, 113–133,<br />
1959.<br />
Becker, E. and Schmitz, G.: Climatological effects <strong>of</strong> orography<br />
and land-sea heating contrasts on the gravity wave driven circulation<br />
<strong>of</strong> the <strong>mesosphere</strong>, J. Atmos. Sci., 60, 103–118, 2003.<br />
Beig, G., Keckhut, P., Lowe, R. P., Roble, R., Mlynczak, M. G.,<br />
Scheer, J., Formichev, V., Offermann, D., French, W. J. R.,<br />
Shepherd, M. G., Semenov, A. I., Remsberg, E. E., She, C. Y.,<br />
Lübken, F. J., Bremer, J., Clemesha, B. R., Stegman, J., Sigernes,<br />
F., and Fadnavis, S.: Review <strong>of</strong> mesospheric temperature trends,<br />
Rev. Geophys., 41 (4), 1015, doi:10.1029/2002RG000121, 2003.<br />
Belova, E., Chilson, P., Rapp, M., and Kirkwood, S.: Electron temperature<br />
dependence <strong>of</strong> <strong>PMSE</strong> power: experimental and modelling<br />
results, Adv. Space Res., 28 (7), 1077–1082, 2001.<br />
Belova, E., Chilson, P. B., Kirkwood, S., and Rietveld, M. T.: The<br />
response time <strong>of</strong> ionospheric heating to <strong>PMSE</strong>, J. Geophys. Res.,<br />
108 (D8), 8446, doi:10.1029/2002JD002385, 2003.<br />
Berger, U. and von Zahn, U.: Icy particles in the <strong>summer</strong> mesopause<br />
region: 3-d modelling <strong>of</strong> their environment and 2-d modelling<br />
<strong>of</strong> their transport, J. Geophys. Res., 107(A11), 1366,<br />
doi:10.1029/2001JA000316, 2002.<br />
Blix, T. A.: The importance <strong>of</strong> charged aerosols in the polar <strong>mesosphere</strong><br />
in connection with noctilucent clouds and polar <strong>mesosphere</strong><br />
<strong>summer</strong> <strong>echoes</strong>, Adv. Space Res., 24/12, 1645–1654,<br />
1999.<br />
Blix, T. A. and Thrane, E. V.: Turbulence characteristics as determined<br />
by cross correlation analysis, Proceedings <strong>of</strong> the 7th<br />
ESA Symposium on European Rocket and Balloon Programmes<br />
and Related Research, Loen, Norway (ESA SP–229), 275–278,<br />
1985.<br />
Blix, T. A., Bekkeng, J. K., Latteck, R., Lübken, F.-J., Rapp,<br />
M., Schöch, A., Singer, W., Smiley, B., and Strelnikov, B.:<br />
Rocket probing <strong>of</strong> <strong>PMSE</strong> and NLC – results from the recent MI-<br />
DAS/MACWAVE campaign, Adv. Space Res., 31, 2061–2067,<br />
2003a.<br />
Blix, T. A., Lie-Svendsen, O., Hoppe, U. P., and Rapp, M.: In situ<br />
observations <strong>of</strong> small scale structure in electrons, positive ions<br />
and charged aerosols in the presence <strong>of</strong> noctilucent clouds and<br />
polar <strong>mesosphere</strong> <strong>summer</strong> <strong>echoes</strong>, Proceedings <strong>of</strong> the 16th ESA<br />
Symposium on European Rocket and Balloon Programmes and<br />
Related Research, St. Gallen, Switzerland (ESA SP–530), 327–<br />
332, 2003b.<br />
Blix, T. A., Rapp, M., and Lübken, F.-J.: Relations between small<br />
scale electron number density fluctuations, radar backscatter and<br />
charged aerosol particles, J. Geophys. Res., 108 (D8), 8450,<br />
doi:10.1029/2002JD002430, 2003c.<br />
Bogucki, D., Domaradzki, J. A., and Yeung, P. K.: Direct numerical<br />
simulations <strong>of</strong> passive scalars with Pr>1 advected by turbulent<br />
flow, J. Fluid Mech., 343, 111–130, 1997.<br />
Bremer, J., H<strong>of</strong>fmann, P., and Hansen, T. L.: Geomagnetic control<br />
<strong>of</strong> polar <strong>mesosphere</strong> <strong>summer</strong> <strong>echoes</strong>, Ann. Geophys., 18, 202–<br />
208, 1996a,<br />
SRef-ID: 1432-0576/ag/2000-18-202.<br />
Bremer, J., H<strong>of</strong>fmann, P., Manson, A., Meek, C., Rüster, R., and<br />
Singer, W.: <strong>PMSE</strong> observations at three different frequencies in<br />
northern Europe during <strong>summer</strong> 1994, Ann. Geophys., 14, 1317–<br />
1327, 1996b,<br />
SRef-ID: 1432-0576/ag/1996-14-1317.<br />
Bremer, J., Hansen, T. L., H<strong>of</strong>fmann, P., and Latteck, R.: Dependence<br />
<strong>of</strong> polar <strong>mesosphere</strong> <strong>summer</strong> <strong>echoes</strong> on solar and geomagnetic<br />
activity, Adv. Space Res., 28, 1071–1076, 2001.<br />
Bremer, J., H<strong>of</strong>fmann, P., Latteck, R., and Singer, W.: Seasonal<br />
and long term variation <strong>of</strong> <strong>PMSE</strong> from VHF radar observations<br />
at Andenes, Norway, J. Geophys. Res., 108 (D8), 8438,<br />
doi:10.1029/2002JD002369, 2003.<br />
Chaxel, Y.: Radar and modelling studies <strong>of</strong> polar mesospheric <strong>summer</strong><br />
<strong>echoes</strong>, PhD thesis, University College London, 1997.<br />
Chesworth, E. T. and Hale, L. C.: Ice particulates in the <strong>mesosphere</strong>,<br />
Geophys. Res. Lett., 1, 347–350, 1974.<br />
Chilson, P. B., Czechowsky, P., Klostermeyer, J., Rüster, R., and<br />
Schmidt, G.: An investigation <strong>of</strong> measured temperature pr<strong>of</strong>iles<br />
and VHF <strong>mesosphere</strong> <strong>summer</strong> <strong>echoes</strong> at midlatitudes, J. Geophys.<br />
Res., 102, 23 819–23 828, 1997.<br />
Chilson, P. B., Belova, E., Rietveld, M., Kirkwood, S., and Hoppe,<br />
U.-P.: First artificially induced modulation <strong>of</strong> <strong>PMSE</strong> using the<br />
EISCAT heating facility, Geophys. Res. Lett., 27, 3801–3804,<br />
2000.<br />
Chilson, P. B., Yu, T. Y., Palmer, R. D., and Kirkwood, S.: Apsect<br />
sensitivity measurements <strong>of</strong> polar <strong>mesosphere</strong> <strong>summer</strong> <strong>echoes</strong><br />
using coherent radar imaging, Ann. Geophys., 20, 213–223,<br />
2002,<br />
SRef-ID: 1432-0576/ag/2002-20-213.<br />
Cho, J., Swartz, W., Kelley, M., and Miller, C.: CUPRI observations<br />
<strong>of</strong> <strong>PMSE</strong> during salvo B <strong>of</strong> NLC-91: evidence <strong>of</strong> both partial<br />
reflection and turbulent scatter, Geophys. Res. Lett., 20, 2291–<br />
2294, 1993.<br />
Cho, J. Y. and Kelley, M. C.: <strong>Polar</strong> <strong>mesosphere</strong> <strong>summer</strong> radar<br />
<strong>echoes</strong>, Rev. Geophys., 31, 243–265, 1993.<br />
Cho, J. Y., Alcala, C. M., Kelley, M. C., and Swartz, W. E.: Further<br />
effects <strong>of</strong> charged aerosols on <strong>summer</strong> mesospheric radar scatter,<br />
J. Atmos. Terr. Phys., 58, 661–672, 1996.<br />
Atmos. Chem. Phys., 4, 2601–2633, 2004<br />
www.atmos-chem-phys.org/acp/4/2601/
M. Rapp and F. J. Lübken: Review <strong>of</strong> <strong>PMSE</strong> 2629<br />
Cho, J. Y. N. and Kelley, M. C.: Enhancement <strong>of</strong> Thomson scatter<br />
by charged aerosols in the polar <strong>mesosphere</strong>: measurements with<br />
a 1.29-GHz radar, Geophys. Res. Lett., 19, 1097–1100, 1992.<br />
Cho, J. Y. N. and Röttger, J.: An updated <strong>review</strong> <strong>of</strong> polar <strong>mesosphere</strong><br />
<strong>summer</strong> <strong>echoes</strong>: Observation, theory, and their relationship<br />
to noctilucent clouds and subvisible aerosols, J. Geophys.<br />
Res., 102, 2001–2020, 1997.<br />
Cho, J. Y. N., Hall, T. M., and Kelley, M. C.: On the role <strong>of</strong> charged<br />
aerosols in polar <strong>mesosphere</strong> <strong>summer</strong> <strong>echoes</strong>, J. Geophys. Res.,<br />
97, 875–886, 1992.<br />
Chu, X., Gardner, C. S., and Roble, R. G.: Lidar studies <strong>of</strong> interannual,<br />
seasonal, and diurnal variations <strong>of</strong> polar mesospheric<br />
clouds at the South pole, J. Geophys. Res., 108 (D8), 8447,<br />
doi:10.1029/2002JD002524, 2003.<br />
Croskey, C., Mitchell, J., Friedrich, M., Torkar, K., Hoppe, U.-P.,<br />
and Goldberg, R.: Electrical structure <strong>of</strong> <strong>PMSE</strong> and NLC regions<br />
during the DROPPS program, Geophys. Res. Lett., 28, 1427–<br />
1430, 2001.<br />
Czechowsky, P. and Rüster, R.: VHF radar observations <strong>of</strong> turbulent<br />
structures in the polar mesopause region, Ann. Geophys.,<br />
15, 1028–1036, 1997,<br />
SRef-ID: 1432-0576/ag/1997-15-1028.<br />
Czechowsky, P., Rüster, R., and Schmidt, G.: Variations <strong>of</strong> mesospheric<br />
structures in different seasons, Geophys. Res. Lett., 6,<br />
459–462, 1979.<br />
Czechowsky, P., Reid, I. M., and Rüster, R.: VHF radar measurements<br />
<strong>of</strong> the aspect sensitivity <strong>of</strong> the <strong>summer</strong> polar mesospaus<br />
<strong>echoes</strong> over Andenes (69 ◦ N, 16 ◦ E), norway, Geophys. Res.<br />
Lett., 15, 1259–1262, 1988.<br />
Dowdy, A., Vincent, R. A., Igarashi, K., Murayama, Y., and Murphy,<br />
D. J.: A comparison <strong>of</strong> mean winds and gravity wave activity<br />
in the northern and southern MLT, Geophys. Res. Lett., 28,<br />
1475–1478, 2001.<br />
Driscoll, R. J. and Kennedy, L. A.: A model for the spectrum <strong>of</strong><br />
passive scalars in an isotropic turbulence field, Phys. Fluids, 28,<br />
72–80, 1985.<br />
Ecklund, W. L. and Balsley, B. B.: Long-term observations <strong>of</strong> the<br />
arctic <strong>mesosphere</strong> with the MST radar at Poker Flat, Alaska, J.<br />
Geophys. Res., 86, 7775–7780, 1981.<br />
Friedrich, M. and Torkar, K. M.: FIRI: A semiempirical model<br />
<strong>of</strong> the lower ionosphere, J. Geophys. Res., 106 (A10), 21 409–<br />
21 418, 2001.<br />
Friedrich, M., Torkar, K. M., Thrane, E. V., and Blix, T. A.: Common<br />
features <strong>of</strong> plasma density pr<strong>of</strong>iles during NLC, Adv. Space<br />
Res., 14 (9), 161–164, 1994.<br />
Fritts, D. C. and Alexander, M. J.: Gravity wave dynamics and<br />
effects in the middle atmosphere, Rev. Geophys., 41 (1), 1003,<br />
doi:10.1029/2001RG000106, 2003.<br />
Gadsden, M.: The north-west europe data on noctilucent clouds: a<br />
survey, J. Atmos. Sol. Terr. Phys., 60, 1163–1174, 1998.<br />
Gadsden, M. and Schröder, W.: Noctilucent clouds, Springer-<br />
Verlag, New York, 1989.<br />
Garcia, R. R. and Solomon, S.: A new numerical model <strong>of</strong> the middle<br />
atmosphere 2. ozone and related species, J. Geophys. Res.,<br />
99, 12 937–12 951, 1994.<br />
Gibson, C. H. and Schwartz, W. H.: The universal equilibrium spectra<br />
<strong>of</strong> turbulent velocity and scalar fields, J. Fluid Mech., 16,<br />
365–384, 1963.<br />
Gibson, C. H., Lyon, R. R., and Hirschsohn, I.: Reaction product<br />
fluctuations in a sphere wake, AIAA J., 8, 1859–1863, 1970.<br />
Gibson-Wilde, D., Werne, J., Fritts, D., and Hill, R.: Direct numerical<br />
simulation <strong>of</strong> VHF radar measurements <strong>of</strong> turbulence in the<br />
<strong>mesosphere</strong>, Radio Sci., 35, 783–798, 2000.<br />
Giebeler, J.: In-situ Messungen zur Untersuchung der Rolle von<br />
Turbulenz bei der Erzeugung von Radar<strong>echoes</strong> in der polaren<br />
Mesosphäre im Sommer, PhD thesis, Universität Bonn, 1995.<br />
Goldberg, R., Kopp, E., Witt, G., and Swartz, W.: An overview <strong>of</strong><br />
NLC-91: A rocket/radar study <strong>of</strong> the polar <strong>summer</strong> <strong>mesosphere</strong>,<br />
Geophys. Res. Lett., 20, 2443–2446, 1993.<br />
Goldberg, R., Pfaff, R., Holzworth, R., Schmidlin, F., Voss, H., Tuzzolino,<br />
A., Croskey, C., Mitchell, J., Friedrich, M., Murtagh, D.,<br />
Gumbel, J., von Zahn, U., Singer, W., and Hoppe, U.-P.: Dropps:<br />
A study <strong>of</strong> the polar <strong>summer</strong> <strong>mesosphere</strong> with rocket, radar and<br />
lidar, Geophys. Res. Lett., 28, 1407–1410, 2001.<br />
Gumbel, J. and Witt, G.: Cluster ions and ice particle nucleation:<br />
positive feedback at the <strong>summer</strong> mesopause, Geophys. Res. Lett.,<br />
29, doi:10.1029/2002GL015146, 2002.<br />
Gumbel, J., Siskind, D. E., Witt, G., Torkar, K. M., and Friedrich,<br />
M.: Influence <strong>of</strong> ice particles on the ion chemistry <strong>of</strong> the polar<br />
<strong>summer</strong> <strong>mesosphere</strong>, J. Geophys. Res., 108 (D8), 8436,<br />
doi:10.1029/2002JD002413, 2003.<br />
Hagfors, T.: Note on the scattering <strong>of</strong> electromagnetic waves from<br />
charged dust particles in a plasma, J. Atmos. Terr. Phys., 54, 333–<br />
338, 1992.<br />
Havnes, O.: <strong>Polar</strong> mesospheric <strong>summer</strong> <strong>echoes</strong> <strong>PMSE</strong> overshoot<br />
effect due to cycling <strong>of</strong> electron heating, J. Geophys. Res., 109,<br />
A02309, doi:10.1029/2003JA010159, 2004.<br />
Havnes, O., de Angelis, U., Bingham, R., Goertz, C. K., Morfill,<br />
G. E., and Tsytovich, V.: On the role <strong>of</strong> dust in the <strong>summer</strong><br />
mesopause, J. Atmos. Terr. Phys., 52, 637–643, 1990.<br />
Havnes, O., Melandsø, F., Hoz, C. L., Aslaksen, T. K., and<br />
Hartquist, T.: Charged dust in the Earth’s mesopause: Effects<br />
on radar backscatter, Phys. Scr., 45, 535–544, 1992.<br />
Havnes, O., Næsheim, L. I., Hartquist, T., Morfill, G. E., Melandsø,<br />
F., Schleicher, B., Trøim, J., Blix, T., and Thrane, E.:<br />
Meter-scale variations <strong>of</strong> the charge carried by mesospheric dust,<br />
Planet. Space Sci., 44, 1191–1194, 1996a.<br />
Havnes, O., Trøim, J., Blix, T., Mortensen, W., Næsheim, L. I.,<br />
Thrane, E., and Tønnesen, T.: First detection <strong>of</strong> charged dust particles<br />
in the Earth’s <strong>mesosphere</strong>, J. Geophys. Res., 101, 10 839–<br />
10 847, 1996b.<br />
Havnes, O., Brattli, A., Aslaksen, T., Singer, W., Latteck, R., Blix,<br />
T., Thrane, E., and Trøim, J.: First common volume observations<br />
<strong>of</strong> layered plasma structures and polar mesospheric <strong>summer</strong><br />
<strong>echoes</strong> by rocket and radar, Geophys. Res. Lett., 28, 1419–1422,<br />
2001.<br />
Havnes, O., LaHoz, C., Naesheim, L., and Rietveld, M.: First observation<br />
<strong>of</strong> the <strong>PMSE</strong> overshoot effect and its use for investigating<br />
the conditions in the <strong>summer</strong> <strong>mesosphere</strong>, Geophys. Res. Lett.,<br />
30 (23), 2229, doi:10.1029/2003GL018429, 2003.<br />
Heisenberg, W.: Zur statistischen Theorie der Turbulenz, Z. Physik,<br />
124, 628–657, 1948.<br />
Hervig, M., Thompson, R., McHugh, M., Gordley, L., Russell III,<br />
J., and Summers, M.: First confirmation that water ice is the<br />
primary component <strong>of</strong> polar mesospheric clouds, Geophys. Res.<br />
Lett., 28, 971–974, 2001.<br />
Hill, R. J.: Nonneutral and quasi-neutral diffusion <strong>of</strong> weakly ionized<br />
multiconstituent plasma, J. Geophys. Res., 83, 989–998, 1978.<br />
www.atmos-chem-phys.org/acp/4/2601/ Atmos. Chem. Phys., 4, 2601–2633, 2004
2630 M. Rapp and F. J. Lübken: Review <strong>of</strong> <strong>PMSE</strong><br />
Hill, R. J., Gibson-Wilde, D. E., Werne, J. A., and Fritts, D. C.:<br />
Turbulence-induced fluctuations in ionization and application to<br />
<strong>PMSE</strong>, Earth Plan. Space, 51, 499–513, 1999.<br />
Hocking, W.: Target parameter estimation, in: Handbook for MAP<br />
volume 30, SCOSTEP, edited by: Fukao, S., Urbana, 228–268,<br />
1989.<br />
Hocking, W. K.: Mesospheric turbulence intensities measured with<br />
a HF radar at 35 ◦ – ii, J. Atmos. Terr. Phys., 45, 89–102, 1983.<br />
Hocking, W. K.: Measurement <strong>of</strong> turbulent energy dissipation rates<br />
in the middle atmosphere by radar techniques: A <strong>review</strong>, Radio<br />
Sci., 20, 1403–1422, 1985.<br />
Hocking, W. K. and Röttger, J.: Studies <strong>of</strong> polar <strong>mesosphere</strong> <strong>summer</strong><br />
<strong>echoes</strong> over EISCAT using calibrated signal strengths and<br />
statistical parameters, Radio Sci., 32, 1425–1444, 1997.<br />
Hocking, W. K., Rüster, R., and Czechowsky, P.: Absolute reflectivities<br />
and aspect sensitivities <strong>of</strong> VHF radio waves scatterers measured<br />
with the SOUSY radar, J. Atmos. Terr. Phys., 48, 131–144,<br />
1986.<br />
Hocking, W. K., Fukao, S., Yamamoto, M., Tsuda, T., and Kato,<br />
S.: Viscosity waves and thermal-conduction waves as a cause<br />
<strong>of</strong> ‘specular’ reflectors in radar studies <strong>of</strong> the atmosphere, Radio<br />
Sci., 26, 1281–1303, 1991.<br />
H<strong>of</strong>fmann, P., Singer, W., and Bremer, J.: Mean seasonal and diurnal<br />
variation <strong>of</strong> <strong>PMSE</strong> and winds from 4 years <strong>of</strong> radar observations<br />
at ALOMAR, Geophys. Res. Lett., 26, 1525–1528, 1999.<br />
Holzworth, R., Pfaff, R., Goldberg, R., Bounds, S., Schmidlin, F.,<br />
Voss, H., Tuzzolino, A., Croskey, C., Mitchell, J., von Cossart,<br />
G., Singer, W., Hoppe, U.-P., Murtagh, D., Witt, G., Gumbel,<br />
J., and Friedrich, M.: Large electric potential perturbations in<br />
<strong>PMSE</strong> during DROPPS, Geophys. Res. Lett., 28, 1435–1438,<br />
2001.<br />
Hoppe, U.-P. and Fritts, D.: On the downward bias in vertical velocity<br />
measurements by VHF radars, Geophys. Res. Lett., 22,<br />
619–622, 1994.<br />
Hoppe, U.-P. and Fritts, D. C.: High resolution measurements <strong>of</strong><br />
vertical velocity with the european incoherent scatter VHF radar<br />
1. motion field characteristics and measurement biases, J. Geophys.<br />
Res., 100, 16 813–16 825, 1995.<br />
Hoppe, U.-P. and Hansen, T. L.: Studies <strong>of</strong> vertical motions in the<br />
upper <strong>mesosphere</strong> using the EISCAT UHF radar, Ann. Geophys.,<br />
6 (2), 181–186, 1988.<br />
Hoppe, U.-P., Hall, C., and Röttger, J.: First observations <strong>of</strong> <strong>summer</strong><br />
polar mesospheric backscatter with a 224 MHz radar, Geophys.<br />
Res. Lett., 15, 28–31, 1988.<br />
Hoppe, U. P., Fritts, D. C., Reid, I. M., Czechowski, P., Hall,<br />
C. M., and Hansen, T. L.: Multiple frequency studies <strong>of</strong> the highlatitude<br />
<strong>summer</strong> <strong>mesosphere</strong>: implications for scattering process,<br />
J. Atmos. Terr. Phys., 52 (10/11), 907–926, 1990.<br />
Hosokawa, K., Ogawa, T., Yukimatu, A. S., Sato, N., and Iyemori,<br />
T.: Statistics <strong>of</strong> antarctic mesospheric <strong>echoes</strong> observed with the<br />
SuperDARN Syowa radar, Geophys. Res. Lett., 31, L02106,<br />
doi:10.1029/2003GL018776, 2004.<br />
Huaman, M. M., Kelley, M. C., Hocking, W. K., and Woodman,<br />
R. F.: <strong>Polar</strong> <strong>mesosphere</strong> <strong>summer</strong> echo studies at 51.5 MHz at<br />
Resolute Bay, Canada: Comparison with Poker Flat results, Radio<br />
Sci., 36, 1823–1837, 2001.<br />
Hunten, D. M., Turco, R. P., and Toon, O. B.: Smoke and dust<br />
particles <strong>of</strong> meteoric origin in the <strong>mesosphere</strong> and stratosphere,<br />
J. Atmos. Sci., 37, 1342–1357, 1980.<br />
Inhester, B., Ulwick, J., Cho, J., Kelley, M., and Schmidt, G.: Consistency<br />
<strong>of</strong> rocket and radar electron density observations: implications<br />
about the anisotropy <strong>of</strong> turbulence, J. Atmos. Terr. Phys.,<br />
52, 855–873, 1990.<br />
Inhester, B., Klostermeyer, J., Lübken, F.-J., and von Zahn, U.: Evidence<br />
for ice clouds causing polar <strong>mesosphere</strong> <strong>summer</strong> <strong>echoes</strong>,<br />
J. Geophys. Res., 99, 20 937–20 954, 1994.<br />
Jensen, E. and Thomas, G. E.: A growth-sedimentation model<br />
<strong>of</strong> polar mesospheric clouds: Comparions with SME measurements,<br />
J. Geophys. Res., 93, 2461–2473, 1988.<br />
Jensen, E. and Thomas, G. E.: Charging <strong>of</strong> mesospheric particles:<br />
implications <strong>of</strong> electron density and particle coagulation, J. Geophys.<br />
Res., 96, 18 603–18 615, 1991.<br />
Jensen, E. and Thomas, G. E.: Numerical simulations <strong>of</strong> the effects<br />
<strong>of</strong> gravity waves on noctilucent clouds, J. Geophys. Res., 99,<br />
3421–3430, 1994.<br />
Jensen, E., Thomas, G. E., and Toon, O. B.: On the diurnal variation<br />
<strong>of</strong> noctilucent clouds, J. Geophys. Res., 94, 14 693–14 702, 1989.<br />
Jesse, O.: Auffallende Erscheinungen am Abendhimmel, Met. Zeit.,<br />
2, 311–312, 1885.<br />
Johannessen, A. and Krankowsky, D.: Positive ion composition<br />
measurement in the upper <strong>mesosphere</strong> and lower thermosphere<br />
at a high latitude during <strong>summer</strong>, J. Geophys. Res., 77, 2888–<br />
2901, 1972.<br />
Karashtin, A. N., abd V. I. Abramov, Y. V. S., Belov, I. F., Bychkov,<br />
V. V., Eryshev, E. B., and Komrakov, G. P.: First HF radar measurements<br />
<strong>of</strong> <strong>summer</strong> mesopause <strong>echoes</strong> at SURA, Ann. Geophys.,<br />
15, 935–941, 1997,<br />
SRef-ID: 1432-0576/ag/1997-15-935.<br />
Kelley, M. C. and Ulwick, J. C.: Large- and small-scale organization<br />
<strong>of</strong> electrons in the high-latitude <strong>mesosphere</strong>: implications <strong>of</strong><br />
the STATE data, J. Geophys. Res., 93, 7001–7008, 1988.<br />
Kelley, M. C., Farley, D. T., and Röttger, J.: The effect <strong>of</strong> cluster<br />
ions on anomalous VHF backscatter from the <strong>summer</strong> polar<br />
<strong>mesosphere</strong>, Geophys. Res. Lett., 14, 1031–1034, 1987.<br />
Kelley, M. C., Huaman, M., Chen, C. Y., Ramos, C., Djuth, F.,<br />
and Kennedy, E.: <strong>Polar</strong> <strong>mesosphere</strong> <strong>summer</strong> observations at HF<br />
frequencies using the HAARP Gakona Ionospheric Observatory,<br />
Geophys. Res. Lett., doi:10.1029/2001GL013411, 2002.<br />
Kirkwood, S. and Rechou, A.: Planetary-wave modulation <strong>of</strong><br />
<strong>PMSE</strong>, Geophys. Res. Lett., 25 (24), 4509-4512, 1998.<br />
Kirkwood, S., Barabash, V., Chilson, P., Rechou, A., Stebel, K.,<br />
Espy, P., Witt, G., and Stegman, J.: The 1997 pmse season – its<br />
relation to wind, temperature and water vapour, Geophys. Res.<br />
Lett., 25, 1867–1870, 1998.<br />
Kirkwood, S., Barabash, V., Belova, E., Nilsson, H., Rao, N.,<br />
Stebel, K., Osepian, A., and Chilson, P. B.: <strong>Polar</strong> <strong>mesosphere</strong><br />
winter <strong>echoes</strong> during solar proton events, Adv. Pol. Up. Atmos.<br />
Res., 16, 111–125, 2002a.<br />
Kirkwood, S., Barabash, V., Brändström, B. U. E., Moström, A.,<br />
Stebel, K., Mitchell, N., and Hocking, W.: Noctlilucent clouds,<br />
<strong>PMSE</strong> and 5-day planetary waves: a case study, Geophys. Res.<br />
Lett., 29 (10), doi:10.1029/2001GL014022, 2002b.<br />
Kirkwood, S., Belova, E., Dalin, P., Fricke, K. H., Blum, U.,<br />
Schmidlin, F.: and Goldberg, R. A., <strong>Polar</strong> <strong>mesosphere</strong> winter<br />
<strong>echoes</strong> during MacWave, Proceedings <strong>of</strong> the 16th ESA Symposium<br />
on European Rocket and Balloon Programmes and Related<br />
Research, St. Gallen, Switzerland (ESA SP–530), 357–362,<br />
2003.<br />
Atmos. Chem. Phys., 4, 2601–2633, 2004<br />
www.atmos-chem-phys.org/acp/4/2601/
M. Rapp and F. J. Lübken: Review <strong>of</strong> <strong>PMSE</strong> 2631<br />
Klostermeyer, J.: A height- and time-dependent model <strong>of</strong> polar<br />
<strong>mesosphere</strong> <strong>summer</strong> <strong>echoes</strong>, J. Geophys. Res., 102, 6715–6727,<br />
1997.<br />
Klostermeyer, J.: On the diurnal variation <strong>of</strong> polar <strong>mesosphere</strong> <strong>summer</strong><br />
<strong>echoes</strong>, Geophys. Res. Lett., 26, 3301–3304, 1999a.<br />
Klostermeyer, J.: Comparison between observed and computed polar<br />
<strong>mesosphere</strong> <strong>summer</strong> <strong>echoes</strong>, J. Geophys. Res., 104, 11 883–<br />
11 890, 1999b.<br />
Kopp, E., Eberhardt, P., Herrmann, U., and Björn, L.: Positive ion<br />
composition <strong>of</strong> the high latitude <strong>summer</strong> D-region with noctilucent<br />
clouds, J. Geophys. Res., 90, 13 041–13 051, 1985.<br />
Körner, U. and Sonnemann, G.: Global 3d-modelling <strong>of</strong> the water<br />
vapor concentration <strong>of</strong> the <strong>mesosphere</strong>/mesopause region and<br />
implications with respect to the NLC region, J. Geophys. Res.,<br />
106, 9639–9651, 2001.<br />
Latteck, R., Singer, W., and Bardey, H.: The ALWIN MST radar:<br />
technical design and performance, Proceedings <strong>of</strong> the 14th ESA<br />
Symposium on European Rocket and Balloon Programmes and<br />
Related Research, Potsdam, Germany (ESA SP–437), 179–184,<br />
1999a.<br />
Latteck, R., Singer, W., and Höffner, J.: Mesosphere <strong>summer</strong><br />
<strong>echoes</strong> as observed by VHF radar at Kühlungsborn, Geophys.<br />
Res. Lett., 26, 1533–1536, 1999b.<br />
Leslie, R. J.: Sky glows, Nature, 33, 245, 1885.<br />
Lie-Svendsen, O., Blix, T. A., Hoppe, U., and Thrane, E.: Modelling<br />
the plasma response to small-scale particle perturbations<br />
in the mesopause region, J. Geophys. Res., 108 (D8), 8442,<br />
doi:10.1029/2002JD002753, 2003.<br />
Lübken, F., Hillert, W., Lehmacher, G., and von Zahn, U.: Experiments<br />
revealing small impact <strong>of</strong> turbulence on the energy budget<br />
<strong>of</strong> the <strong>mesosphere</strong> and lower thermosphere, J. Geophys. Res., 98,<br />
20 369–20 384, 1993a.<br />
Lübken, F.-J.: On the extraction <strong>of</strong> turbulent parameters from atmospheric<br />
density fluctuations, J. Geophys. Res., 97, 20 385–<br />
20 395, 1992.<br />
Lübken, F.-J.: Seasonal variation <strong>of</strong> turbulent energy dissipation<br />
rates at high latitudes as determined by insitu measurements<br />
<strong>of</strong> neutral density fluctuations, J. Geophys. Res., 104, 13 441–<br />
13 456, 1997.<br />
Lübken, F.-J.: Thermal structure <strong>of</strong> the Arctic <strong>summer</strong> <strong>mesosphere</strong>,<br />
J. Geophys. Res., 104, 9135–9149, 1999.<br />
Lübken, F.-J. and Rapp, M.: Modelling <strong>of</strong> particle charging in the<br />
polar <strong>summer</strong> <strong>mesosphere</strong>: Part 2 – application to measurements,<br />
J. Atmos. Sol. Terr. Phys., 63, 771–780, 2001.<br />
Lübken, F.-J., Lehmacher, G., Blix, T., Hoppe, U.-P., Thrane, E.,<br />
Cho, J., and Swartz, W.: First in-situ observations <strong>of</strong> neutral and<br />
plasma density fluctuations within a <strong>PMSE</strong> layer, Geophys. Res.<br />
Lett., 20, 2311–2314, 1993b.<br />
Lübken, F.-J., Giebeler, J., Blix, T., Thrane, E., Singer, W., and<br />
Bremer, J.: In-situ measurement <strong>of</strong> the Schmidt number within a<br />
<strong>PMSE</strong> layer, Geophys. Res. Lett., 21, 1651–1654, 1994.<br />
Lübken, F.-J., Rapp, M., Blix, T., and Thrane, E.: Microphysical<br />
and turbulent measurements <strong>of</strong> the Schmidt number in the vicinity<br />
<strong>of</strong> polar <strong>mesosphere</strong> <strong>summer</strong> <strong>echoes</strong>, Geophys. Res. Lett., 25,<br />
893–896, 1998.<br />
Lübken, F.-J., Jarvis, M. J., and Jones, G. O. L.: First insitu temperature<br />
measurements at the Antarctic <strong>summer</strong> mesopause, Geophys.<br />
Res. Lett., 26, 3581–3584, 1999.<br />
Lübken, F.-J., Rapp, M., and H<strong>of</strong>fmann, P.:<br />
Neutral air turbulence<br />
and temperatures in the vicinity <strong>of</strong> polar <strong>mesosphere</strong><br />
<strong>summer</strong> <strong>echoes</strong>, J. Geophys. Res., 107 (D15),<br />
doi:10.1029/2001JD000915, 2002.<br />
Lübken, F.-J., Zecha, M., Höffner, J., and Röttger, J.: Temperatures,<br />
polar <strong>mesosphere</strong> <strong>summer</strong> <strong>echoes</strong>, and noctlilucent clouds over<br />
Spitsbergen (78 ◦ N), J. Geophys. Res., in print, 2004.<br />
Marti, J. and Mauersberger, K.: A survey and new measurements<br />
<strong>of</strong> ice vapor pressure at temperatures between 170 and 250 K,<br />
Geophys. Res. Lett., 20, 363–366, 1993.<br />
Mauersberger, K. and Krankowsky, D.: Vapor pressure above ice<br />
at temperatures below 170 K, Geophys. Res. Lett., 30 (3), 1121,<br />
doi:10.1029/2002GL016183, 2003.<br />
McHugh, M., Hervig, M., Magill, B., Thompson, R. E., Remsberg,<br />
E., Wrotny, J., and Russell III, J.: Improved mesospheric<br />
temperature, water vapor and polar mesospheric cloud<br />
extinctions from <strong>HAL</strong>OE, Geophys. Res. Lett., 30 (8), 1440,<br />
doi:10.1029/2002GL016859, 2003.<br />
Mertens, C. J., Schmidlin, F. J., Goldberg, R. A., Remsberg, E. E.,<br />
Pesnell, W. D., III, J. M. R., Mlynczak, M. G., Lopez-Puertas,<br />
M., Wintersteiner, P. P., Picard, R. H., Winick, J. R., and Gordley,<br />
L. L.: SABER observations <strong>of</strong> mesospheric temperatures and<br />
comparisons with falling sphere measurements taken during the<br />
2002 <strong>summer</strong> MaCWAVE campaign, Geophys. Res. Lett., 31,<br />
L03105, doi:10.1029/2003GL018605, 2004.<br />
Mitchell, J., Croskey, C., and Goldberg, R.: Evidence for charged<br />
aerosol particles and associated meter-scale structure in identified<br />
<strong>PMSE</strong>/NLC regions, Geophys. Res. Lett., 28, 1423–1426,<br />
2001.<br />
Mitchell, J. D., Croskey, C. L., Goldberg, R. A., and Friedrich, M.:<br />
Charged particles in the polar mesopause region: probe measurements<br />
from the MaCWAVE and DROPPS programs, Proceedings<br />
<strong>of</strong> the 16th ESA Symposium on European Rocket and Balloon<br />
Programmes and Related Research, St. Gallen, Switzerland<br />
(ESA SP–530), 351–356, 2003.<br />
Mlynczak, M. G.: A contemporary assessment <strong>of</strong> the mesospheric<br />
energy bugget, Geophys. Monogr. Ser., 123, 37–52, 2000.<br />
Müllemann, A., Rapp, M., and Lübken, F.-J.: Morphology <strong>of</strong><br />
turbulence in the polar <strong>summer</strong> mesopause region during the<br />
MIDAS/SOLSTICE campaign 2001, Adv. Space Res., 31 (9),<br />
2069–2074, 2003.<br />
Natanson, G. L.: On the theory <strong>of</strong> the charging <strong>of</strong> amicroscopic<br />
aerosol particles as a result <strong>of</strong> capture <strong>of</strong> gas ions, Sov. Phys.<br />
Tech. Phys., (engl. Transl.), 5, 538–551, 1960.<br />
Nussbaumer, V., Fricke, K.-H., Langer, M., Singer, W., and von<br />
Zahn, U.: First simultaneous and common-volume observations<br />
<strong>of</strong> NLC and <strong>PMSE</strong> by lidar and radar, J. Geophys. Res., 101,<br />
19 161–19 167, 1996.<br />
Ogawa, T., Nishitani, N., Sato, H., Yamagishi, H., and Yukimatu,<br />
A. S.: Upper <strong>mesosphere</strong> <strong>echoes</strong> observed with the<br />
Antarctic Syowa HF radar, Geophys. Res. Lett., 29 (7),<br />
doi:10.1029/2001GL014094, 2002.<br />
Ogawa, T., Arnold, N. F., Kirkwood, S., Nishitani, N., and Lester,<br />
M.: Finnland HF and Esrange MST radar observations <strong>of</strong> polar<br />
<strong>mesosphere</strong> <strong>summer</strong> <strong>echoes</strong>, Ann. Geophys., 21, 1047–1055,<br />
2003,<br />
SRef-ID: 1432-0576/ag/2003-21-1047.<br />
Pedersen, A., Troim, J., and Kane, J.: Rocket measurement showing<br />
removal <strong>of</strong> electrons above the mesopause in <strong>summer</strong> at high<br />
latitudes, Planet. Space Sci., 18, 945–947, 1969.<br />
www.atmos-chem-phys.org/acp/4/2601/ Atmos. Chem. Phys., 4, 2601–2633, 2004
2632 M. Rapp and F. J. Lübken: Review <strong>of</strong> <strong>PMSE</strong><br />
Petterson-Reif, B. A. and Andreassen, Ø.: On local isotropy in stratified<br />
homogeneous turbulence, Siam. J. Appl. Math., 64 (1), 309–<br />
321, 2003.<br />
Pfaff, R., Holzworth, R., Goldberg, R., Freudenreich, H., Voss, H.,<br />
Croskey, C., Mitchell, J., Gumbel, J., Bounds, S., Singer, W., and<br />
Latteck, R.: Rocket probe observations <strong>of</strong> electric field irregulatities<br />
in the polar <strong>summer</strong> <strong>mesosphere</strong>, Geophys. Res. Lett., 28,<br />
1431–1434, 2001.<br />
Rapp, M. and Lübken, F.-J.: Modelling <strong>of</strong> positively charged<br />
aerosols in the polar <strong>summer</strong> mesopause region, Earth Plan.<br />
Space, 51, 799–807, 1999.<br />
Rapp, M. and Lübken, F.-J.: Electron temperature control <strong>of</strong> <strong>PMSE</strong>,<br />
Geophys. Res. Lett., 27, 3285–3288, 2000.<br />
Rapp, M. and Lübken, F.-J.: Modelling <strong>of</strong> particle charging in the<br />
polar <strong>summer</strong> <strong>mesosphere</strong>: Part 1 – general results, J. Atmos.<br />
Sol. Terr. Phys., 63, 759–770, 2001.<br />
Rapp, M. and Lübken, F.-J.: On the nature <strong>of</strong> <strong>PMSE</strong>: Electron diffusion<br />
in the vicinity <strong>of</strong> charged particles revisited, J. Geophys.<br />
Res., 108 (D8), 8437, doi:10.1029/2002JD002857, 2003a.<br />
Rapp, M. and Lübken, F.-J.: Comment on “The response time <strong>of</strong><br />
<strong>PMSE</strong> to ionospheric heating” by Belova, E. et al., J. Geophys.<br />
Res., 108 (D23), 4727, doi:10.1029/2003JD003638, 2003b.<br />
Rapp, M., Gumbel, J., and Lübken, F.-J.: Absolute density measurements<br />
in the middle atmosphere, Ann. Geophys., 19, 571–<br />
580, 2001,<br />
SRef-ID: 1432-0576/ag/2001-19-571.<br />
Rapp, M., Gumbel, J., Lübken, F.-J., and Latteck, R.: D-<br />
region electron number density limits for the existence <strong>of</strong> polar<br />
<strong>mesosphere</strong> <strong>summer</strong> <strong>echoes</strong>, J. Geophys. Res., 107 (D14),<br />
doi:10.1029/2001JD001323, 2002a.<br />
Rapp, M., Lübken, F.-J., Müllemann, A., Thomas, G. E., and<br />
Jensen, E. J.: Small scale temperature variations in the vicinity<br />
<strong>of</strong> NLC: Experimental and model results, J. Geophys. Res.,<br />
107 (D19), doi:10.1029/2001JD001241, 2002b.<br />
Rapp, M., Lübken, F.-J., and Blix, T. A.: Small scale density variations<br />
<strong>of</strong> electrons and charged particles in the vicinity <strong>of</strong> polar<br />
<strong>mesosphere</strong> <strong>summer</strong> <strong>echoes</strong>, Atmos. Chem. Phys., 3, 1399–<br />
1407, 2003a,<br />
SRef-ID: 1680-7324/acp/2003-3-1399.<br />
Rapp, M., Lübken, F.-J., and Blix, T. A.: The role <strong>of</strong> charged ice<br />
particles for the creation <strong>of</strong> <strong>PMSE</strong>: a <strong>review</strong> <strong>of</strong> recent developments,<br />
Adv. Space Res., 31 (9), 2033–2043, 2003b.<br />
Rapp, M., Lübken, F.-J., H<strong>of</strong>fmann, P., Latteck, R., Baumgarten,<br />
G., and Blix, T. A.: <strong>PMSE</strong> dependence on aerosol charge number<br />
density and aerosol size, J. Geophys. Res., 108 (D8), 8450,<br />
doi:10.1029/2002JD002650, 2003c.<br />
Rapp, M., Strelnikov, B., Wilms, S., Lübken, F.-J., Gumbel, J., and<br />
Henkel, H.: A new detector for the in situ measurement <strong>of</strong> meteoric<br />
dust particles in the middle atmosphere, Proceedings <strong>of</strong><br />
the 16th ESA Symposium on European Rocket and Balloon Programmes<br />
and Related Research, St. Gallen, Switzerland (ESA<br />
SP–530), 379–384, 2003d.<br />
Rapp, M., Strelnikov, B., Müllemann, A., Lübken, F.-J., and Fritts,<br />
D. C.: Turbulence measurements and implications for gravity<br />
wave dissipation during the macwave/midas rocket program,<br />
Geophys. Res. Lett., in print, doi:10.1029/2003GL019325, 2004.<br />
Reid, G. C.: Ice particles and electron “bite-outs” at the <strong>summer</strong><br />
polar mesopause, J. Geophys. Res., 95, 13 891–13 896, 1990.<br />
Reid, I. M., Czechowsky, P., Rüster, R., and Schmidt, G.: First<br />
VHF radar measurements <strong>of</strong> mesopause <strong>summer</strong> <strong>echoes</strong> at midlatitudes,<br />
Geophys. Res. Lett., 16, 135–138, 1989.<br />
Rietveld, M. T., Kopka, H., and Stubbe, P.: D-region characteristics<br />
deduced from pulsed ionospheric heating under auroral electrojet<br />
conditions, J. Atmos. Terr. Phys., 45, 311–326, 1986.<br />
Roble, R. G. and Dickinson, R. E.: How will changes in carbon<br />
dioxide and methane modify the mean structure <strong>of</strong> the <strong>mesosphere</strong><br />
and thermosphere?, Geophys. Res. Lett., 16, 1441–1444,<br />
1989.<br />
Röttger, J.: Observations <strong>of</strong> the polar D-region and the <strong>mesosphere</strong><br />
with the EISCAT Svalbard Radar and the SOUSY Svalbard<br />
Radar, Mem. Nat. Inst. Pol. Res., 54, 9–20, 2001.<br />
Röttger, J. and LaHoz, C.: Characteristics <strong>of</strong> polar <strong>mesosphere</strong> <strong>summer</strong><br />
<strong>echoes</strong> (<strong>PMSE</strong>) observed with the EISCAT 224 MHz radar<br />
and possible explanations <strong>of</strong> their origin, J. Atmos. Terr. Phys.,<br />
52, 893–906, 1990.<br />
Röttger, J., Hoz, C. L., Kelley, M. C., Hoppe, U.-P., and Hall, C.:<br />
The structure and dynamics <strong>of</strong> polar <strong>mesosphere</strong> <strong>summer</strong> <strong>echoes</strong><br />
observed with the EISCAT 224 MHz radar, Geophys. Res. Lett.,<br />
15, 1353–1356, 1988.<br />
Röttger, J., Rietveld, M. T., LaHoz, C., Hall, C., Kelley, M. C., and<br />
Swartz, W.: <strong>Polar</strong> <strong>mesosphere</strong> <strong>summer</strong> <strong>echoes</strong> observed with the<br />
EISCAT 933-MHz radar and the CUPRI 46.9MHz radar, their<br />
similarity to 224 MHz radar <strong>echoes</strong> and their relation to turbulence<br />
and electron density pr<strong>of</strong>iles, Radio Sci., 25, 671–687,<br />
1990.<br />
Røyrvik, O. and Smith, L. G.: Comparison <strong>of</strong> mesospheric VHF<br />
radar <strong>echoes</strong> and rocket probe electron concentration measurements,<br />
J. Geophys. Res., 89, 9014–9022, 1984.<br />
Rüster, R., Czechnowsky, P., H<strong>of</strong>fmann, P., and Singer, W.: Gravity<br />
wave signatures at mesopause heights, Ann. Geophys., 14, 1186–<br />
1191, 1996,<br />
SRef-ID: 1432-0576/ag/1996-14-1186.<br />
Rüster, R., Röttger, J., Schmidt, G., Czechowski, P., and Klostermeyer,<br />
J.: Observation <strong>of</strong> mesospheric <strong>summer</strong> <strong>echoes</strong> at VHF in<br />
the polar cap region, Geophys. Res. Lett., 28, 1471–1474, 2001.<br />
Sato, T.: Radar principles, in: Handbook for MAP volume 30,<br />
SCOSTEP, edited by: Fukao, S., Urbana, 19–53, 1989.<br />
Schmidlin, F. J.: The inflatable sphere: A technique for the accurate<br />
measurement <strong>of</strong> middle atmosphere temperatures, J. Geophys.<br />
Res., 96, 22 673–22 682, 1991.<br />
Seele, C. and Hartogh, P.: Water vapor <strong>of</strong> the polar middle atmosphere:<br />
Annual variation and <strong>summer</strong> <strong>mesosphere</strong> conditions as<br />
observed by ground-based microwave spectroscopy, Geophys.<br />
Res. Lett., 26, 1517–1520, 1999.<br />
Singer, W., Keuer, D., H<strong>of</strong>fmann, P., Czechowsky, P., and Schmidt,<br />
G.: The ALOMAR-SOUSY-radar: technical design and further<br />
developments, Proceedings <strong>of</strong> the 12th ESA Symposium on European<br />
Rocket and Balloon Programmes and Related Research,<br />
Lillehammer, Norway (ESA SP–370), 409–415, 1995.<br />
Siskind, D. E., Eckermann, S. D., Cormack, J. P., Alexander, M. J.,<br />
and Backmeister, J. T.: Hemispheric differences in the temperature<br />
<strong>of</strong> the <strong>summer</strong>time stratosphere and <strong>mesosphere</strong>, J. Geophys.<br />
Res., 108 (D2), 4051, doi:10.1029/2002JD002095, 2003.<br />
Smiley, B., Robertson, S., Horanyi, M., Blix, T., Rapp, M., Latteck,<br />
R., and Gumbel, J.: Measurement <strong>of</strong> negatively and positively<br />
charged particles inside <strong>PMSE</strong> during MIDAS SOLSTICE 2001,<br />
J. Geophys. Res., 108 (D8), 8444, doi:10.1029/2002JD002425,<br />
2003.<br />
Atmos. Chem. Phys., 4, 2601–2633, 2004<br />
www.atmos-chem-phys.org/acp/4/2601/
M. Rapp and F. J. Lübken: Review <strong>of</strong> <strong>PMSE</strong> 2633<br />
Strelnikov, B., Rapp, M., and Lübken, F.-J.: A new technique for<br />
the analysis <strong>of</strong> neutral air density fluctuations measured in situ<br />
in the middle atmosphere, Geophys. Res. Lett., 30 (20), 2052,<br />
doi:10.1029/2003GL018271, 2003.<br />
Summers, M. E., Gordley, L. L., and McHugh, M. J.: Discovery <strong>of</strong><br />
a water vapor layer in the Arctic <strong>summer</strong> <strong>mesosphere</strong>: Implications<br />
for polar mesospheric clouds, Geophys. Res. Lett., 28 (18),<br />
3601-3604, 2001.<br />
Swartz, W., Cho, J., and Miller, C.: CUPRI system configuration for<br />
NLC-91 and observations <strong>of</strong> <strong>PMSE</strong> during Salvo A, Geophys.<br />
Res. Lett., 20, 2287–2290, 1993.<br />
Tatarskii, V. I.: The Effects <strong>of</strong> the Turbulent Atmosphere on Wave<br />
Propagation, Isr. Program for Sci. Transl., Jerusalem, 1971.<br />
Thomas, G. E.: Mesopheric clouds and the physics <strong>of</strong> the<br />
mesopause region, Rev. Geophys, 29, 553–575, 1991.<br />
Thomas, G. E., Olivero, J. J., Jensen, E. J., Schröder, W., and Toon,<br />
O. B.: Relation between increasing methane and the presence <strong>of</strong><br />
ice clouds at the mesopause, Nature, 338, 490–492, 1989.<br />
Thomas, G. E., Olivero, J. J., DeLand, M., and Shettle, E. P.: A response<br />
to the article by U. von Zahn, “Are noctilucent clouds<br />
truly a miner’s canary <strong>of</strong> global change?”, Eos, Transactions,<br />
American Geophysical Union, 84 (36), 352–353, 2003.<br />
Thomas, L., Astin, I., and Prichard, I. T.: The characteristics<br />
<strong>of</strong> VHF <strong>echoes</strong> from the <strong>summer</strong> mesopause region at midlatitudes,<br />
J. Atmos. Terr. Phys., 54, 969–977, 1992.<br />
Thrane, E. V., Grandal, B., Fla, T., and Brekke, A.: Fine structure<br />
in the ionospheric d-region, Nature, 292, 221–223, 1981.<br />
Thrane, E. V., Blix, T. A., and Lie-Svendsen, Ø.: Can horizontal<br />
advection cause specular partial reflections <strong>of</strong> radio waves in the<br />
ionospheric d-region?, paper presented at the 35th COSPAR Scientific<br />
Assembly, Paris, France, 18–25 July, 2004.<br />
Trakhtengerts, V. Y.: Generation mechanism <strong>of</strong> polar <strong>mesosphere</strong><br />
<strong>summer</strong> <strong>echoes</strong>, J. Geophys. Res., 99, 21 083–21 088, 1994.<br />
Trakhtengerts, V. Y. and Demekhov, A. G.: Nonequilibrium electron<br />
density fluctuations and wave scattering in the <strong>mesosphere</strong>,<br />
J. Atmos. Terr. Phys., 57, 1153–1164, 1995.<br />
Turco, R. P., Toon, O. B., Whitten, R. C., Keesee, R. G., and Hollenbach,<br />
D.: Noctilucent clouds: Simulation studies <strong>of</strong> their genesis,<br />
properties and global influences, Planet. Space Sci., 3, 1147–<br />
1181, 1982.<br />
Ulwick, J. C., Baker, K. D., Kelley, M. C., Balsley, B. B., and<br />
Ecklund, W. L.: Comparison <strong>of</strong> simultaneous MST radar and<br />
electron density probe measurements during STATE, J. Geophys.<br />
Res., 93, 6989–7000, 1988.<br />
Ulwick, J. C., Kelley, M. C., Alcala, C., Blix, T., and Thrane, E. V.:<br />
Evidence for two different structuring and scattering mechanisms<br />
and the associated role <strong>of</strong> aerosols in the polar <strong>summer</strong> <strong>mesosphere</strong>,<br />
Geophys. Res. Lett., 20, 2307–2310, 1993.<br />
von Cossart, G., Fiedler, J., and von Zahn, U.: Size distributions<br />
<strong>of</strong> NLC particles as determined from 3-color observations <strong>of</strong><br />
NLC by ground-based lidar, Geophys. Res. Lett., 26, 1513–1516,<br />
1999.<br />
von Zahn, U.: Are noctilucent clouds truly a “miner’s canary”<br />
<strong>of</strong> global change?, Eos, Transactions, American Geophysical<br />
Union, 84 (28), 261–268, 2003.<br />
von Zahn, U. and Berger, U.: Persistent ice cloud in the mid<strong>summer</strong><br />
upper <strong>mesosphere</strong> at high latitudes: three-dimensional modeling<br />
and cloud interactions with ambient water vapor, J. Geophys.<br />
Res., 108 (D8), 8451, doi:10.1029/2002JD002409, 2003.<br />
von Zahn, U. and Bremer, J.: Simultaneous and common-volume<br />
observations <strong>of</strong> noctilucent clouds and polar <strong>mesosphere</strong> <strong>summer</strong><br />
<strong>echoes</strong>, Geophys. Res. Lett., 26, 1521–1524, 1999.<br />
von Zahn, U., von Cossart, G., Fiedler, J., and Rees, D.: Tidal variations<br />
<strong>of</strong> noctilucent clouds measured at 69 ◦ latitude by groundbased<br />
lidar, Geophys. Res. Lett., 25, 1289–1292, 1998.<br />
von Zahn, U., von Cossart, G., Fiedler, J., Fricke, K., Nelke, G.,<br />
Baumgarten, G., Rees, D., Hauchecorne, A., and Adolfsen, K.:<br />
The ALOMAR Rayleigh/Mie/Raman lidar: Objectives, configuration,<br />
and performance, Ann. Geophys., 18, 815–833, 2000,<br />
SRef-ID: 1432-0576/ag/2000-18-815.<br />
Werne, J. and Fritts, D. C.: Anisotropy in stratified shear layer,<br />
Phys. Chem. Earth (B), 26, 263–268, 2001.<br />
Woodman, R. F. and Guillen, A.: Radar observations <strong>of</strong> winds and<br />
turbulence in the stratosphere and <strong>mesosphere</strong>, J. Atmos. Sci.,<br />
31, 493–505, 1974.<br />
Woodman, R. F., Balsley, B. B., Aquino, F., Flores, L., Vazquez, E.,<br />
Sarango, M., Huaman, M., and Soldi, H.: First observations <strong>of</strong><br />
pmse in antarctica, J. Geophys. Res., 104, 22 577–22 590, 1999.<br />
Woods, J. D., Högström, V., Misme, P., Ottersten, H., and Phillips,<br />
O. M.: Fossil turbulence, Radio Sci., 4, 1365–1367, 1969.<br />
Zadorozhny, A. M., Tyutin, A. A., Witt, G., Wilhelm, N., Wälchli,<br />
U., Cho, J., and Swartz, W. E.: Electric field measurements in the<br />
vicinity <strong>of</strong> noctilucent clouds and <strong>PMSE</strong>, Geophys. Res. Lett.,<br />
20, 2299–2302, 1993.<br />
Zadorozhny, A. M., Vostrikov, A. A., Witt, G., Bragin, O. A.,<br />
Dubov, D. Y., Kazakov, V. G., Kikhtenko, V. N., and Tyutin,<br />
A. A.: Laboratory and in situ evidence for the presence <strong>of</strong> ice<br />
particles in a <strong>PMSE</strong> region, Geophys. Res. Lett., 24, 841–844,<br />
1997.<br />
Zecha, M., Röttger, J., Singer, W., H<strong>of</strong>fmann, P., and Keuer, D.:<br />
Scattering properties <strong>of</strong> <strong>PMSE</strong> irregularities and refinement <strong>of</strong><br />
velocity estimates, J. Atmos. Sol. Terr. Phys., 63, 201–214, 2001.<br />
Zecha, M., Bremer, J., Latteck, R., and Singer, W.: Properties <strong>of</strong><br />
midlatitude <strong>mesosphere</strong> <strong>summer</strong> <strong>echoes</strong> after three seasons <strong>of</strong><br />
VHF radar observations at 54 ◦ N, J. Geophys. Res., 108 (D8),<br />
8439, doi:10.1029/2002JD002442, 2003.<br />
www.atmos-chem-phys.org/acp/4/2601/ Atmos. Chem. Phys., 4, 2601–2633, 2004