effects of traffic analysis zones design on transportation ... - Iasi.cnr.it
effects of traffic analysis zones design on transportation ... - Iasi.cnr.it
effects of traffic analysis zones design on transportation ... - Iasi.cnr.it

You also want an ePaper? Increase the reach of your titles
YUMPU automatically turns print PDFs into web optimized ePapers that Google loves.
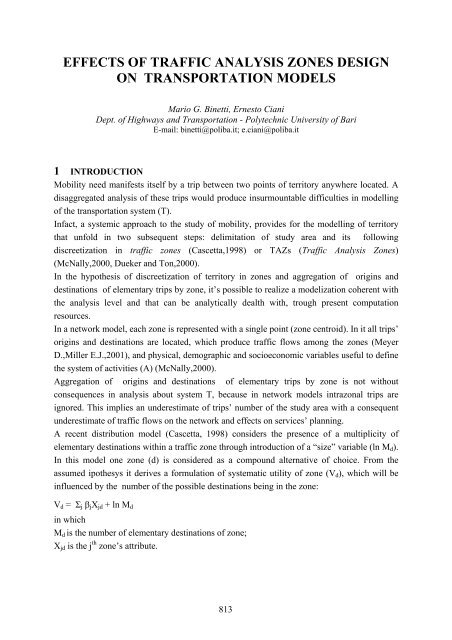
EFFECTS OF TRAFFIC ANALYSIS ZONES DESIGN<br />
ON TRANSPORTATION MODELS<br />
Mario G. Binetti, Ernesto Ciani<br />
Dept. <str<strong>on</strong>g>of</str<strong>on</strong>g> Highways and Transportati<strong>on</strong> - Polytechnic Univers<strong>it</strong>y <str<strong>on</strong>g>of</str<strong>on</strong>g> Bari<br />
E-mail: binetti@poliba.<strong>it</strong>; e.ciani@poliba.<strong>it</strong><br />
1 INTRODUCTION<br />
Mobil<strong>it</strong>y need manifests <strong>it</strong>self by a trip between two points <str<strong>on</strong>g>of</str<strong>on</strong>g> terr<strong>it</strong>ory anywhere located. A<br />
disaggregated <str<strong>on</strong>g>analysis</str<strong>on</strong>g> <str<strong>on</strong>g>of</str<strong>on</strong>g> these trips would produce insurmountable difficulties in modelling<br />
<str<strong>on</strong>g>of</str<strong>on</strong>g> the transportati<strong>on</strong> system (T).<br />
Infact, a systemic approach to the study <str<strong>on</strong>g>of</str<strong>on</strong>g> mobil<strong>it</strong>y, provides for the modelling <str<strong>on</strong>g>of</str<strong>on</strong>g> terr<strong>it</strong>ory<br />
that unfold in two subsequent steps: delim<strong>it</strong>ati<strong>on</strong> <str<strong>on</strong>g>of</str<strong>on</strong>g> study area and <strong>it</strong>s following<br />
discreetizati<strong>on</strong> in <str<strong>on</strong>g>traffic</str<strong>on</strong>g> <str<strong>on</strong>g>z<strong>on</strong>es</str<strong>on</strong>g> (Cascetta,1998) or TAZs (Traffic Analysis Z<strong>on</strong>es)<br />
(McNally,2000, Dueker and T<strong>on</strong>,2000).<br />
In the hypothesis <str<strong>on</strong>g>of</str<strong>on</strong>g> discreetizati<strong>on</strong> <str<strong>on</strong>g>of</str<strong>on</strong>g> terr<strong>it</strong>ory in <str<strong>on</strong>g>z<strong>on</strong>es</str<strong>on</strong>g> and aggregati<strong>on</strong> <str<strong>on</strong>g>of</str<strong>on</strong>g> origins and<br />
destinati<strong>on</strong>s <str<strong>on</strong>g>of</str<strong>on</strong>g> elementary trips by z<strong>on</strong>e, <strong>it</strong>’s possible to realize a modelizati<strong>on</strong> coherent w<strong>it</strong>h<br />
the <str<strong>on</strong>g>analysis</str<strong>on</strong>g> level and that can be analytically dealth w<strong>it</strong>h, trough present computati<strong>on</strong><br />
resources.<br />
In a network model, each z<strong>on</strong>e is represented w<strong>it</strong>h a single point (z<strong>on</strong>e centroid). In <strong>it</strong> all trips’<br />
origins and destinati<strong>on</strong>s are located, which produce <str<strong>on</strong>g>traffic</str<strong>on</strong>g> flows am<strong>on</strong>g the <str<strong>on</strong>g>z<strong>on</strong>es</str<strong>on</strong>g> (Meyer<br />
D.,Miller E.J.,2001), and physical, demographic and socioec<strong>on</strong>omic variables useful to define<br />
the system <str<strong>on</strong>g>of</str<strong>on</strong>g> activ<strong>it</strong>ies (A) (McNally,2000).<br />
Aggregati<strong>on</strong> <str<strong>on</strong>g>of</str<strong>on</strong>g> origins and destinati<strong>on</strong>s <str<strong>on</strong>g>of</str<strong>on</strong>g> elementary trips by z<strong>on</strong>e is not w<strong>it</strong>hout<br />
c<strong>on</strong>sequences in <str<strong>on</strong>g>analysis</str<strong>on</strong>g> about system T, because in network models intraz<strong>on</strong>al trips are<br />
ignored. This implies an underestimate <str<strong>on</strong>g>of</str<strong>on</strong>g> trips’ number <str<strong>on</strong>g>of</str<strong>on</strong>g> the study area w<strong>it</strong>h a c<strong>on</strong>sequent<br />
underestimate <str<strong>on</strong>g>of</str<strong>on</strong>g> <str<strong>on</strong>g>traffic</str<strong>on</strong>g> flows <strong>on</strong> the network and <str<strong>on</strong>g>effects</str<strong>on</strong>g> <strong>on</strong> services’ planning.<br />
A recent distributi<strong>on</strong> model (Cascetta, 1998) c<strong>on</strong>siders the presence <str<strong>on</strong>g>of</str<strong>on</strong>g> a multiplic<strong>it</strong>y <str<strong>on</strong>g>of</str<strong>on</strong>g><br />
elementary destinati<strong>on</strong>s w<strong>it</strong>hin a <str<strong>on</strong>g>traffic</str<strong>on</strong>g> z<strong>on</strong>e through introducti<strong>on</strong> <str<strong>on</strong>g>of</str<strong>on</strong>g> a “size” variable (ln M d ).<br />
In this model <strong>on</strong>e z<strong>on</strong>e (d) is c<strong>on</strong>sidered as a compound alternative <str<strong>on</strong>g>of</str<strong>on</strong>g> choice. From the<br />
assumed ipothesys <strong>it</strong> derives a formulati<strong>on</strong> <str<strong>on</strong>g>of</str<strong>on</strong>g> systematic util<strong>it</strong>y <str<strong>on</strong>g>of</str<strong>on</strong>g> z<strong>on</strong>e (V d ), which will be<br />
influenced by the number <str<strong>on</strong>g>of</str<strong>on</strong>g> the possible destinati<strong>on</strong>s being in the z<strong>on</strong>e:<br />
V d = Σ j β j X jd + ln M d<br />
in which<br />
M d is the number <str<strong>on</strong>g>of</str<strong>on</strong>g> elementary destinati<strong>on</strong>s <str<strong>on</strong>g>of</str<strong>on</strong>g> z<strong>on</strong>e;<br />
X jd is the j th z<strong>on</strong>e’s attribute.
It’s evident, then, as the number, the shape and not last, the homogene<strong>it</strong>y <str<strong>on</strong>g>of</str<strong>on</strong>g> socioec<strong>on</strong>omic<br />
characteristics (SE) ( expressi<strong>on</strong> <str<strong>on</strong>g>of</str<strong>on</strong>g> capac<strong>it</strong>y to generate and to attract trips), produce <str<strong>on</strong>g>effects</str<strong>on</strong>g><br />
<strong>on</strong> the outcomes <str<strong>on</strong>g>of</str<strong>on</strong>g> analyses <str<strong>on</strong>g>of</str<strong>on</strong>g> the system.<br />
In this note, <strong>it</strong> has been carried out a quant<strong>it</strong>ative evalutati<strong>on</strong> about <str<strong>on</strong>g>effects</str<strong>on</strong>g> <str<strong>on</strong>g>of</str<strong>on</strong>g> different levels<br />
<str<strong>on</strong>g>of</str<strong>on</strong>g> aggregati<strong>on</strong> <str<strong>on</strong>g>of</str<strong>on</strong>g> socioec<strong>on</strong>omic and demographic data into TAZs <strong>on</strong> outcomes resulting<br />
from the simulati<strong>on</strong> <str<strong>on</strong>g>of</str<strong>on</strong>g> a transportati<strong>on</strong> system, by proposing a methodology for the <str<strong>on</strong>g>design</str<strong>on</strong>g> <str<strong>on</strong>g>of</str<strong>on</strong>g><br />
z<strong>on</strong>e number and for the aggregati<strong>on</strong> <str<strong>on</strong>g>of</str<strong>on</strong>g> basic spatial un<strong>it</strong>s into homogeneous <str<strong>on</strong>g>z<strong>on</strong>es</str<strong>on</strong>g>.<br />
In Secti<strong>on</strong> 2 is described the state <str<strong>on</strong>g>of</str<strong>on</strong>g> the art about both z<strong>on</strong>ing methodologies and the<br />
influence <str<strong>on</strong>g>of</str<strong>on</strong>g> z<strong>on</strong>ing utilized <strong>on</strong> model’s results. In Secti<strong>on</strong> 3 is described the methodology<br />
adopted to solve TAZ <str<strong>on</strong>g>design</str<strong>on</strong>g> problem; <strong>it</strong> is also reported an applicati<strong>on</strong> <str<strong>on</strong>g>of</str<strong>on</strong>g> the methodology<br />
applied to a real case w<strong>it</strong>h the <str<strong>on</strong>g>analysis</str<strong>on</strong>g> <str<strong>on</strong>g>of</str<strong>on</strong>g> the obtained numerical result; in secti<strong>on</strong> 4 are<br />
reported the c<strong>on</strong>clusive c<strong>on</strong>siderati<strong>on</strong>s useful for following <str<strong>on</strong>g>analysis</str<strong>on</strong>g> and prospectives <str<strong>on</strong>g>of</str<strong>on</strong>g><br />
research <strong>on</strong> this subject.<br />
2 THE STATE OF THE ART ABOUT TERRITORY MODELLING<br />
The Z<strong>on</strong>ing <str<strong>on</strong>g>of</str<strong>on</strong>g> a study area c<strong>on</strong>sists <str<strong>on</strong>g>of</str<strong>on</strong>g> two subsequent phases:<br />
• Defin<strong>it</strong>i<strong>on</strong> <str<strong>on</strong>g>of</str<strong>on</strong>g> spatial aggregati<strong>on</strong> level <str<strong>on</strong>g>of</str<strong>on</strong>g> socioec<strong>on</strong>omic characteristics to achieve<br />
(determinati<strong>on</strong> <str<strong>on</strong>g>of</str<strong>on</strong>g> number <str<strong>on</strong>g>of</str<strong>on</strong>g> <str<strong>on</strong>g>z<strong>on</strong>es</str<strong>on</strong>g>);<br />
• determining shape and dimensi<strong>on</strong> <str<strong>on</strong>g>of</str<strong>on</strong>g> the <str<strong>on</strong>g>z<strong>on</strong>es</str<strong>on</strong>g> respecting the spatial aggregati<strong>on</strong> level<br />
determinated.<br />
To determine the number <str<strong>on</strong>g>of</str<strong>on</strong>g> <str<strong>on</strong>g>z<strong>on</strong>es</str<strong>on</strong>g>, Oppenheim (1995) asserts that no formal methods for<br />
defining the <str<strong>on</strong>g>z<strong>on</strong>es</str<strong>on</strong>g>’ system exist. Characteristics <str<strong>on</strong>g>of</str<strong>on</strong>g> these <str<strong>on</strong>g>z<strong>on</strong>es</str<strong>on</strong>g> must be decided <strong>on</strong> empirical<br />
bases in every specific s<strong>it</strong>uati<strong>on</strong>.<br />
In general the number <str<strong>on</strong>g>of</str<strong>on</strong>g> the <str<strong>on</strong>g>z<strong>on</strong>es</str<strong>on</strong>g> inside the study area is closely c<strong>on</strong>nected to the analisys’<br />
level that we want to achieve.<br />
In short-term operati<strong>on</strong>s management programs, the number <str<strong>on</strong>g>of</str<strong>on</strong>g> <str<strong>on</strong>g>z<strong>on</strong>es</str<strong>on</strong>g> to identify will be high.<br />
This will require the defin<strong>it</strong>i<strong>on</strong> <str<strong>on</strong>g>of</str<strong>on</strong>g> a transportati<strong>on</strong> network more detailed. In <str<strong>on</strong>g>analysis</str<strong>on</strong>g> <str<strong>on</strong>g>of</str<strong>on</strong>g><br />
strategic problems a smaller number <str<strong>on</strong>g>of</str<strong>on</strong>g> <str<strong>on</strong>g>z<strong>on</strong>es</str<strong>on</strong>g>, coherently w<strong>it</strong>h the supply model, is adopted<br />
(E. Cascetta, 1998; J. De D. Ortuzar, L.G. Willumsen, 1994).<br />
Gehlke e Biehl already in 1934 had noted the tendency for correlati<strong>on</strong> coefficients to increase<br />
w<strong>it</strong>h the level <str<strong>on</strong>g>of</str<strong>on</strong>g> aggregati<strong>on</strong> <str<strong>on</strong>g>of</str<strong>on</strong>g> census tracts. Openshaw e Taylor (1979,1981), Openshaw<br />
(1984), Fotheringham e W<strong>on</strong>g (1991) have studied errors that can affect <str<strong>on</strong>g>analysis</str<strong>on</strong>g> based <strong>on</strong><br />
aggregati<strong>on</strong>s <str<strong>on</strong>g>of</str<strong>on</strong>g> spatial data.<br />
Openshaw (1977), in particular, presented a hierarchical heuristic procedure for Automatic<br />
Z<strong>on</strong>ing Problem (AZP) by optimizing an objective functi<strong>on</strong> that was used to measure part<strong>it</strong>i<strong>on</strong><br />
performance in terms <str<strong>on</strong>g>of</str<strong>on</strong>g> a predefined target value.<br />
C. Ding (1998) analyzed impacts <str<strong>on</strong>g>of</str<strong>on</strong>g> socioec<strong>on</strong>omic data aggregati<strong>on</strong> into <str<strong>on</strong>g>traffic</str<strong>on</strong>g> <str<strong>on</strong>g>z<strong>on</strong>es</str<strong>on</strong>g>, at a<br />
nati<strong>on</strong>al scale (South Korea), w<strong>it</strong>h grav<strong>it</strong>ati<strong>on</strong>al demand models. He highlighted as the<br />
number <str<strong>on</strong>g>of</str<strong>on</strong>g> unsimulated intra-z<strong>on</strong>al trips is deeply affected from the number <str<strong>on</strong>g>of</str<strong>on</strong>g> <str<strong>on</strong>g>z<strong>on</strong>es</str<strong>on</strong>g><br />
especially when <strong>it</strong> is small. Ding deduced that existes a number <str<strong>on</strong>g>of</str<strong>on</strong>g> <str<strong>on</strong>g>z<strong>on</strong>es</str<strong>on</strong>g> that isn’t useful to
exceed. In paticular, w<strong>it</strong>h reference to network c<strong>on</strong>gesti<strong>on</strong> index, Ding has remarked that<br />
exists a value <str<strong>on</strong>g>of</str<strong>on</strong>g> the number <str<strong>on</strong>g>of</str<strong>on</strong>g> <str<strong>on</strong>g>z<strong>on</strong>es</str<strong>on</strong>g> under which the results calculated are quiet different<br />
from those obtained increasing <str<strong>on</strong>g>z<strong>on</strong>es</str<strong>on</strong>g>’ number. Moreover, Ding noticed that over another<br />
value there is a l<strong>it</strong>tle change <str<strong>on</strong>g>of</str<strong>on</strong>g> this index.<br />
To physically delim<strong>it</strong> the <str<strong>on</strong>g>z<strong>on</strong>es</str<strong>on</strong>g>, the cr<strong>it</strong>eri<strong>on</strong>s generally adopted (E. Cascetta, 1998; J. De<br />
D. Ortuzar, L.G. Willumsen, 1994) can be summarized in:<br />
1. Omogene<strong>it</strong>y w<strong>it</strong>h respect to the socioc<strong>on</strong>omic characteristics;<br />
2. compactness <str<strong>on</strong>g>of</str<strong>on</strong>g> TAZs’ shapes;<br />
3. respect <str<strong>on</strong>g>of</str<strong>on</strong>g> administrative lim<strong>it</strong>s as census secti<strong>on</strong>s, municipal borders, etc.;<br />
4. respect <str<strong>on</strong>g>of</str<strong>on</strong>g> physical geographic separators placed <strong>on</strong> terr<strong>it</strong>ory as railways, rivers etc.<br />
5. exclusiveness (no doughnut).<br />
The elementary un<strong>it</strong>s in which are spatially organized socioec<strong>on</strong>omic data (basic spatial un<strong>it</strong>s<br />
- BSUs) (You J., Nedović-Budić Z., Kim T.J., 1996) in Italy coincide w<strong>it</strong>h ISTAT (Nati<strong>on</strong>al<br />
Inst<strong>it</strong>ute <str<strong>on</strong>g>of</str<strong>on</strong>g> Statistics) census secti<strong>on</strong>s .<br />
Procedures to <str<strong>on</strong>g>design</str<strong>on</strong>g> <str<strong>on</strong>g>traffic</str<strong>on</strong>g> <str<strong>on</strong>g>z<strong>on</strong>es</str<strong>on</strong>g> through the aggregati<strong>on</strong> <str<strong>on</strong>g>of</str<strong>on</strong>g> BSUs, <strong>on</strong> the base <str<strong>on</strong>g>of</str<strong>on</strong>g> defin<strong>it</strong>e<br />
cr<strong>it</strong>eri<strong>on</strong>s, are numerous and generally follow cluster <str<strong>on</strong>g>analysis</str<strong>on</strong>g>.<br />
To aggregate two BSUs, their c<strong>on</strong>tigu<strong>it</strong>y is necessary but not sufficient c<strong>on</strong>d<strong>it</strong>i<strong>on</strong>. In<br />
determining <str<strong>on</strong>g>traffic</str<strong>on</strong>g> <str<strong>on</strong>g>z<strong>on</strong>es</str<strong>on</strong>g> is difficult that homogene<strong>it</strong>y and spatial c<strong>on</strong>tigu<strong>it</strong>y exigencies can<br />
coincide. Choi and Kim (1995) individuated three fundamental methods w<strong>it</strong>h which you can<br />
face the BSUs’ aggregati<strong>on</strong>:<br />
a) the hierarchical heuristic approach;<br />
b) the statistical approach;<br />
c) the combined geographic informati<strong>on</strong> system (GIS) and statistical approach.<br />
Cluster <str<strong>on</strong>g>analysis</str<strong>on</strong>g> techniques, to obtain the maximum homogene<strong>it</strong>y inside each z<strong>on</strong>e, have<br />
instead been classified by M. Lorr (1983). Am<strong>on</strong>g these, the most efficacious are the<br />
agglomerative <strong>on</strong>e and the <strong>it</strong>erative part<strong>it</strong>i<strong>on</strong>ing <strong>on</strong>e. Jinsoo You, Zorica Nedović-Budić e<br />
Tschangho John Kim (1996) have carried out a <str<strong>on</strong>g>traffic</str<strong>on</strong>g> <str<strong>on</strong>g>z<strong>on</strong>es</str<strong>on</strong>g> <str<strong>on</strong>g>design</str<strong>on</strong>g> method, given the spatial<br />
aggregati<strong>on</strong> level to achieve, which is an hybrid <str<strong>on</strong>g>of</str<strong>on</strong>g> the two. Both methods rely <strong>on</strong> measuring<br />
the similar<strong>it</strong>y between BSUs. Euclidean distance and correlati<strong>on</strong> coefficient are the most<br />
comm<strong>on</strong>ly used similar<strong>it</strong>y measures.<br />
To obtain different z<strong>on</strong>ings, C. Ding adopts an agglomerative methodology. Euclidean<br />
distance is the similar<strong>it</strong>y measure used:<br />
d ij = [Σ r w r (X r i – X r j ) 2 ] 0,5<br />
in which w<strong>it</strong>h X r are indicated the socioec<strong>on</strong>omic attributes <str<strong>on</strong>g>of</str<strong>on</strong>g> each BSUs while w<strong>it</strong>h w are<br />
indicated the weights associated to each attribute.<br />
3 ADOPTED METHODOLOGY<br />
The adopted methodology is articulated in subsequent steps:<br />
1. costructi<strong>on</strong> <str<strong>on</strong>g>of</str<strong>on</strong>g> a geographic informati<strong>on</strong> system which will be <str<strong>on</strong>g>of</str<strong>on</strong>g> support to operati<strong>on</strong>s<br />
<str<strong>on</strong>g>of</str<strong>on</strong>g> BSUs aggregati<strong>on</strong>s;
2. individuati<strong>on</strong> <str<strong>on</strong>g>of</str<strong>on</strong>g> a number n <str<strong>on</strong>g>of</str<strong>on</strong>g> z<strong>on</strong>ings each <strong>on</strong>e characterized by a certain number m<br />
<str<strong>on</strong>g>of</str<strong>on</strong>g> <str<strong>on</strong>g>z<strong>on</strong>es</str<strong>on</strong>g><br />
3. supply model c<strong>on</strong>structi<strong>on</strong><br />
4. calculati<strong>on</strong> <str<strong>on</strong>g>of</str<strong>on</strong>g> n OD matrix, <strong>on</strong>e for each z<strong>on</strong>ing defined<br />
5. assignment to the transportati<strong>on</strong> network <str<strong>on</strong>g>of</str<strong>on</strong>g> the travel demand determinated for each<br />
terr<strong>it</strong>ory model adopted<br />
6. comparis<strong>on</strong> and evaluati<strong>on</strong> <str<strong>on</strong>g>of</str<strong>on</strong>g> numeric results obteined w<strong>it</strong>h the propos<strong>it</strong>i<strong>on</strong> <str<strong>on</strong>g>of</str<strong>on</strong>g> a<br />
methodology for planning the number <str<strong>on</strong>g>of</str<strong>on</strong>g> <str<strong>on</strong>g>z<strong>on</strong>es</str<strong>on</strong>g> to use in similar cases<br />
In the first and sec<strong>on</strong>d step, <strong>it</strong> is described the methodology adopted to aggregate<br />
socioec<strong>on</strong>omic data into homogenous <str<strong>on</strong>g>traffic</str<strong>on</strong>g> <str<strong>on</strong>g>z<strong>on</strong>es</str<strong>on</strong>g>.<br />
The study area c<strong>on</strong>sidered for the applicati<strong>on</strong> coincides w<strong>it</strong>h the whole municipal terr<strong>it</strong>ory <str<strong>on</strong>g>of</str<strong>on</strong>g><br />
the c<strong>it</strong>y <str<strong>on</strong>g>of</str<strong>on</strong>g> Bari. The area in this way delim<strong>it</strong>ed has an extent <str<strong>on</strong>g>of</str<strong>on</strong>g> 116 Km 2 and a resident<br />
populati<strong>on</strong> <str<strong>on</strong>g>of</str<strong>on</strong>g> about 342.300 accouting to the 1991 census. The road transportati<strong>on</strong> network<br />
has been modeled w<strong>it</strong>h 677 real nodes and 1475 links.<br />
3.1 Notati<strong>on</strong>s<br />
In the c<strong>on</strong>tinuati<strong>on</strong>, will be denoted w<strong>it</strong>h:<br />
i,j two generic BSUs localized in study area<br />
X k i the K th attribute <str<strong>on</strong>g>of</str<strong>on</strong>g> i th BSU<br />
d ij the euclidean distance from I and j<br />
β the generic weight given to the attributes used for aggregating BSUs into <str<strong>on</strong>g>z<strong>on</strong>es</str<strong>on</strong>g><br />
G = G(N,L) the graph associated to transportati<strong>on</strong> network<br />
N the set <str<strong>on</strong>g>of</str<strong>on</strong>g> nodes <str<strong>on</strong>g>of</str<strong>on</strong>g> the network<br />
L the set <str<strong>on</strong>g>of</str<strong>on</strong>g> links <str<strong>on</strong>g>of</str<strong>on</strong>g> the network = {(a,b)} w<strong>it</strong>h a,b є N<br />
c l the transportati<strong>on</strong> link cost: c l = α 1 t runl +α 2 t wl<br />
α y the generic homogene<strong>it</strong>y coefficient<br />
f l the link flow<br />
C the path cost vector<br />
A the link-path incidence matrix<br />
C the link cost vector<br />
C NA the n<strong>on</strong> add<strong>it</strong>ative path cost vector<br />
F the path flow vector<br />
f link flow vector<br />
Gs the grade <str<strong>on</strong>g>of</str<strong>on</strong>g> saturati<strong>on</strong><br />
d od the demand flow from the origin o to the destinati<strong>on</strong> d<br />
m the transport mode<br />
s the purpose <str<strong>on</strong>g>of</str<strong>on</strong>g> the trip<br />
h the time period <str<strong>on</strong>g>of</str<strong>on</strong>g> the trip<br />
k the path <str<strong>on</strong>g>of</str<strong>on</strong>g> the trip<br />
m C (s) the mean number <str<strong>on</strong>g>of</str<strong>on</strong>g> trips for purpose s
N o the number <str<strong>on</strong>g>of</str<strong>on</strong>g> users in z<strong>on</strong>e o<br />
3.2 The Geographic Informati<strong>on</strong> System<br />
A general chatacteristic <str<strong>on</strong>g>of</str<strong>on</strong>g> Geographic Informati<strong>on</strong> Systems is their structure formed by<br />
layers overlapped. To each <str<strong>on</strong>g>of</str<strong>on</strong>g> these layers <strong>on</strong>ly a level <str<strong>on</strong>g>of</str<strong>on</strong>g> informati<strong>on</strong> is associated.<br />
The first layer, <strong>on</strong> which all the others are based, holds socioec<strong>on</strong>omic informati<strong>on</strong>s <str<strong>on</strong>g>of</str<strong>on</strong>g> the<br />
study area subdivided into census secti<strong>on</strong>s (1429 for the c<strong>it</strong>y <str<strong>on</strong>g>of</str<strong>on</strong>g> Bari accounting to the 1991<br />
census). Their elaborati<strong>on</strong> by aggregati<strong>on</strong> procedures, allows to determine TAZs’<br />
socioec<strong>on</strong>omic characteristics, useful to specify systematic util<strong>it</strong>ies associated to <str<strong>on</strong>g>z<strong>on</strong>es</str<strong>on</strong>g> in<br />
demand models.<br />
The attributes immediately available from ISTAT census data, are: employees in industrial<br />
sector, employees in the public services sector, employees in the private services sectors,<br />
resident populati<strong>on</strong> older than 14 years, resident families, workers in industrial sector,<br />
workers in the public services sector, workers in the private services sectors, workers in the<br />
trade sector, resident populati<strong>on</strong>.<br />
Other attributes can be associated: places in upper sec<strong>on</strong>dary schools, places in lower<br />
sec<strong>on</strong>dary schools, places in primary schools etc. Moreover, for each z<strong>on</strong>ing the routines <str<strong>on</strong>g>of</str<strong>on</strong>g><br />
GIS s<str<strong>on</strong>g>of</str<strong>on</strong>g>tware allow to determine and to associate to elements some phisical characteristics <str<strong>on</strong>g>of</str<strong>on</strong>g><br />
census secti<strong>on</strong>s, as area or the geographic co-ordinates <str<strong>on</strong>g>of</str<strong>on</strong>g> z<strong>on</strong>e’s centroid.<br />
The sec<strong>on</strong>d layer holds the cartography <str<strong>on</strong>g>of</str<strong>on</strong>g> study area, georeferenced, that allows to locate the<br />
physical separators (railways, rivers, etc) and the road network.<br />
On the third and the forth layer are rappresented respectively the graph <str<strong>on</strong>g>of</str<strong>on</strong>g> the network and the<br />
discreetizati<strong>on</strong> <str<strong>on</strong>g>of</str<strong>on</strong>g> study area into <str<strong>on</strong>g>traffic</str<strong>on</strong>g> <str<strong>on</strong>g>z<strong>on</strong>es</str<strong>on</strong>g>.<br />
3.3 Z<strong>on</strong>ing <str<strong>on</strong>g>of</str<strong>on</strong>g> study area<br />
In the c<strong>on</strong>tinuati<strong>on</strong>, are explained the cr<strong>it</strong>eri<strong>on</strong>s adopted for the c<strong>on</strong>structi<strong>on</strong> <str<strong>on</strong>g>of</str<strong>on</strong>g> a generic<br />
z<strong>on</strong>ing and the procedure <str<strong>on</strong>g>of</str<strong>on</strong>g> clustering used to c<strong>on</strong>struct n z<strong>on</strong>ing systems each<strong>on</strong>e<br />
characterized by a number m <str<strong>on</strong>g>of</str<strong>on</strong>g> <str<strong>on</strong>g>z<strong>on</strong>es</str<strong>on</strong>g>.<br />
At the beginnig a z<strong>on</strong>ing characterized by an exiguous number <str<strong>on</strong>g>of</str<strong>on</strong>g> <str<strong>on</strong>g>z<strong>on</strong>es</str<strong>on</strong>g> is c<strong>on</strong>sidered through<br />
a procedure <str<strong>on</strong>g>of</str<strong>on</strong>g> aggregati<strong>on</strong> <str<strong>on</strong>g>of</str<strong>on</strong>g> the BSUs based <strong>on</strong> the <strong>on</strong>ly cr<strong>it</strong>eri<strong>on</strong> <str<strong>on</strong>g>of</str<strong>on</strong>g> physical separators. In<br />
subsequent phases, each z<strong>on</strong>e is further <strong>on</strong> subdivided into smaller <str<strong>on</strong>g>z<strong>on</strong>es</str<strong>on</strong>g>. The cr<strong>it</strong>eri<strong>on</strong> to<br />
adopt in aggregati<strong>on</strong> <str<strong>on</strong>g>of</str<strong>on</strong>g> census secti<strong>on</strong>s, in these subsequent phases, must guarantee the<br />
c<strong>on</strong>structi<strong>on</strong> <str<strong>on</strong>g>of</str<strong>on</strong>g> <str<strong>on</strong>g>z<strong>on</strong>es</str<strong>on</strong>g> that show characteristics <str<strong>on</strong>g>of</str<strong>on</strong>g> homogene<strong>it</strong>y w<strong>it</strong>h respect to <strong>on</strong>e o more<br />
attributes. The cr<strong>it</strong>eri<strong>on</strong> <str<strong>on</strong>g>of</str<strong>on</strong>g> compactness is verified visually and w<strong>it</strong>h semplic<strong>it</strong>y using GIS<br />
technology.<br />
W<strong>it</strong>h this object in view, a procedure <str<strong>on</strong>g>of</str<strong>on</strong>g> K-means cluster <str<strong>on</strong>g>analysis</str<strong>on</strong>g> is used. This technique, to<br />
evaluate dishomogene<strong>it</strong>y am<strong>on</strong>g <str<strong>on</strong>g>z<strong>on</strong>es</str<strong>on</strong>g> w<strong>it</strong>h respect to attributes, uses euclidean distance:<br />
d ij = (Σ k (X i k - X j k ) 2 ) 0,5
The attributes X k i c<strong>on</strong>sidered in this <str<strong>on</strong>g>analysis</str<strong>on</strong>g> are: number <str<strong>on</strong>g>of</str<strong>on</strong>g> employees, number <str<strong>on</strong>g>of</str<strong>on</strong>g> resident<br />
families, resident populati<strong>on</strong>, area <str<strong>on</strong>g>of</str<strong>on</strong>g> BSUs, geographic co-ordinates <str<strong>on</strong>g>of</str<strong>on</strong>g> the barycentre <str<strong>on</strong>g>of</str<strong>on</strong>g> the<br />
BSUs. The number <str<strong>on</strong>g>of</str<strong>on</strong>g> families is directly linked to the number <str<strong>on</strong>g>of</str<strong>on</strong>g> cars possessed while the<br />
geographic co-ordinates are indispensable to evaluate the c<strong>on</strong>tigu<strong>it</strong>y am<strong>on</strong>g the census<br />
secti<strong>on</strong>s.<br />
To each attribute X k i a wheight βi is associated, <strong>on</strong> the base <str<strong>on</strong>g>of</str<strong>on</strong>g> his relative importance, and a<br />
procedure <str<strong>on</strong>g>of</str<strong>on</strong>g> standardizati<strong>on</strong> is adopted to make sure that the results is not affected by the size<br />
<str<strong>on</strong>g>of</str<strong>on</strong>g> each attribute.<br />
C<strong>on</strong>sequently the expressi<strong>on</strong> <str<strong>on</strong>g>of</str<strong>on</strong>g> distance will become:<br />
d ij = [β (Z 1j -Z 1i ) 2 + β 2 (Z 2j -Z 2i ) 2 +β 3 (Z 3j -Z 3i ) 2 +β 4 (Z 4j -Z 4i ) 2 +β ν [(X j -X i ) 2 +( Y j -Y i ) 2 ]] 0.5<br />
• Z 1 standardized variable <str<strong>on</strong>g>of</str<strong>on</strong>g> resident populati<strong>on</strong> (β 1 = 0,15)<br />
• Z 2 standardized variable <str<strong>on</strong>g>of</str<strong>on</strong>g> employees (β 2 = 0,15)<br />
• Z 3 standardized variable <str<strong>on</strong>g>of</str<strong>on</strong>g> number <str<strong>on</strong>g>of</str<strong>on</strong>g> families (β 3 = 0,1)<br />
• Z 4 standardized variable <str<strong>on</strong>g>of</str<strong>on</strong>g> the area <str<strong>on</strong>g>of</str<strong>on</strong>g> BSU (β 4 = 0,05)<br />
• X j , Y j standardized catographic co-ordinates <str<strong>on</strong>g>of</str<strong>on</strong>g> the barycentre <str<strong>on</strong>g>of</str<strong>on</strong>g> the area <str<strong>on</strong>g>of</str<strong>on</strong>g> the BSU<br />
(β ν = 0,55).<br />
The wheights β showed represent an hypothesis in which the cr<strong>it</strong>eri<strong>on</strong> <str<strong>on</strong>g>of</str<strong>on</strong>g> c<strong>on</strong>tigu<strong>it</strong>y is<br />
privileged. The results obtained in the applicati<strong>on</strong> w<strong>it</strong>h the adopti<strong>on</strong> <str<strong>on</strong>g>of</str<strong>on</strong>g> this values are<br />
coherent w<strong>it</strong>h the terr<strong>it</strong>orial real<strong>it</strong>y used in applicati<strong>on</strong>; a sens<strong>it</strong>iv<strong>it</strong>y <str<strong>on</strong>g>analysis</str<strong>on</strong>g> will can be<br />
developed to specify the value to attribute case by case.<br />
The simulati<strong>on</strong>s, for the <str<strong>on</strong>g>analysis</str<strong>on</strong>g> <str<strong>on</strong>g>of</str<strong>on</strong>g> different alternatives <str<strong>on</strong>g>of</str<strong>on</strong>g> z<strong>on</strong>ing, have been ten,<br />
characterized by a number <str<strong>on</strong>g>of</str<strong>on</strong>g> 10, 15, 20, 30, 40, 50, 60, 65, 70, 75 <str<strong>on</strong>g>z<strong>on</strong>es</str<strong>on</strong>g>.<br />
Two cases are shown in the following figures.<br />
Figura 1. 10 Traffic Analysis Z<strong>on</strong>es<br />
Figura 2. 50 Traffic Analysis Z<strong>on</strong>es<br />
3.4 Modelling <str<strong>on</strong>g>of</str<strong>on</strong>g> transportati<strong>on</strong> supply system<br />
To analyze and to compare the ten hypothesis <str<strong>on</strong>g>of</str<strong>on</strong>g> z<strong>on</strong>ing, <strong>it</strong> is necessary the c<strong>on</strong>structi<strong>on</strong> <str<strong>on</strong>g>of</str<strong>on</strong>g> a<br />
supply model, which is c<strong>on</strong>sidered c<strong>on</strong>stant by changing the level <str<strong>on</strong>g>of</str<strong>on</strong>g> discreetizati<strong>on</strong> <str<strong>on</strong>g>of</str<strong>on</strong>g><br />
terr<strong>it</strong>ory and a demand vector d variable w<strong>it</strong>h the number <str<strong>on</strong>g>of</str<strong>on</strong>g> <str<strong>on</strong>g>z<strong>on</strong>es</str<strong>on</strong>g>.
The supply system, relative to the road network, is modeled w<strong>it</strong>h a synchr<strong>on</strong>ic network<br />
(Cascetta, 1998).<br />
The graph associated to the road network is c<strong>on</strong>structed through a s<str<strong>on</strong>g>of</str<strong>on</strong>g>tware GIS w<strong>it</strong>h the<br />
acquis<strong>it</strong>i<strong>on</strong> <str<strong>on</strong>g>of</str<strong>on</strong>g> the cartography normally available. This tool allows, w<strong>it</strong>h extreme facil<strong>it</strong>y, to<br />
select the transportati<strong>on</strong> infrastructures which have an important role in c<strong>on</strong>necting the <str<strong>on</strong>g>traffic</str<strong>on</strong>g><br />
<str<strong>on</strong>g>z<strong>on</strong>es</str<strong>on</strong>g> in the study area and external <str<strong>on</strong>g>z<strong>on</strong>es</str<strong>on</strong>g>.<br />
GIS technology allows, besides, to associate to each element <str<strong>on</strong>g>of</str<strong>on</strong>g> the graph all the informati<strong>on</strong>s<br />
useful to describe the network: identificati<strong>on</strong> codes, cost functi<strong>on</strong>s, prominent flows, etc.<br />
W<strong>it</strong>h the hypothesis <str<strong>on</strong>g>of</str<strong>on</strong>g> c<strong>on</strong>gested network, the supply model is expressed formally by a<br />
relati<strong>on</strong> that bind the link cost w<strong>it</strong>h path flows and the link flows w<strong>it</strong>h the path flows :<br />
C = A T c(AF) + C NA<br />
f = A F<br />
c l = c l (f)<br />
In the applicati<strong>on</strong>, n<strong>on</strong>-add<strong>it</strong>ive costs C NA have not been c<strong>on</strong>sidered and as cost functi<strong>on</strong> has<br />
been adopted a separable <strong>on</strong>e c l = c l (f l ) .<br />
The graph associated to the road network <str<strong>on</strong>g>of</str<strong>on</strong>g> the c<strong>it</strong>y <str<strong>on</strong>g>of</str<strong>on</strong>g> Bari is rappresented w<strong>it</strong>h 677 nodes<br />
and 1475 network links. The internal centroids and the relative c<strong>on</strong>nectors are variable w<strong>it</strong>h<br />
the number <str<strong>on</strong>g>of</str<strong>on</strong>g> <str<strong>on</strong>g>z<strong>on</strong>es</str<strong>on</strong>g> c<strong>on</strong>sidered in each simulati<strong>on</strong>. The centroids outside the study area, in<br />
number <str<strong>on</strong>g>of</str<strong>on</strong>g> 11 c<strong>on</strong>stant for each simulati<strong>on</strong> <str<strong>on</strong>g>of</str<strong>on</strong>g> z<strong>on</strong>ing, are located about road secti<strong>on</strong>s <str<strong>on</strong>g>of</str<strong>on</strong>g> access<br />
to the study area and linked to the network w<strong>it</strong>h c<strong>on</strong>nectors.<br />
3.5 The estimate <str<strong>on</strong>g>of</str<strong>on</strong>g> transportati<strong>on</strong> demand and assignment to the network<br />
The vector <str<strong>on</strong>g>of</str<strong>on</strong>g> demand d, variable for each simulati<strong>on</strong>, is estimated through a partial share<br />
model risulted from the applicati<strong>on</strong> <str<strong>on</strong>g>of</str<strong>on</strong>g> four sub-models: emissi<strong>on</strong> model, distribu<strong>it</strong>i<strong>on</strong> model,<br />
modal spl<strong>it</strong> model and path choice model:<br />
d od (s,m,k)=d o·(s,h)[SE,T]·p(d/osh) [SE,T]·p(m/odsh) [SE,T] ·p(k/modsh) [SE,T]<br />
For the model <str<strong>on</strong>g>of</str<strong>on</strong>g> emissi<strong>on</strong> is utilized a descriptive model: d o·(s) = Σ C m C (s)·N o (C).<br />
For distribu<strong>it</strong>i<strong>on</strong> and modal, feet and cars, spl<strong>it</strong> models are utilized log<strong>it</strong> models:<br />
p(d/os) = exp(αV d )/Σ d’ exp(αV d’ )<br />
p(m/ods) = exp(αV m )/Σ m’ exp(αV m’ )<br />
In both them the systematic util<strong>it</strong>y V d is valuable as a linear combinati<strong>on</strong> <str<strong>on</strong>g>of</str<strong>on</strong>g> attributes peculiar<br />
<str<strong>on</strong>g>of</str<strong>on</strong>g> the destinati<strong>on</strong> z<strong>on</strong>e d or <str<strong>on</strong>g>of</str<strong>on</strong>g> the mode m, <strong>on</strong> the base <str<strong>on</strong>g>of</str<strong>on</strong>g> parameters γ k :<br />
V = Σ k γ k X k<br />
For the model <str<strong>on</strong>g>of</str<strong>on</strong>g> choice <str<strong>on</strong>g>of</str<strong>on</strong>g> the path, <strong>on</strong> the c<strong>on</strong>trary, the prob<strong>it</strong> model is utilized.<br />
The risult <str<strong>on</strong>g>of</str<strong>on</strong>g> the applicati<strong>on</strong> <str<strong>on</strong>g>of</str<strong>on</strong>g> the four step model are so much vectors <str<strong>on</strong>g>of</str<strong>on</strong>g> demand as TAZ<br />
alternatives.
C<strong>on</strong>stru<strong>it</strong>ed the supply model and the demand model, the phase <str<strong>on</strong>g>of</str<strong>on</strong>g> assignment, in hypothesis<br />
<str<strong>on</strong>g>of</str<strong>on</strong>g> rigid demand, is carried out. The approach followed for the assignment is the User<br />
Equilibrium <strong>on</strong>e, for c<strong>on</strong>gested network, w<strong>it</strong>h a SUE model<br />
f * = f SNL (c(f * );d) f * є S f<br />
and a resolutive algor<strong>it</strong>hm MSA-FA.<br />
3.6 Comparis<strong>on</strong> and evaluati<strong>on</strong> <str<strong>on</strong>g>of</str<strong>on</strong>g> numeric results.<br />
For each TAZ alternatives produced the <str<strong>on</strong>g>traffic</str<strong>on</strong>g> flows <strong>on</strong> each link <str<strong>on</strong>g>of</str<strong>on</strong>g> the network have been<br />
estimated and network performance indicators as the total cost (TC = C T F), the average cost<br />
(AC = C T F/1 T F), the c<strong>on</strong>gesti<strong>on</strong> index PCP (I c =Σ l [(Gs l·f l)/Σ f l]), the number <str<strong>on</strong>g>of</str<strong>on</strong>g> satured links<br />
(Gs > 80%).<br />
The results obteined for these indicators are represented in figures 3, 4, and 5 and are<br />
indicated in the subsequent table.<br />
n. <str<strong>on</strong>g>z<strong>on</strong>es</str<strong>on</strong>g> 10 15 20 30 40 50 60 65 70 75<br />
Total cost (hour) 75127 86750 18197 17847 15196 16907 16278 13898 14183 13348<br />
Average cost (sec) 3734 4749 936 928 805 901 838 715 715 696<br />
Average cost w<strong>it</strong>h C=0 940 772 616 569 588 614 622 501 492 492<br />
Number <str<strong>on</strong>g>of</str<strong>on</strong>g> satured links 341 200 140 158 89 99 86 86 99 101<br />
Indicator <str<strong>on</strong>g>of</str<strong>on</strong>g> c<strong>on</strong>gesti<strong>on</strong> PCP (%) 88.74 83.23 53.91 56.73 48.25 50.81 48.39 47.88 48.45 47.79<br />
Table 1. Network performance indicators<br />
The <str<strong>on</strong>g>analysis</str<strong>on</strong>g> shows a threshold <str<strong>on</strong>g>of</str<strong>on</strong>g> number <str<strong>on</strong>g>of</str<strong>on</strong>g> <str<strong>on</strong>g>z<strong>on</strong>es</str<strong>on</strong>g> bey<strong>on</strong>d which the values <str<strong>on</strong>g>of</str<strong>on</strong>g> network<br />
performace indicators present a stabil<strong>it</strong>y <str<strong>on</strong>g>of</str<strong>on</strong>g> results included in a range <str<strong>on</strong>g>of</str<strong>on</strong>g> ±20% aroud the<br />
mean between the maximum and the minimum <str<strong>on</strong>g>of</str<strong>on</strong>g> results obtained in the simulati<strong>on</strong>s. This<br />
variabil<strong>it</strong>y <str<strong>on</strong>g>of</str<strong>on</strong>g> results is coherent w<strong>it</strong>h the stocastic<strong>it</strong>y <str<strong>on</strong>g>of</str<strong>on</strong>g> the model <str<strong>on</strong>g>of</str<strong>on</strong>g> assignment used<br />
(parameter <str<strong>on</strong>g>of</str<strong>on</strong>g> the variance <str<strong>on</strong>g>of</str<strong>on</strong>g> the costs <str<strong>on</strong>g>of</str<strong>on</strong>g> the Prob<strong>it</strong> model equal to ϑ=10 s , n. SNL<br />
<strong>it</strong>erati<strong>on</strong>s= 50) and <str<strong>on</strong>g>of</str<strong>on</strong>g> the stop test <str<strong>on</strong>g>of</str<strong>on</strong>g> the algor<strong>it</strong>hm MSA (M.G. Binetti,1996).<br />
For the c<strong>it</strong>y <str<strong>on</strong>g>of</str<strong>on</strong>g> Bari the threshold is individualized in 20 <str<strong>on</strong>g>z<strong>on</strong>es</str<strong>on</strong>g>.<br />
The results, moreover, shows coherence w<strong>it</strong>h other <str<strong>on</strong>g>analysis</str<strong>on</strong>g> effected in the case <str<strong>on</strong>g>of</str<strong>on</strong>g> extraurban<br />
networks w<strong>it</strong>h estimati<strong>on</strong> <str<strong>on</strong>g>of</str<strong>on</strong>g> demand effected w<strong>it</strong>h a grav<strong>it</strong>ati<strong>on</strong>al model (Ding, 1998).
100000<br />
90000<br />
80000<br />
70000<br />
60000<br />
50000<br />
40000<br />
30000<br />
20000<br />
10000<br />
0<br />
Total cost (hours)<br />
10 15 20 30 40 50 60 65 70 75<br />
n.<str<strong>on</strong>g>z<strong>on</strong>es</str<strong>on</strong>g><br />
Costo medio (sec)<br />
5000<br />
4500<br />
4000<br />
3500<br />
3000<br />
2500<br />
2000<br />
1500<br />
1000<br />
500<br />
0<br />
10 15 20 30 40 50 60 65 70 75<br />
n.<str<strong>on</strong>g>z<strong>on</strong>es</str<strong>on</strong>g><br />
Figura 3. Total cost <strong>on</strong> the network<br />
Figura 4. Average cost <strong>on</strong> the network<br />
C<strong>on</strong>gesti<strong>on</strong> index (%)<br />
100<br />
90<br />
80<br />
70<br />
60<br />
50<br />
40<br />
30<br />
20<br />
10<br />
0<br />
10 15 20 30 40 50 60 65 70 75<br />
n.<str<strong>on</strong>g>z<strong>on</strong>es</str<strong>on</strong>g><br />
satured links (Gs>0,8)<br />
400<br />
350<br />
300<br />
250<br />
200<br />
150<br />
100<br />
50<br />
0<br />
10 15 20 30 40 50 60 65 70 75<br />
n.<str<strong>on</strong>g>z<strong>on</strong>es</str<strong>on</strong>g><br />
Figura 5. C<strong>on</strong>gesti<strong>on</strong> index PCP<br />
Figura 6. Number <str<strong>on</strong>g>of</str<strong>on</strong>g> satured links<br />
4 CONCLUSIONS<br />
The discreetizati<strong>on</strong> <str<strong>on</strong>g>of</str<strong>on</strong>g> terr<strong>it</strong>ory and the aggregati<strong>on</strong> <str<strong>on</strong>g>of</str<strong>on</strong>g> origins and destinati<strong>on</strong>s <str<strong>on</strong>g>of</str<strong>on</strong>g> elementary<br />
trips in z<strong>on</strong>e’s centroid produce <str<strong>on</strong>g>effects</str<strong>on</strong>g> <strong>on</strong> simulati<strong>on</strong> <str<strong>on</strong>g>of</str<strong>on</strong>g> the transportati<strong>on</strong> system.<br />
In this note these <str<strong>on</strong>g>effects</str<strong>on</strong>g> have been analyzed through different levels <str<strong>on</strong>g>of</str<strong>on</strong>g> discreetizati<strong>on</strong> (from<br />
10 to 75 <str<strong>on</strong>g>z<strong>on</strong>es</str<strong>on</strong>g>) <str<strong>on</strong>g>of</str<strong>on</strong>g> the study area (c<strong>it</strong>y <str<strong>on</strong>g>of</str<strong>on</strong>g> Bari) into <str<strong>on</strong>g>traffic</str<strong>on</strong>g> <str<strong>on</strong>g>z<strong>on</strong>es</str<strong>on</strong>g>. The costructi<strong>on</strong> <str<strong>on</strong>g>of</str<strong>on</strong>g> the<br />
scenarios <str<strong>on</strong>g>of</str<strong>on</strong>g> simulati<strong>on</strong> has been made possible thanks to use <str<strong>on</strong>g>of</str<strong>on</strong>g> a s<str<strong>on</strong>g>of</str<strong>on</strong>g>tware GIS which has<br />
allowed the management, visualizati<strong>on</strong>s, aggregati<strong>on</strong>s and disaggregati<strong>on</strong>s <str<strong>on</strong>g>of</str<strong>on</strong>g> elementary<br />
informati<strong>on</strong>s about both the socioec<strong>on</strong>omic characteristic <str<strong>on</strong>g>of</str<strong>on</strong>g> terr<strong>it</strong>ory and the elements <str<strong>on</strong>g>of</str<strong>on</strong>g> the<br />
transportati<strong>on</strong> system. It has allowed, moreover, a first simple phase <str<strong>on</strong>g>of</str<strong>on</strong>g> inizializati<strong>on</strong> <str<strong>on</strong>g>of</str<strong>on</strong>g><br />
z<strong>on</strong>ing procedure thanks to the capac<strong>it</strong>y to represent terr<strong>it</strong>orial data.<br />
The subsequent phases <str<strong>on</strong>g>of</str<strong>on</strong>g> costructi<strong>on</strong> <str<strong>on</strong>g>of</str<strong>on</strong>g> different <str<strong>on</strong>g>z<strong>on</strong>es</str<strong>on</strong>g>, for each level examined, has been<br />
effected <strong>on</strong> the base <str<strong>on</strong>g>of</str<strong>on</strong>g> a cluster <str<strong>on</strong>g>analysis</str<strong>on</strong>g> through the use <str<strong>on</strong>g>of</str<strong>on</strong>g> a K-means technique.<br />
W<strong>it</strong>h the hypothesis <str<strong>on</strong>g>of</str<strong>on</strong>g> the same supply model, the esteemed transportati<strong>on</strong> demand, in all<br />
analized cases, has been assigned to the network in the hypothesis <str<strong>on</strong>g>of</str<strong>on</strong>g> a SUE-PROBIT model<br />
and algor<strong>it</strong>hm <str<strong>on</strong>g>of</str<strong>on</strong>g> the type MSA-FA. A variati<strong>on</strong> <str<strong>on</strong>g>of</str<strong>on</strong>g> the supply model, for hypothesis c<strong>on</strong>stant
w<strong>it</strong>h the variati<strong>on</strong> <str<strong>on</strong>g>of</str<strong>on</strong>g> the simulated scenarios, could be aim <str<strong>on</strong>g>of</str<strong>on</strong>g> extensi<strong>on</strong> <str<strong>on</strong>g>of</str<strong>on</strong>g> the simulati<strong>on</strong>s to<br />
acquire larger knowledge also about network <str<strong>on</strong>g>effects</str<strong>on</strong>g>.<br />
The <str<strong>on</strong>g>traffic</str<strong>on</strong>g> flows esteemed (veic/h) <strong>on</strong> each link <str<strong>on</strong>g>of</str<strong>on</strong>g> the network have alloweded to calculate<br />
network indicators as total cost, average cost <strong>on</strong> the network, the c<strong>on</strong>gesti<strong>on</strong> index PCP the<br />
number <str<strong>on</strong>g>of</str<strong>on</strong>g> satured links (Gs > 80%).<br />
The <str<strong>on</strong>g>analysis</str<strong>on</strong>g> shows a threshold <str<strong>on</strong>g>of</str<strong>on</strong>g> number <str<strong>on</strong>g>of</str<strong>on</strong>g> <str<strong>on</strong>g>z<strong>on</strong>es</str<strong>on</strong>g> bey<strong>on</strong>d which the values <str<strong>on</strong>g>of</str<strong>on</strong>g> network’s<br />
indicator present a stabil<strong>it</strong>y <str<strong>on</strong>g>of</str<strong>on</strong>g> results included in a range <str<strong>on</strong>g>of</str<strong>on</strong>g> ±20% aroud the mean between<br />
the maximum and the minimum <str<strong>on</strong>g>of</str<strong>on</strong>g> results obtained in the simulati<strong>on</strong>s.<br />
The individualizati<strong>on</strong> <str<strong>on</strong>g>of</str<strong>on</strong>g> the threshold would allow a priori for the analyst a better defin<strong>it</strong>i<strong>on</strong><br />
<str<strong>on</strong>g>of</str<strong>on</strong>g> the modelling <str<strong>on</strong>g>of</str<strong>on</strong>g> the system and c<strong>on</strong>siderable ec<strong>on</strong>omies <str<strong>on</strong>g>of</str<strong>on</strong>g> time, in elaborati<strong>on</strong>s, and<br />
resources, in the tools for calculati<strong>on</strong> w<strong>it</strong>h a c<strong>on</strong>sequent reducti<strong>on</strong> <str<strong>on</strong>g>of</str<strong>on</strong>g> tha <str<strong>on</strong>g>analysis</str<strong>on</strong>g>’ costs.<br />
For this end, an <str<strong>on</strong>g>analysis</str<strong>on</strong>g> extended to other c<strong>it</strong>ies <str<strong>on</strong>g>of</str<strong>on</strong>g> l<strong>it</strong>tle, medium and big dimensi<strong>on</strong> could<br />
supply useful informati<strong>on</strong>s. Moreover, for the individualizati<strong>on</strong> <str<strong>on</strong>g>of</str<strong>on</strong>g> this threshold, from a this<br />
kind <str<strong>on</strong>g>of</str<strong>on</strong>g> <str<strong>on</strong>g>analysis</str<strong>on</strong>g> relati<strong>on</strong>s between the level <str<strong>on</strong>g>of</str<strong>on</strong>g> discreetizati<strong>on</strong> <str<strong>on</strong>g>of</str<strong>on</strong>g> terr<strong>it</strong>ory and socioec<strong>on</strong>omic<br />
quant<strong>it</strong>ies, as resident populati<strong>on</strong>, demographic dens<strong>it</strong>y, extent <str<strong>on</strong>g>of</str<strong>on</strong>g> study area, could be<br />
determined, if they exist.<br />
REFERENCES<br />
Baass K. G. Tecnique Dagregati<strong>on</strong> de Z<strong>on</strong>es en Planificati<strong>on</strong> des Trasports. Ecole Polytecnique,<br />
Campus de l’Univers<strong>it</strong>é de M<strong>on</strong>treal<br />
Benni<strong>on</strong> Wayne, M. And O’Neill, Wende A. Building Transportati<strong>on</strong> Analysis Z<strong>on</strong>es Using<br />
Geographic Informati<strong>on</strong> Systems. Transportati<strong>on</strong> Research Record # 1429, pp. 49-56<br />
Berglund S. Experience from GIS Based Travel Demand Modelling Royal Inst<strong>it</strong>ute <str<strong>on</strong>g>of</str<strong>on</strong>g> Technology<br />
Stockholm, Sweden<br />
Binetti M.G. (1996) Efficacia ed efficienza di algor<strong>it</strong>mi per l’asseganzi<strong>on</strong>e di equilibrio stocastico<br />
AIRO ’96 Perugia 16-20 settembre 1996<br />
Cascetta E. (1998) Teoria e Metodi dell’Ingegneria dei Sistemi di Trasporto Ed. UTET<br />
Chengri Ding (1998) The GIS-Based Human Interactive TAZ Design Algor<strong>it</strong>hm: Examing The Impacts<br />
<str<strong>on</strong>g>of</str<strong>on</strong>g> Data Aggregati<strong>on</strong> <strong>on</strong> Transportanti<strong>on</strong> Planning Analysis. Enviroment & Planning B:Planning and<br />
<str<strong>on</strong>g>design</str<strong>on</strong>g>, Vol 25, 601-616<br />
Dueker K.J., Butler J.A. (2000). A Geographic Informati<strong>on</strong> System Framework for Transportati<strong>on</strong><br />
Data Sharing Transportati<strong>on</strong> Research part C, Vol 8, pp 13-36<br />
Fotheringham A.S. and W<strong>on</strong>g (1991), “The modifiable areal un<strong>it</strong> problem in multivariate statistical<br />
<str<strong>on</strong>g>analysis</str<strong>on</strong>g>”, Envir<strong>on</strong>ment and Planning A, 23:1025-1044
Goodchild M.F. GIS and Transportati<strong>on</strong>: Status and Challenges Department <str<strong>on</strong>g>of</str<strong>on</strong>g> Geography,<br />
Univers<strong>it</strong>y <str<strong>on</strong>g>of</str<strong>on</strong>g> California, Santa Barbara<br />
Jinsoo You, Nedovic-Budic Z., Tschangho J.K. (1996). A GIS-Based Traffic Analysis Z<strong>on</strong>e Design:<br />
Technique. Transportati<strong>on</strong> Plannig and Technol., vol 21, pp. 45-68<br />
Jinsoo You, Nedovic-Budic Z., Tschangho J.K. (1996). A GIS-Based Traffic Analysis Z<strong>on</strong>e Design:<br />
Implementati<strong>on</strong> and Evaluati<strong>on</strong>. Transportati<strong>on</strong> Plannig and Technol., vol 21, pp. 69-91<br />
Openshaw S. (1977) . Optimal Z<strong>on</strong>ing Systems for Spatial Interacti<strong>on</strong> Models. Envir<strong>on</strong>ment and<br />
Plannig A, vol 9 pp. 169-184<br />
Oppenheim N. (1995). Urban travel demand modeling.From individual choice to general<br />
equilibrium.Ed. Jh<strong>on</strong> Wiley& S<strong>on</strong>s<br />
Ortuzar J. de D., Willumsen L. G. (1994). Modelling Transport 2nd Ed., John Winley and S<strong>on</strong>s<br />
Mayer M.D., Miller E.J. (2001). Urban transportati<strong>on</strong> planning. A decisi<strong>on</strong> oriented approach.Ed.<br />
McGraw Hill<br />
McNally M.G. (2000).The four step model. Da Handbook <str<strong>on</strong>g>of</str<strong>on</strong>g> transport modelling (chapter 3).Ed.<br />
Hensher D.A. and Butt<strong>on</strong> K.J., Pergam<strong>on</strong><br />
Thill J.C. (2000) Geographic Informati<strong>on</strong> Systems for Transportati<strong>on</strong> in Perspective. Transportati<strong>on</strong><br />
Research part C, Vol 8, pp 3-12<br />
Sutt<strong>on</strong> J.C., Wyman M.M. (2000). Dynamic Locati<strong>on</strong>: An Ic<strong>on</strong>ic Model to Synchr<strong>on</strong>ize Temporal and<br />
Spatial Transportati<strong>on</strong> Data. Transportati<strong>on</strong> Research part C, Vol 8, pp 37-52