REGRESSION ANALYSIS II - icpsr - University of Michigan
REGRESSION ANALYSIS II - icpsr - University of Michigan
REGRESSION ANALYSIS II - icpsr - University of Michigan

Create successful ePaper yourself
Turn your PDF publications into a flip-book with our unique Google optimized e-Paper software.
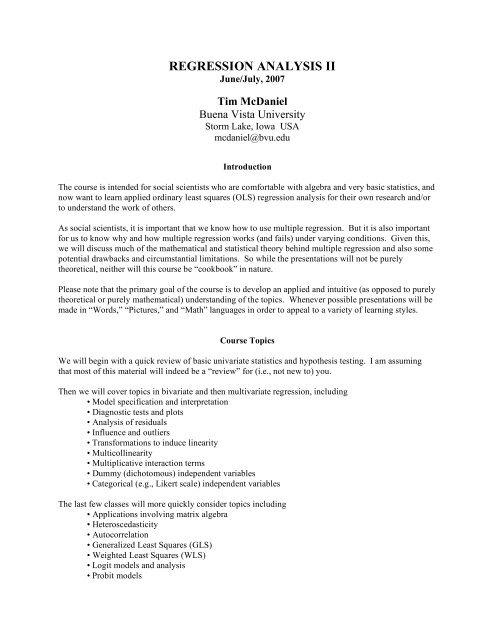
<strong>REGRESSION</strong> <strong>ANALYSIS</strong> <strong>II</strong><br />
June/July, 2007<br />
Tim McDaniel<br />
Buena Vista <strong>University</strong><br />
Storm Lake, Iowa USA<br />
mcdaniel@bvu.edu<br />
Introduction<br />
The course is intended for social scientists who are comfortable with algebra and very basic statistics, and<br />
now want to learn applied ordinary least squares (OLS) regression analysis for their own research and/or<br />
to understand the work <strong>of</strong> others.<br />
As social scientists, it is important that we know how to use multiple regression. But it is also important<br />
for us to know why and how multiple regression works (and fails) under varying conditions. Given this,<br />
we will discuss much <strong>of</strong> the mathematical and statistical theory behind multiple regression and also some<br />
potential drawbacks and circumstantial limitations. So while the presentations will not be purely<br />
theoretical, neither will this course be “cookbook” in nature.<br />
Please note that the primary goal <strong>of</strong> the course is to develop an applied and intuitive (as opposed to purely<br />
theoretical or purely mathematical) understanding <strong>of</strong> the topics. Whenever possible presentations will be<br />
made in “Words,” “Pictures,” and “Math” languages in order to appeal to a variety <strong>of</strong> learning styles.<br />
Course Topics<br />
We will begin with a quick review <strong>of</strong> basic univariate statistics and hypothesis testing. I am assuming<br />
that most <strong>of</strong> this material will indeed be a “review” for (i.e., not new to) you.<br />
Then we will cover topics in bivariate and then multivariate regression, including<br />
• Model specification and interpretation<br />
• Diagnostic tests and plots<br />
• Analysis <strong>of</strong> residuals<br />
• Influence and outliers<br />
• Transformations to induce linearity<br />
• Multicollinearity<br />
• Multiplicative interaction terms<br />
• Dummy (dichotomous) independent variables<br />
• Categorical (e.g., Likert scale) independent variables<br />
The last few classes will more quickly consider topics including<br />
• Applications involving matrix algebra<br />
• Heteroscedasticity<br />
• Autocorrelation<br />
• Generalized Least Squares (GLS)<br />
• Weighted Least Squares (WLS)<br />
• Logit models and analysis<br />
• Probit models
Lecture Transcripts<br />
This course will utilize approximately 850 pages <strong>of</strong> Lecture Transcripts which will serve as the<br />
“textbook” for this course and an information resource for you after the course ends. These Lecture<br />
Transcripts will also significantly reduce the amount <strong>of</strong> notes you have to write during class, which means<br />
you can concentrate much more on learning and understanding the material itself.<br />
A detailed outline <strong>of</strong> the Lecture Transcripts is included in this syllabus. This outline also serves as a<br />
“Table <strong>of</strong> Contents” and an “Index” for these Lecture Transcripts.<br />
Packets #1, #2, and #3 constitute “Bundle #1” <strong>of</strong> the Lecture Transcripts; this Bundle is furnished to all<br />
participants free <strong>of</strong> charge on the first day <strong>of</strong> class and will be used for the first two class days. The<br />
remainder <strong>of</strong> the twenty Lecture Transcript packets (Numbers 4 through 20, contained in Bundles #2, #3,<br />
#4, and #5) are available for purchase. We will begin using Bundle #2 on the third class day. Details<br />
regarding the purchase <strong>of</strong> these last four Bundles (Packets 4 through 20) will be discussed the first day <strong>of</strong><br />
class.<br />
Although these Lecture Notes/Transcripts are detailed, comprehensive, and self-contained, it is still<br />
important that you study the assigned readings before each class, ask questions during class, and talk to<br />
either me or one <strong>of</strong> the Teaching Assistants outside <strong>of</strong> class if you are to maximize your benefit from this<br />
course. These notes contain several algebraic derivations and pro<strong>of</strong>s that we will not be taking class time<br />
to go over or work through, but instead are provided for your information and inspection outside <strong>of</strong> class.<br />
Textbooks and Other Readings<br />
There is no required textbook. Later in this syllabus I provide you with information about some optional<br />
supplemental readings from various textbooks and journals, including which readings are appropriate for<br />
each <strong>of</strong> the twenty packets <strong>of</strong> Lecture Transcripts. See the beginning <strong>of</strong> the “Some Suggested Readings”<br />
section for a discussion <strong>of</strong> four types <strong>of</strong> textbooks included in these optional readings.<br />
I do not think that any one <strong>of</strong> these textbooks is significantly better than the others; instead, the one you<br />
might think is best will depend upon a number <strong>of</strong> personal factors, including your particular learning<br />
style. Therefore, instead <strong>of</strong> just picking one textbook, I have designed the course so that you can<br />
experiment and pick-and-choose which style <strong>of</strong> learning and (therefore) textbook you prefer. Of course,<br />
you may decide to read and study (and maybe purchase) none, one, two, three, or even all four <strong>of</strong> these<br />
textbooks; again, that is entirely up to you. In the alphabetized list <strong>of</strong> “Some Suggested Readings” near<br />
the end <strong>of</strong> this syllabus, you might want to consider the textbook readings the primary assigned readings<br />
for each packet. Other textbooks are also appropriate for this course; see me if you have any questions<br />
about this.<br />
I have included a bibliography for the textbooks and all <strong>of</strong> the other readings, including quite a few <strong>of</strong> the<br />
little green Sage <strong>University</strong> Paper Series on Quantitative Applications in the Social Sciences monographs.<br />
You may notice that some (though certainly not all) <strong>of</strong> the other readings tend to be from political science<br />
books and journals; however, this is NOT a cause for concern since they deal with methodological topics<br />
that are easily and broadly generalizable across other social science disciplines (I would not have selected<br />
them otherwise...). All materials listed in the bibliography are available at the Summer Program’s<br />
Library; all textbooks and monographs should be available for purchase. Before you actually buy<br />
anything for this course, I strongly suggest you first check it out <strong>of</strong> Summer Program’s Library.
Classes, Assignments, S<strong>of</strong>tware, and Matrix Algebra<br />
I will hold an Optional Session the evening <strong>of</strong> our first class day (Tuesday); the time and room will be<br />
announced in that first day’s class. During this session I will continue and finish a review <strong>of</strong> basic<br />
statistics that we will have started earlier that afternoon. The notes and Lecture Transcripts for this<br />
review are in the Packets #1 and #2 (in Bundle #1). Some <strong>of</strong> you will find a continuation and completion<br />
<strong>of</strong> this review useful, while others may decide not to attend this first evening’s session (remember it is<br />
optional!); in either case, you at least will have the lecture transcripts for this review <strong>of</strong> basic statistics.<br />
We will start Packet #3 at the beginning <strong>of</strong> the second (Wednesday’s) class.<br />
The first Assignment involves some mathematical and summation notation manipulation; its purpose is to<br />
re-familiarize you with those basic tools. For the last three Assignments you will use SPSS as a tool to<br />
generate output; then your substantive task will be to interpret and evaluate that output.<br />
It is important to note that this is a course on Regression Analysis, NOT on computer or s<strong>of</strong>tware usage.<br />
So do not worry if you are unfamiliar with SPSS; it is very easy to learn and to use (which is why we use<br />
it in this course) and we will examine output, and discussed how it was generated, in class. Similarly, do<br />
not be concerned if you will use some s<strong>of</strong>tware other than SPSS in your own work; never forget that our<br />
goal here to learn “Regression Analysis,” not “s<strong>of</strong>tware usage.”<br />
There are computer counselors and Teaching Assistants available to aid you in using the computers and<br />
SPSS to generate the output you will analyze in your assignments. The data files for the homework, as<br />
well as for most <strong>of</strong> the in-class examples, are available on the Summer Program’s computer server. I will<br />
distribute an Answer Key for each assignment; that provides you with yet another excellent “learning<br />
opportunity.” IMPORTANT: You will definitely want to attend some <strong>of</strong> the ICPSR Summer Program<br />
Lecture Series “Introduction to Computing” if you are not already extremely comfortable with basic<br />
computer operations, SPSS, or Windows.<br />
I have designed the course so that matrix algebra will not be used during the first three weeks. I feel it is<br />
better and more efficient to learn as much <strong>of</strong> the regression material as possible in a more familiar<br />
environment (scalar algebra). I will present most <strong>of</strong> the multiple regression material again on Monday <strong>of</strong><br />
the fourth week, this time in matrix algebra format and under the assumption that you now understand<br />
and comprehend its substance. Most <strong>of</strong> the more advanced topics we will cover in the fourth week will<br />
also be presented using matrices. Understanding matrix algebra is not only necessary for a thorough<br />
comprehension <strong>of</strong> some <strong>of</strong> the topics we will discuss in the later part <strong>of</strong> this course, but is also vital<br />
should you decide to take more advanced courses in quantitative methods. IMPORTANT: You will<br />
definitely want to attend the ICPSR Summer Program Lecture Series “Mathematics for Social Scientists<br />
<strong>II</strong>” if you are at all weak in this area. (Matrix algebra will be presented during the first two weeks <strong>of</strong> this<br />
lecture series.)<br />
Teaching Assistants<br />
Remember, the primary purpose <strong>of</strong> the class meetings, Lecture Transcripts, and Assignments is to help<br />
you learn this material. You are not in this alone. Studying and working with your fellow participants is<br />
probably a good idea for many <strong>of</strong> you, as is taking advantage <strong>of</strong> “Office Hours” opportunities.<br />
The Teaching Assistants and I make every effort to be accessible to you. I encourage you to attend our<br />
<strong>of</strong>fice hours, or to make an appointment if those hours do not work well within your schedule. Early in<br />
the course I will give you more information regarding these matters.
“Practical Matters” Involving Assignments and Grading<br />
Quantity. There will be four Assignments, worth 10, 20, 40, and 30 points respectively.<br />
Purpose. The primary purpose <strong>of</strong> the Assignments is to further enhance your learning <strong>of</strong> the material.<br />
They also serve as the sole evaluation vehicle (i.e., the only thing that is graded) for those <strong>of</strong> you taking<br />
the course for a grade.<br />
When They Are Due. The “Due Date” for each Assignment will be announced when that assignment is<br />
distributed in class. You will submit each Assignment at the beginning <strong>of</strong> the class on that due date.<br />
When You Will Get It Back. The Teaching Assistants for this course will try to get your assignments<br />
graded in a timely fashion so they can be returned to you as soon as possible.<br />
Answer Keys. Everyone will receive an Answer Key for each assignment, whether you submitted the<br />
assignment or not.<br />
Calculator. You might need a basic calculator for some <strong>of</strong> the Assignment tasks.<br />
Details.... Your work will be graded on the quality, clarity, completeness, and accuracy <strong>of</strong> your<br />
presentation, so:<br />
• Make it easy to read, follow, and understand your work (i.e., be organized and print neatly).<br />
• Show all <strong>of</strong> your work, not just your bottom-line answer.<br />
• Print your name, the course name, and the Assignment Number at the top <strong>of</strong> the first page.<br />
• Also print your name at the top <strong>of</strong> the each page.<br />
• Staple the sheets <strong>of</strong> paper together, in the upper-left-hand corner.<br />
Do Not Be Late. Unless we have made specific arrangements beforehand, no Assignment submitted late<br />
will be accepted.<br />
Not “For Credit”? No Problem.... If you are not taking the course “for credit.” then you can still submit<br />
none, some, or all <strong>of</strong> the Assignments for grading; it is completely up to you.<br />
Grade Appeals. If you ever have any questions about any <strong>of</strong> your grades (e.g., partial credit decisions)<br />
then you can see me (not a Teaching Assistant!) to discuss the situation and possibly appeal that grading<br />
decision. However, here are a couple <strong>of</strong> relevant course policies:<br />
• You must wait at least 24 hours after receiving your grade. This “24 Hour Rule” gives you<br />
time to study and contemplate your work-product, your notes, and the Answer Key and to think<br />
about the grading decision.<br />
• The maximum amount <strong>of</strong> time you have to appeal a grading decision to me is three class days<br />
after the assignment is returned; after then no grading appeals will be considered.<br />
Conclusion<br />
Learning the material in this course will require a substantial amount <strong>of</strong> effort on your part... but that is<br />
why you are here, and the pay<strong>of</strong>f will be worth that effort. Let me know if I can be <strong>of</strong> any additional<br />
assistance to you in this endeavor.<br />
It is an honor to be your instructor for this course.
Outline <strong>of</strong> the Course<br />
(Organized by Packets <strong>of</strong> Lecture Notes/Transcripts)<br />
Packet I. Basic Statistics Review<br />
#1 A. Summations and Sigma Notation<br />
B. Basic Statistics<br />
1. Mean<br />
2. Variance and Standard Deviation<br />
3. Probability<br />
4. Random Variables<br />
a. Continuous versus Discrete<br />
b. Nominal<br />
c. Ordinal<br />
d. Interval<br />
5. Standardized Variables<br />
6. Expected Value<br />
7. Covariance<br />
8. Correlation (and Causality)<br />
9. Independence<br />
10. Normal Distribution<br />
11. Central Limit Theorem<br />
12. Student’s T Distribution<br />
13. Hypothesis Testing<br />
14. Confidence Intervals<br />
15. Prob-Values (a.k.a. P-Values)<br />
16. Properties <strong>of</strong> Estimators<br />
----------------------------------------------------------------------------------------------------------------------------------------------------------------------------------------------------------------<br />
Packet <strong>II</strong>. Supplement to Basic Statistics Review<br />
#2 A. A Closer Look at Population and Sample Variances<br />
B. Hypothesis Testing: Summary, Flowchart, Protocol, and p-Values<br />
C. Some Abuses and Misuses <strong>of</strong> Probability and Statistics<br />
D. Symbol Glossary<br />
----------------------------------------------------------------------------------------------------------------------------------------------------------------------------------------------------------------<br />
Packet <strong>II</strong>I. Bivariate Regression<br />
#3 A. Notation<br />
B. Fitting a Line<br />
C. Ordinary Least Squares Assumptions<br />
D. Estimating the Intercept and the Slope<br />
E. Centered Variables<br />
F. The Estimated Slope Coefficient, “b”<br />
Assignment<br />
1. Variance <strong>of</strong> “b”<br />
#1 2. Confidence Interval for “b”<br />
Given<br />
3. Hypothesis Testing<br />
G. The Gauss-Markov Theorem<br />
H. Appendix: Deriving the Formulas for “a” and “b” Using Calculus<br />
----------------------------------------------------------------------------------------------------------------------------------------------------------------------------------------------------------------
Packet I. Residuals<br />
#4 1. Definition and Estimation<br />
2. True, Population “Error” as a Disturbance, or Stochastic Element<br />
J. Explained, Unexplained, and Total Deviations and Sums <strong>of</strong> Squares<br />
K. Goodness <strong>of</strong> Fit<br />
1. Coefficient <strong>of</strong> Determination (R-Squared)<br />
a. Correlations<br />
b. Why the R-Squared Can Be Inappropriate and Misleading<br />
c. Perils <strong>of</strong> Maximizing R-Squared: A Monte Carlo Simulation<br />
2. Standard Error <strong>of</strong> Regression (SER)<br />
L. Standardized Variables and Standardized Variable Coefficients<br />
M. Reporting OLS Regression Results<br />
N. Regression Forced Through the Origin<br />
1. Definition<br />
2. Illustrations and Examples<br />
3. The Importance <strong>of</strong> Theoretical and Substantive Justifications<br />
O. Comparison <strong>of</strong> Centering, Standardizing, and Forcing Through the Origin<br />
P. Another Note on the Meaning and Interpretation <strong>of</strong> “a,” “b,” and Y-Hat<br />
Q. An Analogy Involving Means, Slopes, Standardization, Samples and Populations<br />
----------------------------------------------------------------------------------------------------------------------------------------------------------------------------------------------------------------<br />
Packet R. Functional Transformations <strong>of</strong> Independent Variables<br />
#5 1. The Need for Transformations<br />
2. The Regression is Still Linear<br />
3. The Natural Log and the Square Root Transformations<br />
4. The Square Transformation<br />
5. Other Transformations and Functional Forms<br />
6. Presenting Findings With Transformed Independent Variables<br />
----------------------------------------------------------------------------------------------------------------------------------------------------------------------------------------------------------------<br />
Packet S. Interpolation<br />
#6 T. Predictive Intervals<br />
U. Extrapolation<br />
V. Some Simple Diagnostic Plots<br />
Assignment<br />
1. Y vs. X (and an Introduction to Outliers)<br />
#2 2. Y vs. Y-Hat<br />
Given<br />
3. Residual vs. X<br />
4. Residual vs. Case Number<br />
5. Residual vs. Lagged Residual<br />
6. Residual vs. Y-Hat<br />
W. Simpson’s Paradox (Aggregation Bias)<br />
X. Generation and Interpretation <strong>of</strong> Computer Output Using Real Data<br />
1. Setting Up the Example<br />
2. Producing and Analyzing the Output<br />
Y. The Usefulness <strong>of</strong> Simple Scatter Plots: An Illustration<br />
Z. The Relationship Between R-Squared, “b,” and SER:<br />
A Replication <strong>of</strong>, and Additional Analysis Using, a Monte Carlo Simulation<br />
----------------------------------------------------------------------------------------------------------------------------------------------------------------------------------------------------------------
Packet IV. Introduction to Multiple Regression<br />
#7 A. Limits <strong>of</strong> Bivariate Regression<br />
B. Trivariate Regression<br />
1. Visualization<br />
2. The Residual Term<br />
a. Definition<br />
b. The SER and Degrees <strong>of</strong> Freedom<br />
3. The (Two) Estimated Slope Coefficients<br />
a. Meaning<br />
b. Partial Effects Equations<br />
c. Computing the Two Slope Coefficients<br />
d. Variance and Confidence Intervals<br />
4. The Impact on OLS Assumptions<br />
5. Holding One Variable “Constant”: What’s That All About?<br />
6. Representing Partial Effects Using Algebra and Models<br />
7. Representing Partial Effects Using Venn Diagrams<br />
C. Multivariate Regression: The General OLS Model<br />
1. The Slope Coefficient<br />
a. Meaning<br />
b. Partial Effects Equations<br />
c. Computing the Slope Coefficients<br />
d. Variance and Confidence Intervals<br />
e. OLS Assumptions and the Gauss-Markov Theorem<br />
2. The Residual Term<br />
a. Definition<br />
b. The SER and Degrees <strong>of</strong> Freedom: The General Case<br />
3. Comparisons to Trivariate Regression<br />
----------------------------------------------------------------------------------------------------------------------------------------------------------------------------------------------------------------<br />
Packet<br />
4. Summary and Review <strong>of</strong> Partial Effects and the Interpretation <strong>of</strong> “b”<br />
#8 5. Summary and Review <strong>of</strong> T-Stats, Prob-Values, and Hypothesis Tests<br />
6. Units <strong>of</strong> the SER and Comparing SER’s Across Equations<br />
7. R-Squared and Adjusted R-Squared<br />
a. Review <strong>of</strong> the R-Squared Statistic<br />
b. Inappropriateness <strong>of</strong> Comparing R-Squareds Across Models<br />
c. R-Squared and Functional Transformations<br />
d. Multiple Independent Variables and the Effect on R-Squared<br />
e. Computing the Adjusted R-Squared Value<br />
f. Interpreting Adjusted R-Squared<br />
8. Interactions<br />
a. Description<br />
b. Model Specification (Including “Can I Exclude Some Terms?”)<br />
c. Analogy to Functional Transformations<br />
d. Explaining Models with Interaction Terms: Examples<br />
e. Interpreting Models with Interactions<br />
i. Algebraic Techniques<br />
ii. Graphical Techniques<br />
----------------------------------------------------------------------------------------------------------------------------------------------------------------------------------------------------------------
Packet<br />
9. Multicollinearity and Multicollinearity Diagnostics<br />
#9 a. Perfect Multicollinearity: An Example<br />
b. Discussing Multicollinearity Using Venn Diagrams<br />
c. Consequences, Including Possible “Backdoor Bias”<br />
d. When to Suspect Multicollinearity Problems<br />
e. Diagnosing Multicollinearity (And How Not To Do It)<br />
f. Possible Remedies<br />
g. Narrowing Down the Source <strong>of</strong> the Multicollinearity<br />
h. A Statistics, Estimation, and Information (Not a Theory) Problem<br />
10. Dummy and Categorical Independent Variables<br />
a. Definition and Interpretation<br />
b. The Importance <strong>of</strong> “Intervalness” for Independent Variables<br />
c. Replacing a Categorical Independent Variable with Dummies<br />
i. Excluding one Dummy from the Model<br />
ii. Implementation and Interpretation<br />
d. Graphing Models with Dummy Variables (and Interactions)<br />
e. Brief Diversion: Comparing “Regression Forced Through Origin” to<br />
“Having X in an Interaction but Not as a Stand-Alone Term”<br />
f. Algebraic Interpretation <strong>of</strong> Category Dummies and “Jumps”<br />
----------------------------------------------------------------------------------------------------------------------------------------------------------------------------------------------------------------<br />
Packet<br />
11. Functional Transformations<br />
#10 a. Things to Consider Regarding Transforming Y<br />
b. Log Transformations and “Constant Elasticity” Models<br />
c. Conditional Impacts and Slopes in Models with Interaction Terms<br />
d. Models with an “X Squared” Term (Including Threshold Models)<br />
e. The Bend Rule<br />
12. Model Specification<br />
a. Review <strong>of</strong> Types <strong>of</strong> Specification Error<br />
b. Omitting Relevant Variables: Derivation and Consequences<br />
c. Including Irrelevant Variables: Consequences<br />
d. Variable Selection<br />
e. Perils <strong>of</strong> Stepwise Regression<br />
f. An Alternative to Standardization for Interval-Level Xs<br />
13. Missing Data<br />
a. Review <strong>of</strong> the Cov(X, e) = E[Xe] = 0 Assumption<br />
b. Data Missing at Random<br />
i. Dependent Variable<br />
ii. Independent Variables<br />
c. “Solutions” and Their Potential Problems<br />
i. Casewise (Listwise) Deletion<br />
ii. Pairwise Deletion<br />
iii. Mean and Conditional Mean Substitution<br />
14. Measurement Errors<br />
a. In the Dependent Variable (Y)<br />
b. In the Independent Variable(s) (X)<br />
15. Partial Effects and Linearity in Multivariate Regression Models<br />
----------------------------------------------------------------------------------------------------------------------------------------------------------------------------------------------------------------
Packet<br />
16. Summary: The Effects <strong>of</strong> Multicollinearity and Specification Errors on<br />
#11 Slope Coefficient Estimation and Hypothesis Testing<br />
a. Type I and Type <strong>II</strong> Errors<br />
b. Flowcharts: Review <strong>of</strong> the Logic Behind Hypothesis Tests<br />
Involving Specification Errors and Multicollinearity<br />
c. Essay: Hypothesis Testing and American Criminal Trials<br />
Assignment<br />
17. Use <strong>of</strong> Partial Effects Plots to Detect Non-Linearity<br />
#3 18. Another Look at the “Residual vs. Case Number” Diagnostic Plot<br />
Given<br />
19. Another Look at Outliers<br />
a. What They Are<br />
b. Why They Matter<br />
c. A Flowchart Guide to Dealing With Outliers<br />
20. Multivariate Regression: A Computer Example Using ANES Data<br />
a. Setting-Up the Example (American National Election Study)<br />
b. Generation and Interpretation <strong>of</strong> Computer Output<br />
i. Effects <strong>of</strong> Adding Independent Variables to the Model<br />
ii. Categorical Independent Variables and “Intervalness”<br />
c. Analysis and Wrap-Up <strong>of</strong> Computer Example<br />
21. “Split-Samples” Versus “Big Models with Dummy Interaction Terms”<br />
----------------------------------------------------------------------------------------------------------------------------------------------------------------------------------------------------------------<br />
Packet V. Regression Diagnostics and Graphical Techniques: A Closer Look<br />
#12 A. Outliers: Detection, Classification, and Possible Effects<br />
1. Influence<br />
a. Definition and Description<br />
b. Detection Using Statistics<br />
i. DFBETA and DFBETAS<br />
[1] Definition<br />
[2] Interpretation and Use<br />
ii. Cook’s Distance (D)<br />
[1] Definition<br />
[2] Interpretation and Use<br />
iii. DFFITS<br />
[1] Definition<br />
[2] Interpretation and Use<br />
2. Leverage<br />
a. Definition and Description<br />
b. Detection Using Statistics<br />
i. Hat Values<br />
[1] Definition<br />
[2] Interpretation and Use<br />
ii. Studentized Residuals<br />
[1] Definition and Description<br />
[2] The Need for Standardized Residuals<br />
[3] Interpretation and Use<br />
[4] The Bonferroni Adjustment<br />
[5] An Easy Method <strong>of</strong> Calculation Using Regression
B. Diagnostic Plots and Graphical Techniques<br />
1. Proportional Leverage Plots<br />
a. Definition and Description<br />
b. Different Types<br />
2. Jointly Influential Data<br />
a. Definition and Description<br />
b. Examples<br />
3. Conditional Effects Plots<br />
a. Definition and Description<br />
b. Presentation and Interpretation<br />
c. Models with Interaction Terms (Including Confidence Bounds)<br />
d. The Importance <strong>of</strong> “Conditional”<br />
4. Plots <strong>of</strong> Categorical Independent Variables: Jittered Data Plots<br />
5. Scatterplot Matrices<br />
----------------------------------------------------------------------------------------------------------------------------------------------------------------------------------------------------------------<br />
Packet VI. Analysis <strong>of</strong> Variance and the F-Test<br />
#13 A. The F Distribution<br />
B. The ANOVA Table<br />
C. Similarities to Regression<br />
D. The F-Statistic and the F-Test<br />
1. A Test Involving All <strong>of</strong> the Regression Coefficients<br />
2. The Special Case When the F-Test and T-Test Are Identical<br />
E. Analysis and Demonstrations Using Computer Output<br />
1. Interpreting the F-Test: A Randomly Generated Variables Illustration<br />
2. Another Look at R-Squared, Adjusted R-Squared, and SER<br />
----------------------------------------------------------------------------------------------------------------------------------------------------------------------------------------------------------------<br />
Packet V<strong>II</strong>. Categorical Independent Variables (and F-Tests): A Closer Look<br />
#14 A. Problems using Categorical and Non-Interval Independent Variables<br />
B. Review: Replacing a Categorical X With Dummy Variables in OLS<br />
C. The F-Test Revisited<br />
1. A Review <strong>of</strong> the Whole-Model F-Test in a Regression Environment<br />
Assignment<br />
2. Nested F-Tests: Testing Groups (Subsets) <strong>of</strong> Regression Coefficients<br />
#4 a. Definition <strong>of</strong> Hypothesis<br />
Given<br />
b. Procedure<br />
c. Similarity and Generalization to the Whole-Model F-Test<br />
3. The Chow Test<br />
a. Definition and Purpose<br />
b. Structural Shifts<br />
c. Procedure<br />
d. And Aggregation Bias<br />
4. Overview <strong>of</strong> Comparing “Safe” versus “Risky” Models<br />
5. Comparison <strong>of</strong> SER’s With No Prior Knowledge <strong>of</strong> Relative Model<br />
Performance (I.e., No “Safe” or “Risky” Models)<br />
6. Relative Statistical Contribution <strong>of</strong> Groups <strong>of</strong> Variables in a Model<br />
D. Collapsing Categories <strong>of</strong> a Categorical Variable<br />
1. Set-Up and Notation<br />
2. Statistical Hypothesis Test for Collapsing Categories
E. Treating a Categorical Variable as Interval-Level<br />
1. “Contextually” Interval<br />
2. Statistical Hypothesis Test for Intervalness<br />
F. Monte Carlo Simulation Results<br />
1. Consequences <strong>of</strong> Categorical (Non-Interval) Independent Variables<br />
2. Which Dummy Category Variable to Exclude<br />
G. Generalizations <strong>of</strong> the F-Test<br />
H. Optional: Discussion and Analysis <strong>of</strong> a Substantive Example<br />
1. Description <strong>of</strong> the Study<br />
2. Statistical Tests Performed<br />
3. Potential Effects <strong>of</strong> Multicollinearity<br />
4. Different Specifications, Interpretations, and Conclusions<br />
5. Interpretation <strong>of</strong> Manipulated Coefficients<br />
a. Changing the Sign <strong>of</strong> a Coefficient Value<br />
b. Subtracting Coefficients<br />
----------------------------------------------------------------------------------------------------------------------------------------------------------------------------------------------------------------<br />
Packet V<strong>II</strong>I. Matrices and Matrix Algebra<br />
#15 A. General Terms and Definitions<br />
B. Addition, Subtraction, and Multiplication: How to Do It<br />
C. An Example: Matrix Multiplication and Lawyers<br />
D. Inverse Matrices<br />
E. Ranks and Singularity<br />
F. Properties <strong>of</strong> Matrix Algebra<br />
G. Expressing Linear Equations in Matrix Form<br />
----------------------------------------------------------------------------------------------------------------------------------------------------------------------------------------------------------------<br />
Packet IX. Multiple Regression Using Matrices<br />
#16 A. The General Linear Model<br />
B. OLS Using Matrices<br />
C. The Matrix <strong>of</strong> Residuals<br />
D. OLS Assumptions in Matrix Form<br />
E. Advantages <strong>of</strong> Using the Matrix Notation<br />
F. Variance-Covariance Matrices<br />
G. Deriving “b” and Var(b)<br />
H. R-Squared, Adjusted R-Squared, and SER in Matrix Form<br />
I. Ordinal and Dummy Variables: An Example Using Matrices<br />
J. Multicollinearity and Singular X’X Matrix<br />
K. Transformations and Interactions in Matrix Form: OLS is Still Linear…<br />
L. Appendix: A Pro<strong>of</strong> that the Matrix Derivation <strong>of</strong> “B” Minimizes the SSE<br />
----------------------------------------------------------------------------------------------------------------------------------------------------------------------------------------------------------------<br />
Packet X. Heteroscedasticity and Generalized Least Squares (GLS)<br />
#17 A. Definition<br />
B. Omega Matrices<br />
C. Variance-Covariance Matrices<br />
D. Types <strong>of</strong> Heteroscedasticity<br />
E. When to Expect Heteroscedasticity
F. Consequences <strong>of</strong> Using OLS With Heteroscedastic Errors<br />
G. Detection <strong>of</strong> Heteroscedasticity<br />
1. Diagnostic Plots<br />
a. What to Look For<br />
b. Transforming the Parameters<br />
2. Goldfeld-Quandt Test<br />
3. Glejser Test<br />
4. Likelihood Ratio Test<br />
H. Correcting for Heteroscedasticity Using Generalized Least Squares (GLS)<br />
1. Introduction to GLS<br />
2. Deriving “b” using GLS<br />
3. Advantages <strong>of</strong> Using GLS With Heteroscedastic Errors<br />
4. Conditions Under Which GLS is Equivalent to OLS<br />
5. GLS as Weighted Least Squares (WLS)<br />
6. The Underlying Logic <strong>of</strong> WLS: An Example Using State-Level Data<br />
7. Using GLS Given a Model for Var(e): The General Case<br />
----------------------------------------------------------------------------------------------------------------------------------------------------------------------------------------------------------------<br />
Packet XI. Autocorrelation<br />
#18 A. Definition <strong>of</strong> First-Order Autocorrelation<br />
B. When to Expect Autocorrelation<br />
C. Algebraic Interpretation <strong>of</strong> First-Order Autocorrelation<br />
D. Examples <strong>of</strong> Positive and Negative First-Order Autocorrelation<br />
E. Four Common Types <strong>of</strong> Time Series Models<br />
F. Consequences <strong>of</strong> Using OLS With Autocorrelation<br />
G. Detection <strong>of</strong> Autocorrelation<br />
1. Diagnostic Plots<br />
2. The Durbin-Watson Statistic (First-Order Autocorrelation)<br />
a. Procedure, Derivation, and Explanation<br />
b. Things to Keep in Mind<br />
3. The Wallis Test (Fourth-Order Autocorrelation)<br />
H. Correcting for First-Order Autocorrelation<br />
1. The Prais-Winsten GLS Estimator<br />
a. Procedure<br />
b. Pro<strong>of</strong><br />
2. Other GLS Methods<br />
----------------------------------------------------------------------------------------------------------------------------------------------------------------------------------------------------------------<br />
Packet X<strong>II</strong>. Dichotomous Dependent Variables<br />
#19 A. Examples<br />
B. The Binary Choice Model<br />
1. Description and Illustration<br />
2. Problems Using OLS With a Dichotomous Dependent Variable<br />
a. Over- or Under-Estimating Y<br />
b. Var(e), Heteroscedasticity, and the Goldberger Procedure<br />
c. Probable Non-Linearity<br />
3. Using an S-Shaped Curve Instead <strong>of</strong> a Line<br />
a. Description and Theory<br />
b. Fit and Bias
C. The Logit Model<br />
1. The Logistic Function and Log-Odds<br />
2. Interpreting Logit Coefficients<br />
3. Presenting the Results <strong>of</strong> Logit Analysis: An Example<br />
4. Estimating Coefficients: Maximum Likelihood Estimation<br />
5. Significance <strong>of</strong> Coefficients: The Likelihood Ratio Test<br />
6. Analogies to OLS<br />
----------------------------------------------------------------------------------------------------------------------------------------------------------------------------------------------------------------<br />
Packet<br />
D. The Probit Model<br />
#20 1. N(0,1), the Normal (Gaussian) CDF, and the Probit Function<br />
2. Interpreting and Presenting Probit Coefficients<br />
3. Maximum Likelihood Estimation <strong>of</strong> Probit Models<br />
E. Deciding Between Using Logit and Probit<br />
X<strong>II</strong>I. Chart: Some Potential Problems When Using OLS Regression Models<br />
XIV. Final Remarks<br />
A. Multiple Equations: Simultaneous Equations Models<br />
B. Additional Topics for Further Study<br />
C. The Importance <strong>of</strong> Parsimony and Presentation<br />
D. The Dangers <strong>of</strong> Over-Reliance on Statistical Procedures<br />
===============================================================================================<br />
Some Suggested Readings<br />
As mentioned earlier, the “Lecture Transcripts” that I wrote and we use in each class serve as the<br />
functional equivalence <strong>of</strong> a textbook for this course, and the preceding outline serves as its “Table <strong>of</strong><br />
Contents” and “Index.” The additional readings in this section <strong>of</strong> the syllabus (details <strong>of</strong> which can be<br />
found in the “Bibliography” section that immediately follows) are 100% optional for you.<br />
Several <strong>of</strong> these readings are from the following four “traditional” textbooks, each <strong>of</strong> which I like a lot.<br />
While there are great similarities between them, I think that each takes a somewhat different (though at<br />
times only subtly different...) pedagogical approach.<br />
• Gujarati takes more <strong>of</strong> a “Math Language” (though certainly not purely so...) approach.<br />
• Hamilton takes more <strong>of</strong> a “Picture Language” (i.e., lots <strong>of</strong> graphics, etc.) approach.<br />
• Kennedy takes more <strong>of</strong> an “English Language” (i.e., explanations using verbiage) approach.<br />
• Wooldridge takes more <strong>of</strong> a “Combined” (and somewhat more introductory) approach.<br />
You will also notice several “little green books” from the Sage Series on Quantitative Applications in the<br />
Social Sciences.<br />
Finally, I have included several articles from a number <strong>of</strong> journals across several academic disciplines —<br />
some that are older “classics” and some others that are newer and more recently published.
Lecture Packet<br />
Packets #1 and #2<br />
Some Suggested OPTIONAL Readings (In Alphabetical Order)<br />
Gujarati: Appendix A<br />
Hamilton: 289-296<br />
Mohr<br />
Wooldridge: Appendix A.1-A.4, B, C<br />
Packet #3 Gujarati: Introduction; Ch. 1-2; Sec. 5.1-5.3, 5.5-5.8<br />
Hamilton: 29-34, 42-49, 296-297<br />
Kennedy: Sec. 1.1; Appendix A<br />
Lewis-Beck: 9-20, 26-38<br />
Schroeder, Sjoquist, and Stephan: 11-23, 81-82<br />
Wooldridge: Ch. 1-2<br />
Packet #4 Achen (1982): 73-77<br />
Achen (1991)<br />
Gujarati: Ch. 3-4; Sec. 5.9, 6.1-6.3<br />
Hamilton: 37-41, 49-51, 124-125<br />
Kennedy: Sec. 1.2<br />
King (1986)<br />
King (1990)<br />
Lewis-Beck: 20-25<br />
Lewis-Beck and Skalaban<br />
Schroeder, Sjoquist, and Stephan: 23-29, 31-32<br />
Packet #5 Hamilton: 53-58, 148<br />
Packet #6 Goertzel (2004)<br />
Gujarati: Sec. 5.10-5.13<br />
Hamilton: 34-37, 41-42, 51-53, 58-59<br />
Kennedy: Sec. 2.10<br />
Lewis-Beck: 38-47<br />
Packet #7 Achen (1982): 7-51<br />
Asher: 237-248<br />
Berry: 1-24, 81-83<br />
Berry and Feldman: 9-15<br />
Fox: 3-9<br />
Gujarati: Sec. 7.1-7.4, 8.1-8.4<br />
Hamilton: 65-72, 109-113<br />
Kennedy: Sec. 1.3-1.4, 2.1-2.3, 4.1-4.2; Ch. 3<br />
Lewis-Beck: 47-52, 53-54<br />
Schroeder, Sjoquist, and Stephan: 29-31<br />
Wooldridge: Ch. 3, 5; Sec. 4.1-4.3
Lecture Packet<br />
Some Suggested OPTIONAL Readings (In Alphabetical Order)<br />
Packet #8 Berry: 24-27<br />
Berry and Feldman: 15-16<br />
Brambor, Clark, and Golder<br />
Braumoeller<br />
Davenport, Armstrong, and Lichbach<br />
Friedrich<br />
Gujarati: Sec. 7.5, 7.6, 7.8<br />
Hamilton: 77-80, 84-85<br />
Kennedy: Sec. 2.4-2.8, 2.11<br />
Lewis-Beck: 52-53, 54-56<br />
Schroeder, Sjoquist, and Stephan: 32-51, 54-56, 58-59<br />
Wooldridge: Sec. 6.3<br />
Packet #9 Asher: 248-250<br />
Berry: 45-47<br />
Berry and Feldman: 37-50, 64-70<br />
Fox: 10-21<br />
Gujarati: Sec. 9.1-9.4, 9.6, 9.12; Ch. 10<br />
Hamilton: 82, 85-92, 133-136<br />
Hardy: 1-21, 29-48<br />
Kennedy: Ch. 11, 14<br />
Lewis-Beck: 58-63, 66-71<br />
Schroeder, Sjoquist, and Stephan: 56-58, 71-72<br />
Wooldridge: Sec. 7.1-7.3; 244-249<br />
Packet #10 Achen (1982): 51-73; 77-79<br />
Asher: 250-255<br />
Berry: 27-41, 60-66<br />
Berry and Feldman: 18-37, 71-72<br />
Fox: 53-61<br />
Gujarati: Sec. 7.7, 7.10, 7.12, 13.1-13.5, 13.12, 13.13; 536-537<br />
Halvorsen and Palmquist<br />
Hamilton: 72-77, 82-84, 148-153, 163-167, 173-174<br />
Kennedy: Sec. 9.3; Ch. 5, 6, 7, 12<br />
Lewis-Beck: 56-58, 63-66<br />
Schroeder, Sjoquist, and Stephan: 53, 59-61, 65-71<br />
Wooldridge: Sec. 6.1, 6.2, 9.3; 304-307, 325-328<br />
Packet #11 Achen (2002)<br />
Achen (2005)<br />
Berry: 41-45, 49-60<br />
Eisenberg and Wells<br />
Hamilton: 158-163<br />
Lewis-Beck: 71-73<br />
Schroeder, Sjoquist, and Stephan: 63-65<br />
Wooldridge: Sec. 4.6, 6.4
Lecture Packet<br />
Packet #12<br />
Some Suggested OPTIONAL Readings (In Alphabetical Order)<br />
Bollen and Jackman<br />
Chatterjee and Wiseman<br />
Fox: 21-40<br />
Gujarati: 540-542<br />
Hamilton: Ch. 1; 113-117, 125-133, 141 (note #4), 154-158<br />
Kennedy: Sec. 20.1-20.2<br />
Wooldridge: 328-333<br />
Packet #13 Berry and Feldman: 17-18<br />
Gujarati: Sec. 8.5<br />
Hamilton: 92-101<br />
Kennedy: Sec. 4.3-4.4<br />
Mock and Weisberg<br />
Schroeder, Sjoquist, and Stephan: 51-52<br />
Wooldridge: 160-161<br />
Packet #14 Fox: 61-65<br />
Gujarati: Sec. 8.6-8.8, 8.12, 9.5, 9.8, 13.7<br />
Hamilton: 80-82, 101<br />
Hardy: 21-29, 48-53, 78-82, 84-85<br />
McDaniel<br />
Wooldridge: Ch. 19; Sec. 4.4; 150-160, 161-162, 249-252<br />
Packet #15<br />
Packet #16<br />
Gujarati: Appendix B<br />
Hamilton: 333-337, 344-345<br />
Namboodiri: 7-55<br />
Wooldridge: Appendix D<br />
Achen (1982): Appendix<br />
Fox: 80-82, 83-85<br />
Gujarati: Sec. 8.9; Appendix C.1-C.10, C.12<br />
Hamilton: 338-344<br />
Wooldridge: Appendix E<br />
Packet #17 Berry: 67, 72-78<br />
Berry and Feldman: 73-88<br />
Fox: 49-53, 87-89<br />
Gujarati: Ch. 11; Appendix C.11<br />
Hamilton: 183-189<br />
Hardy: 53-61<br />
Kennedy: Sec. 8.1-8.3<br />
Schroeder, Sjoquist, and Stephan: 75-77<br />
Wooldridge: Sec. 8.1-8.4
Lecture Packet<br />
Some Suggested OPTIONAL Readings (In Alphabetical Order)<br />
Packet #18 Berry: 67-72, 78-81<br />
Gujarati: Ch. 12<br />
Hamilton: 118-124<br />
Hardy: 82-84<br />
Kennedy: Sec. 8.4, 9.4<br />
Schroeder, Sjoquist, and Stephan: 72-75<br />
Wooldridge: Ch. 10, 12; Sec. 11.5<br />
Packet #19<br />
Ai and Norton<br />
Berry: 47-49<br />
Gujarati: Sec. 15.1-15.8<br />
Hamilton: Ch. 7<br />
Hardy: 75-78<br />
Kennedy: Sec. 2.9, 15.1<br />
Markus: 555-556<br />
Pampel: Ch. 1-3; Appendix<br />
Schroeder, Sjoquist, and Stephan: 79-80<br />
Wooldridge: Sec. 7.5, 8.5, 17.1<br />
Packet #20 Asher: 255-256, 260-261<br />
Berry and Feldman: 88-89<br />
Fox: 75-80<br />
Goertzel (2002)<br />
Granato<br />
Gujarati: Sec. 15.9, 15.10, 15.13, 15.14; Ch. 18<br />
Hamilton: 246 (note #2), 249-252, 281-282<br />
Kennedy: Ch. 10, 21<br />
Lewis-Beck: 73-74<br />
Pampel: Ch. 4-5<br />
Schroeder, Sjoquist, and Stephan: 77-79, 80<br />
Wooldridge: Sec. 7.6, 9.2, 15.1-15.5, 16.1-16.4<br />
Bibliography<br />
Achen, C. Interpreting and Using Regression. Sage <strong>University</strong> Paper Series on Quantitative<br />
Applications in the Social Sciences, #029, 1982.<br />
Achen, C. “What Does ‘Explained Variance’ Explain?: Reply.” In Political Analysis, Vol. 2 (1990). The<br />
<strong>University</strong> <strong>of</strong> <strong>Michigan</strong> Press, 1991. Pages 173-184.<br />
Achen, C. “Toward a New Political Methodology: Micr<strong>of</strong>oundations and ART.” In Annual Review <strong>of</strong><br />
Political Science, Vol. 5 (2002). Pages 423-450.<br />
Achen, C. “Let’s Put Garbage-Can Regressions and Garbage-Can Probits Where They Belong.” Conflict<br />
Management and Peace Science 22:4 (January 2005), pages 327-339.
Ai, C. and Norton, E. C. “Interaction Terms in Logit and Probit Models.” Economics Letters 80 (2003),<br />
pages 123-129.<br />
Asher, H. B. “Regression Analysis.” In Asher, H. B., Weisberg, H. F., Kessel, J. H., and Shively, W. P.,<br />
Theory-Building and Data Analysis in the Social Sciences. <strong>University</strong> <strong>of</strong> Tennessee Press, 1984.<br />
Pages 237-261.<br />
Berry, W. Understanding Regression Assumptions. Sage <strong>University</strong> Paper Series on Quantitative<br />
Applications in the Social Sciences, #092, 1993.<br />
Berry, W. and Feldman, S. Multiple Regression in Practice. Sage <strong>University</strong> Paper Series on<br />
Quantitative Applications in the Social Sciences, #050, 1985.<br />
Bollen, K. and Jackman, R. “Regression Diagnostics: An Expository Treatment <strong>of</strong> Outliers and<br />
Influential Cases.” In Fox, J. and Long, J. S., eds., Modern Methods <strong>of</strong> Data Analysis. Sage<br />
Publications, 1990, pages 257-291.<br />
Brambor, T., Clark, W. R., and Golder, M. “Understanding Interaction Models: Improving Empirical<br />
Analysis.” Political Analysis 14(1) (2006), pages 63-82.<br />
Braumoeller, B. F. “Hypothesis Testing and Multiplicative Interaction Terms.” International<br />
Organization 58:4 (Fall 2004), pages 807-820.<br />
Chatterjee, S. and Wiseman, F. “Use <strong>of</strong> Regression Diagnostics in Political Science Research.”<br />
American Journal <strong>of</strong> Political Science 27 (August 1983), pages 601-613.<br />
Davenport, C., Armstrong, D., and Lichbach, M. “Conflict Escalation and the Origins <strong>of</strong> Civil War.”<br />
Paper presented at the annual meeting <strong>of</strong> the Midwest Political Science Association, Chicago,<br />
Illinois, USA. April 7, 2005.<br />
Eisenberg, T. and Wells, M. “The Significant Association Between Punitive and Compensatory Damages<br />
in Blockbuster Cases: A Methodological Primer.” Journal <strong>of</strong> Empirical Legal Studies 3:1 (March<br />
2006), pages 175-195.<br />
Fox, J. Regression Diagnostics. Sage <strong>University</strong> Paper Series on Quantitative Applications in the Social<br />
Sciences, #079, 1991.<br />
Friedrich, R. F. “In Defense <strong>of</strong> Multiplicative Terms in Multiple Regression Equations.” American<br />
Journal <strong>of</strong> Political Science 26 (November 1982), pages 797-837.<br />
Goertzel, T. “Myths <strong>of</strong> Murder and Multiple Regression.” Skeptical Inquirer 26:1 (January/February<br />
2002), pages 19-23.<br />
Goertzel, T. “Capital Punishment and Homicide: Sociological Realities and Econometric Illusions.”<br />
Skeptical Inquirer 28:4 (July/August 2004), pages 23-27.<br />
Granato, J. “An Agenda for Econometric Model Building.” In Political Analysis, Vol. 3 (1991). The<br />
<strong>University</strong> <strong>of</strong> <strong>Michigan</strong> Press, 1992. Pages 123-154.<br />
Gujarati, D. Basic Econometrics, Fourth Edition. McGraw-Hill, 2003.
Halvorsen, R., and Palmquist, R. “The Interpretation <strong>of</strong> Dummy Variables in Semilogarithmic<br />
Equations.” The American Economic Review 70:3 (June, 1980), pages 474-475.<br />
Hamilton, L. Regression with Graphics: A Second Course in Applied Statistics. Duxbury, 1992.<br />
(Note: This is the same as the edition published by Brooks Cole in 1999.)<br />
Hardy, M. A. Regression With Dummy Variables. Sage <strong>University</strong> Paper Series on Quantitative<br />
Applications in the Social Sciences, #093, 1993.<br />
Kennedy, P. A Guide to Econometrics, Fifth Edition. MIT Press, 2003.<br />
King, G. “How Not to Lie With Statistics: Avoiding Common Mistakes in Quantitative Political<br />
Science.” American Journal <strong>of</strong> Political Science 30 (August 1986), pages 666-687.<br />
King, G. “Stochastic Variation: A Comment on Lewis-Beck and Skalaban’s ‘The R-Squared’.” In<br />
Political Analysis, Vol. 2 (1990). The Univ. <strong>of</strong> <strong>Michigan</strong> Press, 1991. Pages 185-200.<br />
Lewis-Beck, M. Applied Regression: An Introduction. Sage <strong>University</strong> Paper Series on Quantitative<br />
Applications in the Social Sciences, #022, 1980.<br />
Lewis-Beck, M. and Skalaban, A. “The R-Squared: Some Straight Talk.” In Political Analysis, Vol. 2<br />
(1990). Ann Arbor: The <strong>University</strong> <strong>of</strong> <strong>Michigan</strong> Press, 1991. Pages 153-171.<br />
Markus, G. B. “Political Attitudes during an Election Year: A Report on the 1980 NES Panel Study.”<br />
American Political Science Review 76 (September 1982), pages 538-560.<br />
McDaniel, T. “Categorical Independent Variables in Ordinary Least Squares Regression.” 1996.<br />
(Note: A copy <strong>of</strong> this paper is included in the class notes.)<br />
Mock, C. and Weisberg, H. “Political Innumeracy: Encounters With Coincidence, Improbability, and<br />
Chance.” American Journal <strong>of</strong> Political Science 36 (Nov. 1992), pages 1023-1046.<br />
Mohr, L. Understanding Significance Testing. Sage <strong>University</strong> Paper Series on Quantitative<br />
Applications in the Social Sciences, #073, 1990.<br />
Namboodiri, K. Matrix Algebra: An Introduction. Sage <strong>University</strong> Paper Series on Quantitative<br />
Applications in the Social Sciences, #038, 1984.<br />
Pampel, F. C. Logistic Regression: A Primer. Sage <strong>University</strong> Paper Series on Quantitative Applications<br />
in the Social Sciences, #132, 2000.<br />
Schroeder, L. D., Sjoquist, D. L., and Stephan, P. E. Understanding Regression Analysis. Sage<br />
<strong>University</strong> Paper Series on Quantitative Applications in the Social Sciences, #057, 1986.<br />
Wooldridge, J. M. Introductory Econometrics: A Modern Approach, Third Edition. Thompson/South-<br />
Western, 2006.