CrimeStat Version 3.3 Update Notes: - icpsr
CrimeStat Version 3.3 Update Notes: - icpsr
CrimeStat Version 3.3 Update Notes: - icpsr

Create successful ePaper yourself
Turn your PDF publications into a flip-book with our unique Google optimized e-Paper software.
<strong>CrimeStat</strong> <strong>Version</strong> <strong>3.3</strong> <strong>Update</strong> <strong>Notes</strong>:<br />
Part 2: Regression Modeling<br />
Ned Levine Dominique Lord Byung-Jung Park<br />
Ned Levine & Associates Zachry Dept. of Korea Transport Institute<br />
Houston, TX Civil Engineering Goyang, South Korea<br />
Texas A & M University<br />
College Station, TX<br />
July 2010
Table of Contents<br />
Introduction 1<br />
Functional Relationships 1<br />
Normal Linear Relationships 1<br />
Ordinary Least Squares 2<br />
Maximum Likelihood Estimation 3<br />
Assumptions of Normal Linear Regression 5<br />
Normal Distribution of Dependent Variable 5<br />
Errors are Independent, Constant, and Normally-distributed 5<br />
Independence of Independent Variables 5<br />
Adequate Model Specification 6<br />
Example of Modeling Burglaries by Zones 6<br />
Example Normal Linear Model 8<br />
Summary Statistics for the Goodness-of-Fit 8<br />
Statistics on Individual Coefficients 11<br />
Estimated Error in the Model for Individual Coefficients 13<br />
Violations of Assumptions for Normal Linear Regression 16<br />
Non-constant Summation 16<br />
Non-linear Effects 16<br />
Greater Residual Errors 17<br />
Corrections to Violated Assumptions in Normal Linear Regression 17<br />
Eliminating Unimportant Variables 17<br />
Eliminating Multicollinearity 18<br />
Transforming the Dependent Variable 19<br />
Example of Transforming the Dependent Variable 19<br />
Count Data Models 21<br />
Poisson Regression 21<br />
Advantages of the Poisson Regression Model 24<br />
Example of Poisson Regression 24<br />
Likelihood Statistics 24<br />
Model Error Estimates 25<br />
Over-dispersion Tests 27<br />
Individual Coefficient Statistics 27<br />
Problems with the Poisson Regression Model 27<br />
Over-dispersion in the Residual Errors 27<br />
Poisson Regression with Linear Dispersion Correction 28<br />
Example of Poisson Model with Linear Dispersion Correction (NB1) 30<br />
Poisson-Gamma (Negative Binomial) Regression 32<br />
Example 1 of Negative Binomial Regression 34<br />
Example 2 of Negative Binomial Regression with Highly Skewed Data 34<br />
Advantages of the Negative Binomial Model 37<br />
Disadvantages of the Negative Binomial Model 37<br />
i
Table of Contents (continued)<br />
Alternative Regression Models 39<br />
Limitations of the Maximum Likelihood Approach 39<br />
Markov Chain Monte Carlo (MCMC) Simulation of Regression Functions 40<br />
Hill Climbing Analogy 40<br />
Bayesian Probability 41<br />
Bayesian Inference 42<br />
Markov Chain Sequences 43<br />
MCMC Simulation 44<br />
Step 1: Specifying a Model 44<br />
Poisson-Gamma Model 44<br />
Poisson-Gamma-Conditional Autoregressive (CAR) Model 45<br />
Spatial Component 45<br />
Step 2: Setting Up a Likelihood Function 46<br />
Step 3: Defining a Joint Posterior Distribution 46<br />
Step 4: Drawing Samples from the Full Conditional Distribution 47<br />
Step 5: Summarizing the Results from the Sample 49<br />
Why Run an MCMC when MLE is So Easy? 53<br />
Poisson-Gamma-CAR Model 54<br />
Negative Exponential Distance Decay 55<br />
Restricted Negative Exponential Distance Decay 55<br />
Contiguity Function 55<br />
Example of Poisson-Gamma-CAR Analysis of Houston Burglaries 56<br />
Spatial Autocorrelation of the Residuals from the Poisson-Gamma-CAR Model 58<br />
Risk Analysis 62<br />
Issues in MCMC Modeling 66<br />
Starting Values of Each Parameter 66<br />
Example of Defining Prior Values for Parameters 66<br />
Convergence 68<br />
Monitoring Convergence 72<br />
Statistically Testing Parameters 72<br />
Multicollinearity and Overfitting 72<br />
Multicollinearity 73<br />
Stepwise Variable Entry to Control Multicollinearity 75<br />
Overfitting 76<br />
Condition Number of Matrix 77<br />
Overfitting and Poor Prediction 77<br />
Improving the Performance of the MCMC Algorithm 78<br />
Scaling of the Data 79<br />
Block Sampling Method for the MCMC 80<br />
Comparison of Block Sampling Method with Full Dataset 81<br />
Test 1 81<br />
ii
Table of Contents (continued)<br />
Test 2 82<br />
Statistical Testing with Block Sampling Method 84<br />
The <strong>CrimeStat</strong> Regression Module 85<br />
Input Data Set 85<br />
Dependent Variable 85<br />
Independent Variables 87<br />
Type of Dependent Variable 87<br />
Type of Dispersion Estimate 87<br />
Type of Estimation Method 87<br />
Spatial Autocorrelation Estimate 87<br />
Type of Test Procedure 87<br />
MCMC Choices 88<br />
Number of Iterations 88<br />
‘Burn in’ Iterations 88<br />
Block Sampling Threshold 88<br />
Average Block Size 88<br />
Number of Samples Drawn 88<br />
Calculate Intercept 89<br />
Advanced Options 89<br />
Initial Parameter Values 89<br />
Rho (ρ) and Tauphi (τ ϕ ) 91<br />
Alpha (α) 91<br />
Diagnostic Test for Reasonable Alpha Value 92<br />
Value for 0 Distances Between Records 93<br />
Output 93<br />
Maximum Likelihood (MLE) Model Output 93<br />
MLE Summary Statistics 93<br />
Information About the Model 93<br />
Likelihood Statistics 94<br />
Model Error Estimates 94<br />
Over-dispersion Tests 94<br />
MLE Individual Coefficient Statistics 95<br />
Markov Chain Monte Carlo (MCMC) Model Output 95<br />
MCMC Summary Statistics 95<br />
Information About the Model 95<br />
Likelihood Statistics 96<br />
Model Error Estimates 96<br />
Over-dispersion Tests 96<br />
MCMC Individual Coefficient Statistics 97<br />
Expanded Output (MCMC Only) 98<br />
Output Phi Values (Poisson-Gamma-CAR Model Only) 98<br />
iii
Table of Contents (continued)<br />
Save Output 99<br />
Save Estimated Coefficients 99<br />
Diagnostic Tests 99<br />
Minimum and Maximum Values for the Variables 99<br />
Skewness Tests 100<br />
Testing for Spatial Autocorrelation in the Dependent Variable 101<br />
Estimating the Value of Alpha (α) for the Poisson-Gamma-CAR Model 102<br />
Multicollinearity Tests 102<br />
Likelihood Ratios 102<br />
Regression II Module 103<br />
References 105<br />
iv
Introduction 1<br />
The Regression I and Regression II modules are a series of routines for regression modeling and<br />
prediction. This update chapter will lay out the basics of regression modeling and prediction and will<br />
discuss the <strong>CrimeStat</strong> Regression I and II modules. The routines available in the two modules have also<br />
been applied to the Trip Generation model of the Crime Travel Demand module. Users wanting to<br />
implement that model should consult the documentation in this update chapter.<br />
We start by briefly discussing the theory and practice of regression modeling with examples.<br />
Later, we will discuss the particular routines available in <strong>CrimeStat</strong>.<br />
Functional Relationships<br />
The aim of a regression model is to estimate a functional relationship between a dependent<br />
variable (call it y<br />
i<br />
) and one or more independent variables (call them x1 i,<br />
xKi<br />
). In an actual database,<br />
these variables have unique names (e.g., ROBBERIES, POPULATION), but we will use general symbols<br />
to describe these variables. The functional relationship can be specified by an equation (Up. 2.1):<br />
y<br />
i<br />
f ( x 1<br />
, , x ) <br />
(Up. 2.1)<br />
i<br />
Ki<br />
i<br />
where Y is the dependent variable, x1 i<br />
, xKi<br />
are the independent variables, f ( ) is a functional<br />
relationship between the dependent variable and the independent variables, and <br />
i<br />
is an error term<br />
(essentially, the difference between the actual value of the dependent variable and that predicted by the<br />
relationship).<br />
Normal Linear Relationships<br />
The simplest relationship between the dependent variable and the independent variables is linear<br />
with the dependent variable being normally distributed,<br />
y<br />
i<br />
x<br />
<br />
x<br />
<br />
0 1 1i<br />
K Ki i<br />
(Up. 2.2)<br />
1<br />
This chapter is a result of the effort of many persons. The maximum likelihood routines were produced by Ian Cahill<br />
of Cahill Software in Ottawa, Ontario as part of his MLE++ software package. We are grateful to him for providing<br />
these routines and for conducting quality control tests on them. The basic MCMC algorithm in <strong>CrimeStat</strong> for the<br />
Poisson-Gamma and Poisson-Gamma-CAR models was designed by Dr. Shaw-Pin Miaou of College Station, TX. We<br />
are grateful for Dr. Miaou for this effort. Improvements to the algorithm were made by us, including the block<br />
sampling strategy and the calculation of summary statistics. The programmer for the routines was Ms. Haiyan Teng of<br />
Houston, TX who ensured that they worked. We are also grateful to Dr. Richard Block of Loyola University in<br />
Chicago (IL) for testing the MCMC and MLE routines.
This equation can be written in a simple matrix notation:<br />
yi<br />
x β where<br />
T<br />
T<br />
xi<br />
( 1, x1 i<br />
, ,<br />
xKi<br />
) and β ( 0,<br />
1,<br />
,<br />
<br />
K<br />
) . The number one in the first element of<br />
T<br />
an intercept. T denotes that the matrix xi<br />
is transposed.<br />
T<br />
i<br />
i<br />
T<br />
x<br />
i<br />
represents<br />
This function says that a unit change in each independent variable, x<br />
ki<br />
, for every observation, is<br />
associated with a unit change in the dependent variable,<br />
y<br />
i<br />
. The coefficient of each variable,<br />
specifies the amount of change in y<br />
i<br />
associated with that independent variable while keeping all other<br />
independent variables in the equation constant. The first term, <br />
0<br />
, is the intercept, a constant that is<br />
added to all observations. The error term, <br />
i<br />
, is assumed to be identically and independently distributed<br />
(iid) across all observations, normally distributed with an expected mean of 0 and a constant standard<br />
deviation. If each of the independent variables has been standardized by<br />
<br />
k<br />
,<br />
z<br />
k<br />
xk<br />
x<br />
(Up. 2.3)<br />
std( x k<br />
k)<br />
then the standard deviation of the error term will be 1.0 and the coefficients will be standardized, b 1 , b 2 ,<br />
b 3 , and so forth.<br />
The equation is estimated by one of two methods, ordinary least squares (OLS) and maximum<br />
likelihood estimation (MLE). Both solutions produce the same results. The OLS method minimizes the<br />
sum of the squares of the residual errors while the maximum likelihood approach maximizes a joint<br />
probability density function.<br />
Ordinary Least Squares<br />
Appendix C by Luc Anselin discusses the method in more depth. Briefly, the intercept and<br />
coefficients are estimated by choosing a function that minimizes the residual errors by setting<br />
N<br />
<br />
<br />
y<br />
<br />
K<br />
<br />
<br />
0<br />
<br />
k<br />
xki<br />
xki<br />
0<br />
(Up. 2.4)<br />
k<br />
<br />
i<br />
i1 1<br />
for k=1 to K independent variables or, in matrix notation:<br />
X T ( y Xβ)<br />
0<br />
(Up. 2.5)<br />
T<br />
T<br />
X Xβ X y<br />
(Up. 2.6)<br />
where<br />
T<br />
X and y y , y , , ) .<br />
T<br />
( x1,<br />
x2,<br />
,<br />
x<br />
N<br />
)<br />
(<br />
1 2<br />
<br />
y N<br />
2
The solution to this system of equations yields the familiar matrix expression for<br />
b<br />
b<br />
OLS<br />
(<br />
0,<br />
b1<br />
, ,<br />
b K<br />
OLS<br />
b )<br />
T<br />
T 1<br />
T<br />
( X X)<br />
X y<br />
(Up. 2.7)<br />
An estimate for the error variance follows as<br />
s<br />
2<br />
OLS<br />
<br />
N<br />
<br />
i1<br />
<br />
y<br />
<br />
i<br />
b<br />
0<br />
2<br />
K<br />
<br />
- bk<br />
xki<br />
/( N K 1)<br />
(Up. 2.8)<br />
k1<br />
<br />
or, in matrix notation,<br />
s<br />
2<br />
OLS<br />
T<br />
e e/(<br />
N K 1)<br />
(Up. 2.9)<br />
Maximum Likelihood Estimation<br />
For the maximum likelihood method, the likelihood of a function is the joint probability density<br />
of a series of observations (Wikipedia, 2010b; Myers, 1990). Suppose there is a sample of n independent<br />
observations ( x1,<br />
x2,<br />
, xN<br />
) that are drawn from an unknown probability density distribution but from a<br />
known family of distributions, for example the single-parameter exponential family. This is specified as<br />
f ( | θ)<br />
where θ is the parameter (or parameters if there are more than one) that define the uniqueness of<br />
the family. The joint density function will be:<br />
f ( x1,<br />
x2,<br />
, xN<br />
| θ)<br />
f ( x1<br />
| θ)<br />
f ( x2<br />
| θ)<br />
<br />
f ( xN<br />
| θ)<br />
(Up. 2.10)<br />
and is called the likelihood function:<br />
L(<br />
θ | x1,<br />
x2,<br />
, xN<br />
) f ( x1,<br />
x2,<br />
,<br />
xN<br />
| θ)<br />
f ( xi<br />
| θ)<br />
(Up. 2.11)<br />
N<br />
<br />
i1<br />
where L is the likelihood and ∏ is the product term.<br />
Typically, the likelihood function is interpreted in term of natural logarithms since the logarithm<br />
of a product is a sum of the logarithms of the individual terms. That is,<br />
N<br />
<br />
ln<br />
f ( xi<br />
| θ)<br />
ln<br />
1<br />
2<br />
<br />
i1<br />
<br />
This is called the Log likelihood function and is written as:<br />
f<br />
( x | θ)<br />
<br />
lnf<br />
( x | θ)<br />
<br />
lnf<br />
( x | θ)<br />
<br />
(Up. 2.12)<br />
n<br />
3
N<br />
<br />
<br />
ln L(<br />
θ | x1,<br />
x2,<br />
, x ) ln f ( x | θ)<br />
(Up. 2.13)<br />
N<br />
<br />
i1<br />
For the OLS model, the log likelihood is:<br />
where N is the sample size and<br />
i<br />
N<br />
N N 2 1<br />
T 2<br />
ln L ln(2 ) ln( ) (<br />
y i<br />
x<br />
2<br />
i<br />
β)<br />
(Up. 2.14)<br />
2 2 2<br />
ln L <br />
N<br />
i1<br />
2<br />
σ is the variance. For the Poisson model, the log likelihood is:<br />
<br />
i<br />
yi<br />
ln( i<br />
) ln yi!<br />
<br />
i1<br />
(Up. 2.15)<br />
where exp( x T i<br />
<br />
i<br />
β)<br />
is the conditional mean for zone i, and y<br />
i<br />
is the observed number of events for<br />
zone i. As mentioned, Anselin provides a more detailed discussion of these functions in Appendix C.<br />
The MLE approach estimates the value of θ that maximizes the log likelihood of the data coming<br />
from this family. Because they are all part of the same mathematical family, the maximum of a joint<br />
probability density distribution can be easily estimated. The approach is to, first, define a probability<br />
function from this family, second, create a joint probability density function for each of the observations<br />
(the Likelihood function); third, convert the likelihood function to a log likelihood; and, fourth, estimate<br />
the value of parameters that maximize the joint probability through an approximation method (e.g.,<br />
Newton-Raphson or Fisher scores). Because the function is regular and known, the solution is relatively<br />
easy. Anselin discusses the approach in detail in Appendix C of the <strong>CrimeStat</strong> manual. More detail can<br />
be found in Hilbe (2008).<br />
In <strong>CrimeStat</strong>, we use the MLE method. Because the OLS method is the most commonly used, a<br />
normal linear model is sometimes called an Ordinary Least Squares (OLS) regression. If the equation is<br />
correctly specified (i.e., all relevant variables are included), the error term, , will be normally<br />
2<br />
distributed with a mean of 0 and a constant variance, σ .<br />
The OLS normal estimate is sometimes known as a Best Linear Unbiased Estimate (BLUE) since<br />
it minimizes the sum of squares of the residuals errors (the difference between the observed and predicted<br />
values of y ). In other words, the overall fit of the normal model estimated through OLS or maximum<br />
likelihoods will produce the best overall fit for a linear model. However, keep in mind that because a<br />
normal function has the best overall fit does not mean that it fits any particular section of the dependent<br />
variable better. In particular, for count data, the normal model often does a poor job of modeling the<br />
observations with the greatest number of events. We will demonstrate this with an example below.<br />
4
Assumptions of Normal Linear Regression<br />
The normal linear model has some assumptions. When these assumptions are violated, problems<br />
can emerge in the model, sometimes easily correctable and other times introducing substantial bias.<br />
Normal Distribution of Dependent Variable<br />
First, the normal linear model assumes that the dependent variable is normally distributed. If the<br />
dependent variable is not exactly normally distributed, it has to have its peak somewhere in the middle of<br />
the data range and be somewhat symmetrical (e.g., a quartic distribution; see chapter 8 in the <strong>CrimeStat</strong><br />
manual).<br />
For some variables, this assumption is reasonable (e.g., with height or weight of individuals).<br />
However, for most variables that crime researchers work with (e.g., number of robberies, number of<br />
homicides, journey-to-crime distances), this assumption is usually violated. Most variables that are<br />
counts (i.e., number of discrete events) are highly skewed. Consequently, when it comes to counts and<br />
other extremely skewed variables, the normal (OLS) model may produce distorted results.<br />
Errors are Independent, Constant, and Normally-distributed<br />
Second, the errors in the model, the ε in equation Up. 2.2, must be independent of each other,<br />
constant, and normally distributed. This fits the iid assumption mentioned above. Independence means<br />
that the estimation error for any one observation cannot be related to the error for any other observation.<br />
Constancy means that the amount of error should be more or less the same for every observation; there<br />
will be natural variability in the errors, but this variability should be distributed normally with the mean<br />
error being the expected value.<br />
Unfortunately, for most of the variables that crime researchers and analysts work with, this<br />
assumption is usually violated. With count variables, the errors increase with the count and are much<br />
higher for observations with large counts than for observation with few counts. Thus, the assumption of<br />
constancy is violated. In other words, the variance of the error term is a function of the count. The shape<br />
of the error distribution is also sometimes not normal either but may be more skewed. Also, if there is<br />
spatial autocorrelation among the error terms (which would be expected in a spatial distribution), then the<br />
error term may be quite irregular in shape; in this latter case, the assumption of independent observations<br />
would also be violated.<br />
Independence of Independent Variables<br />
Third, an assumption of the normal model (and any model, for that matter) is that the independent<br />
variables are truly independent. In theory, there should be zero correlation between any of the<br />
independent variables. In practice, however, many variables are related, sometimes quite highly. This<br />
condition, which is called multicollinearity, can sometimes produce distorted coefficients and overall<br />
model effects. The higher the degree of multicollinearity among the independent variables, the greater<br />
the distortion in the coefficients. This problem affects all types of models, not just the normal, and it is<br />
5
important to minimize the effects. We will discuss diagnostic methods for identifying multicollinearity<br />
later in the chapter.<br />
Adequate Model Specification<br />
Fourth, the normal model assumes that the independent variables have been correctly specified.<br />
That is, the independent variables are the correct ones to include in the equation and that they have been<br />
measured adequately. By ‘correct ones’, we mean that the independent variable chosen should be a true<br />
predictor of the dependent variable, not an extraneous one. With any model, the more independent<br />
variables that are added to the equation, in general the greater will be the overall fit. This will be true<br />
even if the independent variables are highly correlated with independent variables already in the equation<br />
or are mostly irrelevant (but may be slightly correlated due to sampling error). When too many variables<br />
are added to an equation, strange effects can occur. Overfitting of a model is a serious problem that must<br />
be seriously evaluated. Including too many variables will also artificially increase the model’s variance<br />
(Myers, 1990).<br />
Conversely, a correct specification implies that all the important variables have been included and<br />
that none have been left out. When importance variables are not included, this is called underfitting a<br />
model. Also, not including important variables lead to a biased model (known as the omitted variables<br />
bias). A large bias means that the model is unreliable for prediction (Myers, 1990). Also, the left out<br />
variables can be shown to have irregular effects on the error terms. For example, if there is spatial<br />
autocorrelation in the dependent variable (which there usually is), then the error terms will be correlated.<br />
Without modeling the spatial autocorrelation (either through a proxy variable that captures much of its<br />
effect or through a parameter adjustment), the error can be biased and even the coefficients can be biased.<br />
In other words, adequate specification involves choosing the correct number of independent<br />
variables that are appropriate, neither overfitting nor underfitting of the model. Also, it is assumed that<br />
the variables have been correctly measured and that the amount of measurement error is very small.<br />
Unfortunately, we often do not know whether a model is correctly specified or not, nor whether<br />
the variables have been properly measured. Consequently, there are a number of diagnostics tests that can<br />
be brought to bear to reveal whether the specification is adequate. For overfitting, there are tolerance<br />
statistics and adjusted summary values. For underfitting, we analyze the error distribution to see if there<br />
is a pattern that might indicate lurking variables that are not included in the model. In other words,<br />
examining violations of the assumptions of a model is an important task in assessing whether there are too<br />
many variables included or whether there are variables that should be included but are not, or whether the<br />
specification of the model is correct or not. This is an important task in regression modeling.<br />
Example of Modeling Burglaries by Zones<br />
For many problems, normal regression is an appropriate tool. However, for many others, it is not.<br />
Let us illustrate this point. A note of caution is warranted here. This example is used to illustrate the<br />
application of the normal model in <strong>CrimeStat</strong> and, as discussed further below, the normal model with a<br />
normal error distribution is not appropriate for this kind of dataset. For example, figure Up. 2.1 show<br />
6
Figure Up. 2.1:
the number of residential burglaries that occurred in 2006 within 1,179 Traffic Analysis Zones (TAZ)<br />
inside the City of Houston. The data on burglaries came from the Houston Police Department. The<br />
burglaries were then allocated to the 1,179 traffic analysis zones within the City of Houston. As can be<br />
seen, there is a large concentration of residential burglaries in southwest Houston with small<br />
concentrations in southeast Houston and in parts of north Houston.<br />
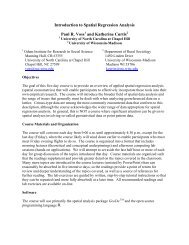
The distribution of burglaries by zones is quite skewed. Figure Up. 2.2 show a graph of the<br />
number of burglaries per zone. Of the 1,179 traffic analysis zones, 250 had no burglaries occur within<br />
them in 2006. On the other hand, one zone had 284 burglaries occur within it. The graph show the<br />
number of burglaries up to 59; there were 107 zones with 60 or more burglaries that occurred in them.<br />
About 58% of the burglaries occurred in 10% of the zones. In general, a small percentage of the zones<br />
had the majority of the burglaries, a result that is very typical of crime counts.<br />
Example Normal Linear Model<br />
We can set up a normal linear model to try to predict the number of burglaries that occurred in<br />
each zone in 2006. We obtained estimates of population, employment and income from the<br />
transportation modeling group within the Houston-Galveston Area Council, the Metropolitan Planning<br />
Organization for the area (H-GAC, 2010). Specifically, the model relates the number of 2006 burglaries<br />
to the number of households, number of jobs (employment), and median income of each zone. The<br />
estimates for the number of households and jobs were for 2006 while the median income was that<br />
measured by the 2000 census. Table Up. 2.1 present the results of the normal (OLS) model.<br />
Summary Statistics for the Goodness-of-Fit<br />
The table presents two types of results. First, there is summary information. Information on the<br />
size of the sample (in this case, 1,179) and the degrees of freedom (the sample size less one for each<br />
parameter estimated including the intercept and one for the mean of the dependent variable); in the<br />
example, there are 1,174 degrees of freedom (1,179 – 1 for the intercept, 1 for HOUSEHOLDS, 1 for<br />
JOBS, 1 for MEDIAN HOUSEHOLD INCOME, and 1 for the mean of the dependent variable, 2006<br />
BURGLARIES).<br />
The F-test presents an Analysis of Variance test of the ratio of the mean square error (MSE) of<br />
the model compared to the total mean square error (Kanji, 1994, 131; Abraham & Ledolter, 2006, 41-51).<br />
Next, there is the R-square (or R 2 ) statistic, which is the most common type of overall fit test. This is the<br />
percent of the total variance of the dependent variable accounted for by the model. More formally, it is<br />
defined as:<br />
R<br />
2<br />
<br />
<br />
( y ˆ<br />
i<br />
yi<br />
)<br />
1<br />
2<br />
( y y)<br />
i<br />
2<br />
(Up. 2.16)<br />
8
300<br />
250<br />
Figure Up. 2.2:<br />
Houston Burglaries in 2006:<br />
Number of Burglaries Per Zone<br />
200<br />
Numbe er of zones<br />
150<br />
100<br />
50<br />
0<br />
0 5 10 15 20 25 30 35 40 45 50 55 60+<br />
Number of burglaries per zone
Table Up. 2.1:<br />
Predicting Burglaries in the City of Houston: 2006<br />
Ordinary Least Squares: Full Model<br />
(N= 1,179 Traffic Analysis Zones)<br />
DepVar:<br />
2006 BURGLARIES<br />
N: 1,179<br />
Df: 1,174<br />
Type of regression model:<br />
Ordinary Least Squares<br />
F-test of model: 357.2 p≤.0001<br />
R-square: 0.48<br />
Adjusted r-square: 0.48<br />
Mean absolute deviation: 13.5<br />
1 st (highest) quartile: 26.4<br />
2 nd quartile: 10.6<br />
3 rd quartile: 8.3<br />
4 th (lowest) quartile: 8.8<br />
Mean squared predictive error: 505.1<br />
1 st (highest) quartile: 1,497.5<br />
2 nd quartile: 270.4<br />
3 rd quartile: 134.3<br />
4 th (lowest) quartile: 120.9<br />
-----------------------------------------------------------------------------<br />
Predictor DF Coefficient Stand Error Tolerance t-value p<br />
INTERCEPT 1 12.9320 1.269 - 10.19 0.001<br />
HOUSEHOLDS 1 0.0256 0.0008 0.923 31.37 0.001<br />
JOBS 1 -0.0002 0.0005 0.903 -0.453 n.s.<br />
MEDIAN<br />
HOUSEHOLD<br />
INCOME 1 -0.0002 0.00003 0.970 -6.88 0.001<br />
-----------------------------------------------------------------------------<br />
where y<br />
i<br />
is the observed number of events for a zone, i, ŷ<br />
i<br />
is the predicted number of events given a set<br />
of K independent variables, and Mean y is the mean number of events across zones. The R-square<br />
value is a number from 0 to 1; 0 indicates no predictability while 1 indicates perfect predictability.<br />
For a normal (OLS) model, R-square is a very consistent estimate. It increases in a linear manner<br />
with predictability and is a good indicator of how effective a model has fit the data. As with all<br />
diagnostic statistics, the value of the R-square increases with more independent variables. Consequently,<br />
an R-square adjusted for degrees of freedom is also calculated - the adjusted r-square in the table. This is<br />
(<br />
y<br />
<br />
2<br />
ˆ ) /( 1)<br />
2<br />
i<br />
yi<br />
N K<br />
Ra 1<br />
(Up. 2.17)<br />
2<br />
( y y)<br />
/( N 1)<br />
i<br />
10
where N is the sample size and K is the number of independent variables.<br />
The R 2 value is sometimes called the coefficient of determination. It is an indicator of the extent<br />
to which the independent variables in the model predict (or explain) the dependent variable. One<br />
interpretation of the R 2 is the percent of the variance of Y accounted for by the variance of the<br />
independent variables (plus the intercept and any other constraints added to the model). The unexplained<br />
variance is 1 - R 2 or the extent to which the model does not explain the variance of the dependent<br />
variable. For a normal linear model, the R 2 is relatively straightforward. In the example, both the F-test<br />
is highly significant and the R 2 is substantial (48% of the variance of the dependent variable is explained<br />
by the independent variables). However, for non-linear models, it is not at all an intuitive measure and<br />
has been shown to be unreliable (Miaou, 1996).<br />
The final two summary measures are Mean Squared Predictive Error (MSPE), which is the<br />
average of the squared residual errors, and the Mean Absolute Deviation (MAD), which is the average of<br />
the absolute value of the residual errors (Oh, Lyon, Washington, Persaud, & Bared, 2003). The lower the<br />
values of these measures, the better the model fits the data.<br />
These measures are also calculated for specific quartiles. The 1 st quartile represents the error<br />
associated with the 25% of the observations that have the highest values of the dependent variable while<br />
the 4 th quartile represents the error associated with the 25% of the observations with the lowest value of<br />
the dependent variable. These percentiles are useful for examining how well a model fits the data and<br />
whether the fit is better for any particular section of the dependent variable. In the example, the fit is<br />
better for the low end of the distribution (the zones with zero or few burglaries) and less good for the<br />
higher end. We will use these values in comparing the normal model to other models.<br />
It is important to point out that the summary measures are more useful when several models with<br />
a different number of variables are compared with each other than for evaluating a single model.<br />
Statistics on Individual Coefficients<br />
The second type of information presented is about each of the coefficients. The table lists the<br />
independent variable plus the intercept. For each coefficient, the degrees of freedom associated are<br />
presented (one per variable) plus the estimated linear coefficient. For each coefficient, there is an<br />
estimated standard error, a t-test of the coefficient (the coefficient divided by the standard error), and the<br />
approximate two-tailed probability level associated with the t-test (essentially, an estimate of the<br />
probability that the null hypothesis of zero coefficient is correct). Usually, if the probability level is<br />
smaller than 5% (.05), then we reject the null hypothesis of a zero coefficient though frequently 1% (.01)<br />
or even 0.1% (0.001) have been used to reduce the likelihood that a false alternative hypothesis has been<br />
selected (called a Type I error).<br />
The last parameter included in the table is the tolerance of the coefficient. This is a measure of<br />
multicollinearity (or one type of overfitting). Basically, it is the extent to which each independent<br />
variable correlates with the other dependent variables in the equation. The traditional tolerance test is a<br />
11
normal model relating each independent variable to the other independent variables (StatSoft, 2010; Berk,<br />
1977). It is defined as:<br />
Tol<br />
2<br />
i<br />
1<br />
R j i<br />
(Up. 2.18)<br />
2<br />
where R<br />
j i<br />
is the R-square associated with the prediction of one independent variable with the remaining<br />
independent variables in the model.<br />
In other words, the tolerance of each independent variable is the unexplained variance of a model<br />
that relates the variable to the other independent variables. If an independent variable is highly related to<br />
(correlated with) the other independent variables in the equation, then it will have a low tolerance.<br />
Conversely, if an independent variable is independent of the other independent variables in the equation,<br />
then it will have a high tolerance. In theory, the higher the tolerance, the better since each independent<br />
variable should be unrelated to the other independent variables. In practice, there is always some degree<br />
of overlap between the independent variables so that a tolerance of 1.0 is rarely, if ever, achieved.<br />
However, if the tolerance is low (e.g., 0.70 or below), this suggests that there is too much overlap in the<br />
independent variables and that the interpretation will be unclear. Later in the chapter, we will discuss<br />
multicollinearity and the general problem of overfitting in more detail.<br />
Looking specifically at the model in Table Up. 2.1, we see that the number of burglaries is<br />
positively associated with the intercept and the number of households and negatively associated with the<br />
median household income. The relationship to the number of jobs is also negative, but not significant.<br />
Essentially, zones with larger numbers of households but lower household incomes are associated with<br />
more residential burglaries. Because the model is linear, each of the coefficients contributes to the<br />
prediction in an additive manner. The intercept is 12.93 and indicates that, on average, each zone had<br />
12.93 burglaries. For every household in the zone, there was a contribution of 0.0256 burglaries. For<br />
every job in the zone, there was a contribution of -0.0002 burglaries. For every dollar increase in median<br />
household income, there is a decrease of -0.0002 burglaries. Thus, to predict the number of burglaries<br />
with the full model in any one zone, i, we would take the intercept – 12.93, and add in each of these<br />
components:<br />
( BURGLARIES)<br />
i<br />
12.93 0.0256( HOUSEHOLDS)<br />
0.0002( MEDIAN HOUSEHOLD INCOME)<br />
i<br />
0.0002( JOBS)<br />
i<br />
i<br />
(Up. 2.19)<br />
To illustrate, TAZ 833 had 1762 households in 2006, 2,698 jobs also in 2006, and had a median<br />
household income of $27,500 in 2000. The model’s prediction for the number of burglaries in TAZ 833<br />
is:<br />
Number of burglaries (TAZ833) = 12.93 + 0.0256*1762 – 0.0002*2,698 – 0.0002*27,500<br />
= 52.0<br />
The actual number of burglaries that occurred in TAZ 833 was 78.<br />
12
Estimated Error in the Model for Individual Coefficients<br />
In <strong>CrimeStat</strong>, and in most statistical packages, there is additional information that can be output<br />
as a file. There is the predicted value for each observation. Essentially, this is the linear prediction from<br />
the model. There is also the residual error, which is the difference between the actual (observed) value<br />
for each observation, i, and that predicted by the model. It is defined as:<br />
Residual error i = Observed Value i - Predicted value i (Up. 2.20)<br />
Table Up. 2.2 give predicted values and residual errors for five of the observations from the<br />
Houston burglary data set.<br />
Table Up. 2.2:<br />
Predicted Values and Residual Error for Houston Burglaries: 2006<br />
(5 Traffic Analysis Zones)<br />
Zone (TAZ) Actual value Predicted value Residual error<br />
833 78 52.0 26.0<br />
831 46 35.9 10.1<br />
911 89 67.6 21.4<br />
2173 30 42.3 -12.3<br />
2940 3 10.2 -7.2<br />
Analysis of the residual errors is one of the best tools for diagnosing problems with the model. A<br />
plot of the residual errors against the predicted values indicates whether the prediction is consistent across<br />
all values of the dependent variable and whether the underlying assumptions of the normal model are<br />
valid (see below). Figure Up. 2.3 show a graph of the residual errors of the full model against the<br />
predicted values for the model estimated in table 1. As can be seen, the model fits quite well for zones<br />
with few burglaries, up to about 12 burglaries per zone.<br />
However, for the zones with many predicted burglaries (the ones that we are most likely<br />
interested in), the model does quite poorly. First, the errors increase the greater than number of predicted<br />
burglaries. Sometimes the errors are positive, meaning that the actual number of burglaries is much higher<br />
than predicted and sometimes the errors are negative, meaning that we are predicting more burglaries than<br />
actually occurred. More importantly, the residual errors indicate that the model has violated one of the<br />
basic assumptions of the normal model, namely that the errors are independent, constant, and identicallydistributed.<br />
It is clear that they are not.<br />
Because there are errors in predicting the zones with the highest number of burglaries and<br />
because the zones with the highest number of burglaries were somewhat concentrated, there are spatial<br />
distortions from the prediction. Figure Up. 2.4 show a map of the residual errors of the normal model.<br />
As can be seen by comparing this map with the map of burglaries (figure Up. 2.1), typically the zones<br />
13
Figure Up. 2.3:
Figure Up. 2.4:
with the highest number of burglaries (mostly in southwest Houston) were under-estimated by the normal<br />
model (shown in red) whereas some zones with few burglaries ended up being over-estimated by the<br />
normal model (e.g., in far southeast Houston).<br />
In other words, the normal linear model is not necessarily good for predicting Houston burglaries.<br />
It tends to underestimate zones with a large number of burglaries but overestimates zones with few.<br />
Violations of Assumptions for Normal Linear Regression<br />
There are several deficiencies with the normal (OLS) model. First, normal models are not good<br />
at describing skewed dependent variables, as we have shown. Since crime distributions are usually<br />
skewed, this is a serious deficiency for multivariate crime analysis. Second, a normal model can have<br />
negative predictions. With a count variable, such as the number of burglaries committed in a zone, the<br />
minimum number is zero. That is, the count variable is always positive, being bounded by 0 on the lower<br />
limit and some large number on the upper limit. The normal model, on the other hand, can produce<br />
negative predicted values since it is additive in the independent variables. This clearly is illogical and is a<br />
major problem with data that are highly skewed. If most records have values close to zero, it is very<br />
possible for a normal model to predict a negative value.<br />
Non-consistent Summation<br />
A third problem with the normal model is that the sum of the observed values does not<br />
necessarily equal the sum of the predicted values. Since the estimates of the intercept and coefficients are<br />
obtained by minimizing the sum of the squared residual errors (or maximizing the joint probability<br />
distribution, which leads to the same result), there is no balancing mechanism to require that they add up<br />
to the same as the input values. In calibrating the model, adjustments can be made to the intercept term to<br />
force the sum of the predicted values to be equal to the sum of the input values. But in applying that<br />
intercept and coefficients to another data set, there is no guarantee that the consistency of summation will<br />
hold. In other words, the normal method cannot guarantee a consistent set of predicted values.<br />
Non-linear Effects<br />
A fourth problem with the normal model is that it assumes the independent variables are normal<br />
in their effect. If the dependent variable was normal or relatively balanced, then a normal model would be<br />
appropriate. But, when the dependent variable is highly skewed, as is seen with these data, typically the<br />
additive effects of each component cannot usually account for the non-linearity. Independent variables<br />
have to be transformed to account for the non-linearity and the result is often a complex equation with<br />
non-intuitive relationships. 2 It is far better to use a non-linear model for a highly skewed dependent<br />
variable.<br />
2<br />
For example, to account for the skewed dependent variable, one or more of the independent variables have to be<br />
transformed with a non-linear operator (e.g., log or exponential term). When more than one independent variable is<br />
non-linear in an equation, the model is no longer easily understood. It may end up making reasonable predictions for<br />
the dependent variable, but it is not intuitive nor easily explained to non-specialists.<br />
16
Greater Residual Errors<br />
The final problem with a normal model and a skewed dependent variable is that the model tends<br />
to over- or under-predict the correct values, but rarely comes up with the correct estimate. As we saw with<br />
the example above, typically a normal equation produces non-constant residual errors with skewed data.<br />
In theory, errors in prediction should be uncorrelated with the predicted value of the dependent variable.<br />
Violation of this condition is called heteroscedasticity because it indicates that the residual variance is not<br />
constant. The most common type is an increase in the residual errors with higher values of the predicted<br />
dependent variable. That is, the residual errors are greater at the higher values of the predicted dependent<br />
variable than at lower values (Draper and Smith, 1981, 147).<br />
A highly skewed distribution tends to encourage this. Because the least squares procedure<br />
minimizes the sum of the squared residuals, the regression line balances the lower residuals with the<br />
higher residuals. The result is a regression line that neither fits the low values nor the high values. For<br />
example, motor vehicle crashes tend to concentrate at a few locations (crash hot spots). In estimating the<br />
relationship between traffic volume and crashes, the hot spots tend to unduly influence the regression line.<br />
The result is a line that neither fits the number of expected crashes at most locations (which is low) nor<br />
the number of expected crashes at the hot spot locations (which are high).<br />
Corrections to Violated Assumptions in Normal Linear Regression<br />
Some of the violations in the assumptions of an OLS normal model can be corrected.<br />
Eliminating Unimportant Variables<br />
One good way to improve a normal model is to eliminate variables that are not important.<br />
Including variables in the equation that do not contribute very much adds ‘noise’ (variability) to the<br />
estimate. In the above example, the variable, JOBS, was not statistically significant and, hence, did not<br />
contribute any real effect to the final prediction. This is an example of overfitting a model. Whether we<br />
use the criteria of statistical significance to eliminate non-essential variables or simply drop those with a<br />
very small effect is less important than the need to reduce the model to only those variables that truly<br />
predict the dependent variable. We will discuss the ‘pros’ and ‘cons’ of dropping variables a little later in<br />
the chapter, but for now we argue that a good model - one that will be good not just for description but for<br />
prediction, is usually a simple model with only the strongest variables included.<br />
To illustrate, we reduce the burglary model further by dropping the non-significant variable<br />
(JOBS). Table Up. 2.3 show the results. Comparing the results with Table Up. 2.1, we can see that the<br />
overall fit of the model is actually slightly better (an F-value of 536.0 compared to 357.2). The R 2 values<br />
are the same while the mean squared predictive error is slightly worse while the mean absolute deviation<br />
is slightly better. The coefficients for the two common independent variables are almost identical while<br />
that for the intercept is slightly less (which is good since it contributes less to the overall result).<br />
17
Table Up. 2.3:<br />
Predicting Burglaries in the City of Houston: 2006<br />
Ordinary Least Squares: Reduced Model<br />
(N= 1,179 Traffic Analysis Zones)<br />
DepVar:<br />
2006 BURGLARIES<br />
N: 1,179<br />
Df: 1,175<br />
Type of regression model:<br />
Ordinary Least Squares<br />
F-test of model: 536.0 p≤.0001<br />
R-square: 0.48<br />
Adjusted r-square: 0.48<br />
Mean absolute deviation: 13.5<br />
1 st (highest) quartile: 26.5<br />
2 nd quartile: 10.6<br />
3 rd quartile: 8.3<br />
4 th (lowest) quartile: 8.8<br />
Mean squared predictive error: 505.1<br />
1 st (highest) quartile: 1498.8<br />
2 nd quartile: 269.5<br />
3 rd quartile: 135.1<br />
4 th (lowest) quartile: 120.2<br />
-----------------------------------------------------------------------------<br />
Predictor DF Coefficient Stand Error Tolerance t-value p<br />
INTERCEPT 1 12.8099 1.240 - 10.33 0.001<br />
HOUSEHOLDS 1 0.0255 0.0008 0.994 33.44 0.001<br />
MEDIAN<br />
HOUSEHOLD<br />
INCOME 1 -0.0002 0.00003 0.994 -7.03 0.001<br />
-----------------------------------------------------------------------------<br />
In other words, dropping the non-significant variable has led to a slightly better fit. One will<br />
usually find that dropping non-significant or unimportant variables makes models more stable without<br />
much loss of predictability, and conceptually they become simpler to understand.<br />
Eliminating Multicollinearity<br />
Another way to improve the stability of a normal model is to eliminate variables that are<br />
substantially correlated with other independent variables in the equation. This is the multicollinearity<br />
problem that we discussed above. Even if a variable is statistically significant in a model, if it is also<br />
correlated with one or more of the other variables in the equation, then it is capturing some of the variance<br />
associated with those other variables. The results are ambiguity in the interpretation of the coefficients as<br />
well as error in trying to use the model for prediction. Multicollinearity means that essentially there is<br />
overlap in the independent variables; they are measuring the same thing. It is better to drop a<br />
multicollinear variable even if it results in a loss in fit since it will usually result in a simpler and less<br />
variable model.<br />
18
For the Houston burglary example, the two remaining independent variables in Table Up. 2.3 are<br />
relatively independent; their tolerances are 0.994 respectively, which points to little overlap in the<br />
variance that they account for in the dependent variable. Therefore, we will keep these variables.<br />
However, later in the chapter in the discussion of the negative binomial model, we will present an<br />
example of how multicollinearity can lead to ambiguous coefficients.<br />
Transforming the Dependent Variable<br />
It may be possible to correct the normal model by transforming the dependent variable (in another<br />
program since <strong>CrimeStat</strong> does not currently do this). Typically, with a skewed dependent variable and one<br />
that has a large range in values, a natural log transformation of the dependent variable can be used to<br />
reduce the amount of skewness. That is, one takes:<br />
ln y log ( y )<br />
(Up. 2.21)<br />
i<br />
e<br />
i<br />
where e is the base of the natural logarithm (2.718…) and regresses the transformed dependent variable<br />
against the linear predictors,<br />
ln y x <br />
x <br />
(Up. 2.22)<br />
i<br />
0<br />
1 1i<br />
K<br />
Ki<br />
i<br />
This is equivalent to the equation<br />
y i<br />
e<br />
<br />
x <br />
x<br />
<br />
0 1 1i<br />
K Ki i<br />
(Up. 2.23)<br />
with, again, e being the base of the natural logarithm.<br />
In doing this, it is assumed that the log transformed dependent variable is consistent with the<br />
assumptions of the normal model, namely that it is normally distributed with an independent and constant<br />
error term, ε, that is also normally distributed.<br />
One must be careful about transforming values that are zero since the natural log of 0 is<br />
unsolvable. Usually researchers will set the value of the log-transformed dependent variable to 0 or the<br />
values of the dependent variable to a very small number (e.g., 0.001) for cases where the raw dependent<br />
variable actually has a value of 0. While this seems like a reasonable solution to the problem, it can lead<br />
to strange results. In the burglary data, for example, there were 250 zones (out of 1,179 or 21%) that had<br />
zero burglaries!<br />
Example of Transforming Dependent Variable<br />
To illustrate, we transformed the dependent variable in the above example – number of 2006<br />
burglaries per TAZ, by taking the natural logarithm of it. All zones with zero burglaries were<br />
automatically given the value of 0 for the transformed variable. The transformed variable was then<br />
19
egressed against the two independent variables in the reduced form model (from Table Up. 2.3 above).<br />
Table Up. 2.4 present the results:<br />
Table Up. 2.4:<br />
Predicting Burglaries in the City of Houston: 2006<br />
Log Transformed Dependent Variable<br />
(N= 1,179 Traffic Analysis Zones)<br />
DepVar:<br />
Natural log of 2006 BURGLARIES<br />
N: 1,179<br />
Df: 1,175<br />
Type of regression model:<br />
Ordinary Least Squares<br />
F-test of model: 417.4 p≤.0001<br />
R-square: 0.42<br />
Adjusted r-square: 0.42<br />
Mean absolute deviation: 30.7<br />
1 st (highest) quartile: 96.9<br />
2 nd quartile: 18.2<br />
3 rd quartile: <strong>3.3</strong><br />
4 th (lowest) quartile: 4.6<br />
Mean squared predictive error: 30,357.4<br />
1 st (highest) quartile: 118,774.1<br />
2 nd quartile: 2850.2<br />
3 rd quartile: 36.7<br />
4 th (lowest) quartile: 58.9<br />
-----------------------------------------------------------------------------<br />
Predictor DF Coefficient Stand Error Tolerance t-value p<br />
INTERCEPT 1 1.5674 0.067 - 23.44 0.001<br />
HOUSEHOLDS 1 0.0012 0.00004 0.994 28.84 0.001<br />
MEDIAN<br />
HOUSEHOLD<br />
INCOME 1 -0.000002 0.000001 0.994 -4.09 0.001<br />
-----------------------------------------------------------------------------<br />
The coefficients are similar in sign. The R 2 value is smaller than the untransformed model (0.42<br />
compared to 0.48). However, the mean squared predictive error is now much higher than the original raw<br />
values (30,357.42 compared to 505.14) and the mean absolute deviation is also much higher (30.73<br />
compared to 13.50). 3<br />
3<br />
The errors were calculated by, first, transforming the dependent variable by taking its natural log; second, the natural<br />
log was then regressed against the independent variables; third, the predicted values were then calculated; and, fourth,<br />
the predicted values were then converted back into raw scores by taking them as the exponents of e, the base of the<br />
natural logarithm. The residual errors were calculated from the re-transformed predicted values.<br />
20
In other words, transforming the dependent to a natural log has not improved the overall normal<br />
model and, in fact, worsened the predictability. The high degree of skewness in the dependent variable<br />
was not eliminated by transforming it.<br />
Another type of transformation that is sometimes used is to convert the independent variables<br />
and, occasionally, the dependent variable into Z-scores. The Z-score of a variable is defined as:<br />
z<br />
k<br />
xk<br />
x<br />
(Up. 2.24)<br />
std( x k<br />
k)<br />
But all this will do is to standardize the scale of the variable as standard deviations around an<br />
expected value of zero, but not alter the shape. If the dependent variable is skewed, taking the Z-score of<br />
it will not alter its skewness. Essentially, skewness is a fundamental property of a distribution and the<br />
normal model is poorly suited for modeling it.<br />
Count Data Models<br />
In short, a normal linear model is inadequate for describing skewed distributions, particularly<br />
counts. Given that crime analysis usually involves the analysis of counts, this is a serious deficiency.<br />
Poisson Regression<br />
Consequently, we turn to count data models, in particular the Poisson family of models. This<br />
family is part of the generalized linear models (GLMs), in which the OLS normal model described above<br />
is a special case (McCullagh & Nelder, 1989). Poisson regression is a modeling method that overcomes<br />
some of the problems of traditional normal regression in which the errors are assumed to be normally<br />
distributed (Cameron & Trivedi, 1998). In the model, the number of events is modeled as a Poisson<br />
random variable with a probability of occurrence being:<br />
yi<br />
e <br />
Prob( yi<br />
) (Up. 2.25)<br />
y !<br />
i<br />
where y i<br />
is the count for one group or class, i, is the mean count over all groups, and e is the base of<br />
the natural logarithm. The distribution has a single parameter, , which is both the mean and the<br />
variance of the function.<br />
The “law of rare events” assumes that the total number of events will approximate a Poisson<br />
distribution if an event occurs in any of a large number of trials but the probability of occurrence in any<br />
given trial is small and assumed to be constant (Cameron & Trivedi, 1998). Thus, the Poisson<br />
distribution is very appropriate for the analysis of rare events such as crime incidents (or motor vehicle<br />
crashes or uncommon diseases or any other rare event). The Poisson model is not particularly good if the<br />
probability of an event is more balanced; for that, the normal distribution is a better model as the<br />
21
sampling distribution will approximate normality with increasing sample size. Figure Up.2.5 illustrates<br />
the Poisson distribution for different expected means (repeated from chapter 13).<br />
The mean can, in turn, be modeled as a function of some other variables (the independent<br />
T<br />
variables). Given a set of observations on one or more independent variables, x 1, x , ,<br />
x ) , the<br />
conditional mean of<br />
y<br />
i<br />
can be specified as an exponential function of the x’s:<br />
i<br />
(<br />
1i<br />
Ki<br />
T<br />
x i β<br />
E( y | x ) e<br />
(Up. 2.26)<br />
i<br />
i<br />
i<br />
where i is an observation,<br />
T<br />
( 0,<br />
1,<br />
,<br />
<br />
K<br />
)<br />
T<br />
x<br />
i<br />
is a set of independent variables including an intercept,<br />
β <br />
are a set of coefficients, and e is the base of the natural logarithm. Equation Up.<br />
2.26 is sometimes written as<br />
K<br />
<br />
T<br />
ln( ) x β x<br />
(Up. 2.27)<br />
i<br />
i<br />
0<br />
k1<br />
k<br />
ki<br />
where each independent variable, k , is multiplied by a coefficient, <br />
k<br />
, and is added to a constant, <br />
0<br />
. In<br />
expressing the equation in this form, we have transformed it using a link function, the link being the loglinear<br />
relationship. As discussed above, the Poisson model is part of the GLM framework in which the<br />
functional relationship is expressed as a linear combination of predictive variables. This type of model is<br />
sometimes known as a loglinear model, especially if the independent variables are categories, rather than<br />
continuous (real) variables. However, we will refer to it as a Poisson model. In more familiar notation,<br />
this is<br />
ln( ) x x x<br />
(Up. 2.28)<br />
i<br />
0<br />
1 1i<br />
2<br />
2i<br />
K<br />
Ki<br />
That is, the natural log of the mean is a function of K independent variables and an intercept.<br />
The data are assumed to reflect the Poisson model. Also, in the Poisson model, the variance<br />
equals the mean. Therefore, it is expected that the residual errors should increase with the conditional<br />
mean. That is, there is inherent heteroscedasticity in a Poisson model (Cameron & Trivedi, 1998). This<br />
is very different than a normal model where the residual errors are expected to be constant.<br />
The model is estimated using a maximum likelihood procedure, typically the Newton-Raphson<br />
method or, occasionally, using Fisher scores (Wikipedia, 2010a; Cameron & Trivedi, 1998). In Appendix<br />
C, Anselin presents a more formal treatment of both the normal and Poisson regression models including<br />
the methods by which they are estimated.<br />
22
Figure Up. 2.5:
Advantages of the Poisson Regression Model<br />
The Poisson model overcomes some of the problems of the normal model. First, the Poisson<br />
model has a minimum value of 0. It will not predict negative values. This makes it ideal for a<br />
distribution in which the mean or the most typical value is close to 0. Second, the Poisson is a<br />
fundamentally skewed model; that is, it is data characterized with a long ‘right tail’. Again, this model is<br />
appropriate for counts of rare events, such as crime incidents.<br />
Third, because the Poisson model is estimated by a maximum likelihood method, the estimates<br />
are adapted to the actual data. In practice, this means that the sum of the predicted values is virtually<br />
identical to the sum of the input values, with the exception of a very slight rounding off error.<br />
Fourth, compared to the normal model, the Poisson model generally gives a better estimate of the<br />
counts for each record. The problem of over- or underestimating the number of incidents for most zones<br />
with the normal model is usually lessened with the Poisson. When the residual errors are calculated,<br />
generally the Poisson has a lower total error than the normal model.<br />
In short, the Poisson model has some desirable statistical properties that make it very useful for<br />
predicting crime incidents.<br />
Example of Poisson Regression<br />
Using the same Houston burglary database, we estimate a Poisson model of the two independent<br />
predictors of burglaries (Table Up. 2.5).<br />
Likelihood Statistics<br />
The summary statistics are quite different from the normal model. In the <strong>CrimeStat</strong><br />
implementation, there are five separate statistics about the likelihood, representing a joint probability<br />
function that is maximized. First, there is the log likelihood (L). The likelihood function is the joint<br />
(product) density of all the observations given values for the coefficients and the error variance. The log<br />
likelihood is the log of this product or the sum of the individual densities. Because the function it<br />
maximizes is a probability and is always less than 1.0, the log likelihood is always negative with a<br />
Poisson model.<br />
Second, the Aikaike Information Criterion (AIC) adjusts the log likelihood for degrees of<br />
freedom since adding more variables will always increase the log likelihood. It is defined as:<br />
AIC = -2L + 2(K+1) (Up. 2.29)<br />
where L is the log likelihood and K is the number of independent variables. Third, another measure<br />
which is very similar is the Bayes Information Criterion (or Schwartz Criterion), which is defined as:<br />
BIC/SC = -2L+[(K+1)ln(N)] (Up. 2.30)<br />
24
These two measures penalize the number of parameters added in the model, and reverse the sign<br />
of the log likelihood (L) so that the statistics are more intuitive. The model with the lowest AIC or<br />
BIC/SC values are ‘best’.<br />
Fourth, a decision about whether the Poisson model is appropriate can be based on the statistic<br />
called the deviance which is defined as:<br />
N <br />
<br />
<br />
<br />
<br />
yi<br />
Dev 2(<br />
L<br />
<br />
F<br />
LM<br />
) 2 yi<br />
ln<br />
yi<br />
ˆ i<br />
i 1 <br />
ˆ<br />
i<br />
<br />
(Up. 2.31)<br />
where L<br />
F<br />
is the log likelihood that would be achieved if the model gave a perfect fit and LM<br />
is the loglikelihood<br />
of the model under consideration. If the latter model is correct, the deviance (Dev) is<br />
2<br />
approximately distributed with degrees of freedom equal to N ( K 1)<br />
. A value of the deviance<br />
greatly in excess of N ( K 1)<br />
suggests that the model is overdispersed due to missing variables or<br />
non-Poisson form.<br />
Fifth, there is the Pearson chi-square statistic which is defined by<br />
N<br />
2<br />
2 ( y ˆ<br />
i<br />
Pearson <br />
i<br />
)<br />
(Up. 2.32)<br />
ˆ <br />
i1<br />
i<br />
and is approximately chi-square distributed with mean N ( K 1)<br />
for a valid Poisson model. Therefore,<br />
2<br />
if the Pearson chi-square statistic divided by degrees of freedom, Pearson /( N K 1)<br />
is<br />
significantly larger than 1, overdispersion is also indicated.<br />
Model Error Estimates<br />
Next, there are two statistics that measure how well the model fits the data, or goodness-of-fit. In<br />
<strong>CrimeStat</strong>, there are two statistics that measure goodness-of-fit, the Mean Absolute Deviation (MAD) and<br />
Mean Squared Predicted Error (MSPE) which were defined above (p. Up. 2.11). Comparing these with<br />
the normal model, it can be seen that the overall MAD and MSPE are slightly worse than for the normal<br />
model, though much better than with the log transformed linear model (Table Up.2.4). Comparing the<br />
four quartiles, it can be seen that three of the four quartiles for the normal model have slightly better<br />
MAD and MSPE scores than for the Poisson but the differences are not great.<br />
25
Table Up. 2.5:<br />
Predicting Burglaries in the City of Houston: 2006<br />
Poisson Model<br />
(N= 1,179 Traffic Analysis Zones)<br />
DepVar:<br />
2006 BURGLARIES<br />
N: 1,179<br />
Df: 1,175<br />
Type of regression model:<br />
Poisson<br />
Method of estimation:<br />
Maximum likelihood<br />
Likelihood statistics<br />
Log Likelihood: -13,639.5<br />
AIC: 27,287.1<br />
BIC/SC: 27,307.4<br />
Deviance: 23,021.4<br />
p-value of deviance: 0.0001<br />
Model error estimates<br />
Mean absolute deviation: 16.0<br />
1 st (highest) quartile: 33.9<br />
2 nd quartile: 7.3<br />
3 rd quartile: 8.8<br />
4 th (lowest) quartile: 13.9<br />
Mean squared predicted error: 714.2<br />
1 st (highest) quartile: 2,351.8<br />
2 nd quartile: 203.7<br />
3 rd quartile: 99.8<br />
4 th (lowest) quartile: 206.7<br />
Over-dispersion tests<br />
Adjusted deviance: 19.6<br />
Adjusted Pearson Chi-Square: 21.1<br />
Dispersion multiplier: 21.1<br />
Inverse dispersion multiplier: 0.05<br />
-----------------------------------------------------------------------------<br />
Predictor DF Coefficient Stand Error Tolerance Z-value p<br />
INTERCEPT 1 2.8745 0.014 - 212.47 0.001<br />
HOUSEHOLDS 1 0.0006 0.000004 0.994 146.24 0.001<br />
MEDIAN<br />
HOUSEHOLD<br />
INCOME 1 -0.000009 0.00000 0.994 -28.68 0.001<br />
-----------------------------------------------------------------------------<br />
26
Over-dispersion Tests<br />
The remaining four summary statistics measure dispersion. A more extensive discussion of<br />
dispersion is given a little later in the chapter. But, very simply, in the Poisson framework, the variance<br />
equals the mean. These statistics indicate the extent to which the variance exceeds the mean.<br />
First, the adjusted deviance is defined as the deviance divided by the degrees of freedom (N-K-1);<br />
a value closer to 1 indicates a satisfactory goodness-of-fit. Usually, values greater than 1 indicate signs of<br />
over-dispersion. Second, the adjusted Pearson Chi-square is defined as the Pearson Chi-square divided<br />
by the degress of freedom; a value closer to 1 indicates a satisfactory goodness-of-fit. Third, the<br />
dispersion multiplier, γ, measures the extent to which the conditional variance exceeds the conditional<br />
mean (conditional on the independent variables and the intercept term) and is defined by<br />
2<br />
Var( y i<br />
) i<br />
i<br />
. Fourth, the inverse dispersion multiplier ( ) is simply the reciprocal of the<br />
dispersion multiplier ( 1/ ) ; some users are more familiar with it in this form.<br />
As can be seen in Table Up. 2.5, the four dispersion statistics are much greater than 1 and indicate<br />
over-dispersion. In other words, the conditional variance is greater – in this case, much greater, than the<br />
conditional mean. The ‘pure’ Poisson model (in which the variance is supposed to equal the mean) is not<br />
an appropriate model for these data.<br />
Individual Coefficient Statistics<br />
Finally, the signs of the coefficients are the same as for the normal and transformed normal<br />
models, as would be expected. The relative strengths of the variables, as seen through the Z-values, are<br />
also approximately the same (a ratio of 5.1:1 compared to 4.8:1 for the normal model).<br />
In short, the Poisson model has produced results that are an alternative to the normal model.<br />
While the likelihood statistics indicate that, in this instance, the normal model is slightly better, the<br />
Poisson model has the advantage of being theoretically more sound. In particular, it is not possible to get<br />
a minimum predicted value less than zero (which is possible with the normal model) and the sum of the<br />
predicted values will always equal the sum of the input values (which is rarely true with the normal<br />
model). With a more skewed dependent variable, the Poisson model will usually fit the data better than<br />
the normal as well.<br />
Problems with the Poisson Regression Model<br />
On the other hand, the Poisson model is not perfect. The primary problem is that count data are<br />
usually over-dispersed.<br />
Over-dispersion in the Residual Errors<br />
In the Poisson distribution, the mean equals the variance. In a Poisson regression model, the<br />
mathematical function, therefore, equates the conditional mean (the mean controlling for all the predictor<br />
variables) with the conditional variance. However, most actual distributions have a high degree of<br />
27
skewness, much more than are assumed by the Poisson distribution (Cameron & Trivedi, 1998; Mitra &<br />
Washington, 2007).<br />
As an example, figure Up. 2.6 show the distribution of Baltimore County and Baltimore City<br />
crime origins and Baltimore County crime destinations by TAZ. For the origin distribution, the ratio of<br />
the variance to the mean is 14.7; that is, the variance is 14.7 times that of the mean! For the destination<br />
distribution, the ratio is 401.5!<br />
In other words, the simple variance is many times greater than the mean. We have not yet<br />
estimated some predictor variables for these variables, but it is probable that even when this is done the<br />
conditional variance will far exceed the conditional mean. Most real-world count data are similar to this;<br />
the variance will usually be much greater than the mean (Lord et al., 2005). What this means in practice<br />
is that the residual errors - the difference between the observed and predicted values for each zone, will be<br />
greater than what is expected. The Poisson model calculates a standard error as if the variance equals the<br />
mean. Thus, the standard error will be underestimated using a Poisson model and, therefore, the<br />
significance tests (the coefficient divided by the standard error) will be greater than they really should be.<br />
In a Poisson multiple regression model, we might end up selecting variables that really should not be<br />
selected because we think they are statistically significant when, in fact, they are not (Park & Lord, 2007).<br />
Poisson Regression with Linear Dispersion Correction<br />
There are a number of methods for correcting the over-dispersion in a count model. Most of them<br />
involve modifying the assumption of the conditional variance equal to the conditional mean. The first is a<br />
simple linear correction known as the linear negative binomial (or NB1; Cameron & Trivedi, 1998, 63-<br />
65). The variance of the function is assumed to be a linear multiplier of the mean. The conditional<br />
variance is defined as:<br />
V | x ]<br />
(Up. 2.33)<br />
i<br />
[ y i i<br />
where V[ y i<br />
| x<br />
i<br />
] is the variance of y<br />
i<br />
given the independent variables.<br />
The conditional variance is then a function of the mean:<br />
<br />
(Up. 2.34)<br />
i<br />
i<br />
p<br />
i<br />
where is the dispersion parameter and p is a constant (usually 1 or 2). In the case where p is 1, the<br />
equation simplifies to:<br />
<br />
(Up. 2.35)<br />
i<br />
i<br />
i<br />
This is the NB1 correction. In the special case where<br />
0 , the variance becomes equal to the<br />
mean (the Poisson model).<br />
28
Figure Up. 2.6:<br />
Distribution of Crime Origins and Destinations: Baltimore County, MD:<br />
1993-1997<br />
250<br />
Number of TAZs<br />
200<br />
150<br />
100<br />
50<br />
0<br />
50 500 1000 1500+<br />
Number of Events Per Taz<br />
Origins<br />
Destinations
The model is estimated in two steps. First, the Poisson model is fitted to the data and the degree<br />
of over- (or under) dispersion is estimated. The dispersion parameter is defined as:<br />
N<br />
2<br />
1 ( y ˆ<br />
i<br />
<br />
i<br />
)<br />
ˆ 1/ ˆ<br />
(Up. 2.36)<br />
1<br />
ˆ <br />
N K i1<br />
i<br />
where N is the sample size, K is the number of independent variables, y<br />
i<br />
is the observed number of<br />
events that occur in zone i, and ˆ i<br />
is the predicted number of events for zone i. The test is similar to an<br />
2<br />
average chi-square in that it takes the square of the residuals ( y ˆ<br />
i<br />
i<br />
) and divides it by the predicted<br />
values, and then averages it by the degrees of freedom. The dispersion parameter is a standardized<br />
number. A value greater than 1.0 indicates over-dispersion while a value less than 1 indicates underdispersion<br />
(which is rare, though possible). A value of 1.0 indicates equidispersion (or the variance<br />
equals the mean). The dispersion parameter can also be estimated based on the deviance.<br />
In the second step, the Poisson standard error is multiplied by the square root of the dispersion<br />
parameter to produce an adjusted standard error:<br />
SE adj<br />
SE ˆ<br />
(Up. 2.37)<br />
The new standard error is then used in the t-test to produce an adjusted t-value. This adjustment is found<br />
in most Poisson regression packages using a Generalized Linear Model (GLM) approaches (McCullagh<br />
and Nelder, 1989, 200). Cameron & Trivedi (1998) have shown that this adjustment produces results that<br />
are virtually identical to that of the negative binomial, but involving fewer assumptions. <strong>CrimeStat</strong><br />
includes an NB1 correction and is called Poisson with linear correction.<br />
Example of Poisson Model with Linear Dispersion Correction (NB1)<br />
Table Up. 2.6 show the results of running the Poisson model with the linear dispersion correction.<br />
The likelihood statistics are the same as for the simple Poisson model (Table Up. 2.5) and the coefficients<br />
are identical. The dispersion parameter, however, has now been adjusted to be 1.0. This affects the<br />
standard errors, which are now greater. In the example, the two independent variables are still<br />
statistically significant, but the Z-values are smaller.<br />
30
Table Up. 2.6:<br />
Predicting Burglaries in the City of Houston: 2006<br />
Poisson with Linear Dispersion Correction Model (NB1)<br />
(N= 1,179 Traffic Analysis Zones)<br />
DepVar:<br />
2006 BURGLARIES<br />
N: 1,179<br />
Df: 1,175<br />
Type of regression model:<br />
Poisson with linear dispersion correction<br />
Method of estimation:<br />
Maximum likelihood<br />
Likelihood statistics<br />
Log Likelihood: -13,639.5<br />
AIC: 27,287.1<br />
BIC/SC : 27,307.4<br />
Deviance: 12,382.5<br />
p-value of deviance: 0.0001<br />
Pearson Chi-square: 12,402.2<br />
Model error estimates<br />
Mean absolute deviation: 16.0<br />
1 st (highest) quartile: 33.9<br />
2 nd quartile: 7.3<br />
3 rd quartile: 8.8<br />
4 th (lowest) quartile: 13.9<br />
Mean squared predicted error: 714.2<br />
1 st (highest) quartile: 2351.8<br />
2 nd quartile: 203.7<br />
3 rd quartile: 99.8<br />
4 th (lowest) quartile: 206.7<br />
Over-dispersion tests<br />
Adjusted deviance: 10.5<br />
Adjusted Pearson Chi-Square: 10.6<br />
Dispersion multiplier: 1.0<br />
Inverse dispersion multiplier: 1.0<br />
-----------------------------------------------------------------------------<br />
Predictor DF Coefficient Stand Error Tolerance Z-value p<br />
INTERCEPT 1 2.87452 0.062 - 46.26 0.001<br />
HOUSEHOLDS 1 0.00059 0.00002 0.994 31.84 0.001<br />
MEDIAN<br />
HOUSEHOLD<br />
INCOME 1 -0.000009 0.000001 0.994 -6.24 0.001<br />
-----------------------------------------------------------------------------<br />
31
Poisson-Gamma (Negative Binomial) Regression<br />
A second type of dispersion correction involves a mixed function model. Instead of simply<br />
adjusting the standard error by a dispersion correction, different assumptions are made for the mean and<br />
the variance (dispersion) of the dependent variable. In the negative binomial model, the number of<br />
observations ( y i<br />
) is assumed to follow a Poisson distribution with a mean ( i<br />
) but the dispersion is<br />
assumed to follow a Gamma distribution (Lord, 2006; Cameron & Trivedi, 1998, 62-63; Venables and<br />
Ripley, 1997, 242-245).<br />
Mathematically, the negative binomial distribution is one derivation of the binomial distribution<br />
in which the sign of the function is negative, hence the term negative binomial (for more information on<br />
the derivation, see Wikipedia, 2010 a). For our purposes, it is defined as a mixed distribution with a<br />
Poisson mean and a one parameter Gamma dispersion function having the form<br />
where<br />
f ( y<br />
i<br />
i<br />
e<br />
i<br />
e<br />
i<br />
/ <br />
i<br />
) (Up. 2.38)<br />
y !<br />
(<br />
<br />
) <br />
i <br />
i<br />
y<br />
0 i x i i<br />
(Up. 2.39)<br />
<br />
i<br />
i<br />
xi<br />
i<br />
e<br />
0 (<br />
)<br />
e<br />
(Up. 2.40)<br />
<br />
(Up. 2.41)<br />
i<br />
i<br />
i<br />
and where θ i is a function of a one-parameter gamma distribution where the parameter, τ, is greater than 0<br />
(ignoring the subscripts)<br />
<br />
1<br />
1<br />
1<br />
(<br />
y)<br />
( ) <br />
h( y / ,<br />
) <br />
<br />
y<br />
<br />
<br />
(Up. 2.42)<br />
1<br />
1<br />
1<br />
(<br />
) (<br />
1)<br />
<br />
<br />
<br />
y<br />
The model has been applied traditionally to integer (count) data though it can also be applied to<br />
continuous (real) data. Sometimes the integer model is called a Pascal model while the real model is<br />
called a Polya model (Wikipedia, 2010a; Springer, 2010). Boswell and Patil (1970) argued that there are<br />
at least 12 distinct probabilistic processes that can give rise to the negative binomial function including<br />
heterogeneity in the Poisson intensity parameter, cluster sampling from a population which is itself<br />
clustered, and the probabilities that change as a function of the process history (i.e., the occurrence of an<br />
event breeds more events). The interpretation we adopt here is that of a heterogeneous population such<br />
that different observations come from different sub-populations and the Gamma distribution is the mixing<br />
variable.<br />
Because both the Poisson and Gamma functions belong to the single-parameter exponential<br />
family of functions, they call be solved by the maximum likelihood method. The mean is always<br />
32
estimated as a Poisson function. However, there are slightly different parameterizations of the variance<br />
function (Hilbe, 2008). In the original derivation by Greenwood and Yule (1920), the conditional<br />
variance was defined as:<br />
ω i = μ i + μ i 2 / ψ (Up. 2.43)<br />
whereupon ψ (Psi) became known as the inverse dispersion parameter (McCullagh and Nelder, 1989).<br />
However, in more recent years, the conditional variance was defined within the Generalized<br />
Linear Models tradition as a direct adjustment of the squared Poisson mean, namely:<br />
ω i = μ i + τ μ i<br />
2<br />
(Up. 2.44)<br />
where the variance is now a quadratic function of the Poisson mean (i.e., p is 2 in formula Up. 2.34) and τ<br />
is called the dispersion multiplier. This is the formulation proposed by Cameron & Trivedi (1998; 62-<br />
63). That is, it is assumed that there is an unobserved variable that affects the distribution of the count so<br />
that some observations come from a population with higher expected counts whereas others come from a<br />
population with lower expected counts. The model is then of a Poisson mean but with a ‘longer tail’<br />
variance function. The dispersion parameter, τ, is now directly related to the amount of dispersion. This is<br />
the interpretation that we will use in the chapter and in <strong>CrimeStat</strong>.<br />
Formally, we can write the negative binomial model as a Poisson-gamma mixture form:<br />
y<br />
i<br />
|<br />
i<br />
i<br />
~ Poisson ( )<br />
(Up. 2.45)<br />
The Poisson mean<br />
<br />
i<br />
is organized as:<br />
T<br />
exp( x β )<br />
(Up. 2.46)<br />
i<br />
i<br />
i<br />
where exp() is an exponential function, β is a vector of unknown coefficients for the k covariates plus an<br />
intercept, and <br />
i<br />
is the model error independent of all covariates. The exp( i<br />
) is assumed to follow the<br />
gamma distribution with a mean equal to 1 and a variance equal to 1/<br />
where is a parameter that<br />
is greater than 0 (Lord, 2006; Cameron & Trivedi, 1998).<br />
way:<br />
For a negative binomial generalized linear model, the deviance can be computed the following<br />
D <br />
<br />
ˆ<br />
<br />
<br />
<br />
<br />
<br />
N<br />
<br />
i<br />
<br />
i<br />
yi<br />
ln<br />
( yi<br />
ˆ )ln<br />
i1 <br />
ˆ <br />
ˆ<br />
i<br />
i<br />
ˆ<br />
<br />
y<br />
<br />
<br />
<br />
y<br />
<br />
(Up. 2.47)<br />
33
2<br />
For a well-fitted model the deviance should be approximately distributed with N K 1<br />
degrees of<br />
freedom (McCullagh and Nelder, 1987). If D /( N K 1)<br />
is close to 1, we generally conclude that the<br />
model’s fit is satisfactory.<br />
Example 1 of Negative Binomial Regression<br />
To illustrate, Table Up. 2.7 present the results of the negative binomial model for Houston<br />
burglaries. Even though the individual coefficients are similar, the likelihood statistics indicate that the<br />
model fit the data better than the Poisson with linear correction for over-dispersion. The log likelihood is<br />
higher, the AIC and BIC/SC statistics are lower as are the deviance and the Pearson Chi-square statistics.<br />
On the other hand, the model error is slightly higher than for the Poisson, both for the mean<br />
absolute deviation (MAD) and the mean squared predicted error (MSPE). Accuracy and precision need to<br />
be seen as two different dimensions for any method, including a regression model (Jessen, 1979, 13-16).<br />
Accuracy is ‘hitting the target’, in this case maximizing the likelihood function. Precision is the<br />
consistency in the estimates, again in this case the ability to replicate individual data values. A normal<br />
model will often produce lower overall error because it minimizes the sum of squared residual errors<br />
though it rarely will replicate the values of the records with high values and often does poorly at the low<br />
end.<br />
For this reason, we say that the negative binomial is a more accurate model though not<br />
necessarily a more precise one. To improve the precision of the negative binomial, we would have to<br />
introduce additional variables to reduce the conditional variance further. Clearly, residential burglaries<br />
are associated with more variables than just the number of households and the median household income<br />
(e.g., ease of access into buildings, lack of surveillance on the street, having easy contact with individuals<br />
willing to distribute stolen goods).<br />
Nevertheless, the negative binomial is a better model than the Poisson and certainly the normal,<br />
Ordinary Least Squares. It is theoretically more sound and does better with highly skewed (overdispersed)<br />
data.<br />
Example 2 of Negative Binomial Regression with Highly Skewed Data<br />
To illustrate further, the negative binomial is very useful when the dependent variable is<br />
extremely skewed. Figure Up. 2.7 show the number of crimes committed (and charged for) by individual<br />
offenders in Manchester, England in 2006. The X-axis plots the number of crimes committed while the<br />
Y-axis plots the number of offenders. Of the 56,367 offenders, 40,755 committed one offence during that<br />
year, 7,500 committed two offences, and 3,283 committed three offences. At the high end, 26 individuals<br />
committed 30 or more offences in 2006 with one individual committing 79 offences. The distribution is<br />
very skewed.<br />
34
Table Up. 2.7:<br />
Predicting Burglaries in the City of Houston: 2006<br />
MLE Negative Binomial Model<br />
(N= 1,179 Traffic Analysis Zones)<br />
DepVar:<br />
2006 BURGLARIES<br />
N: 1,179<br />
Df: 1,175<br />
Type of regression model:<br />
Poisson with Gamma dispersion<br />
Method of estimation:<br />
Maximum likelihood<br />
Likelihood statistics<br />
Log Likelihood: -4,430.8<br />
AIC: 8,869.6<br />
BIC/SC : 8,889.9<br />
Deviance: 1,390.1<br />
p-value of deviance: 0.0001<br />
Pearson Chi-square: 1,112.7<br />
Model error estimates<br />
Mean absolute deviation: 39.6<br />
1 st (highest) quartile: 124.1<br />
2 nd quartile: 19.4<br />
3 rd quartile: 6.2<br />
4 th (lowest) quartile: 8.9<br />
Mean squared predicted error: 62,031.2<br />
1 st (highest) quartile: 242,037.1<br />
2 nd quartile: 6,445.8<br />
3 rd quartile: 118.3<br />
4 th (lowest) quartile: 154.9<br />
Over-dispersion tests<br />
Adjusted deviance: 1.2<br />
Adjusted Pearson Chi-Square: 0.9<br />
Dispersion multiplier: 1.5<br />
Inverse dispersion multiplier: 0.7<br />
-----------------------------------------------------------------------------<br />
Predictor DF Coefficient Stand Error Tolerance Z-value p<br />
INTERCEPT 1 2.3210 0.083 - 27.94 0.001<br />
HOUSEHOLDS 1 0.0012 0.00007 0.994 17.66 0.001<br />
MEDIAN HOUSEHOLD<br />
INCOME 1 -0.00001 0.000002 0.994 -5.13 0.001<br />
-----------------------------------------------------------------------------<br />
35
Figure Up. 2.7:
A negative binomial regression model was set up to model the number of offences committed by<br />
these individuals as a function of conviction for previous offence (prior to 2006), age, and distance that<br />
the individual lived from the city center. Table Up. 2.8 show the results.<br />
The model was discussed in a recent article (Levine & Lee, 2010). The closer an offender lives to<br />
the city center, the greater than number of crimes committed. Also, younger offenders committed more<br />
offences than older offenders. However, the strongest variable is whether the individual had an earlier<br />
conviction for another crime. Offenders who have committed previous offences are more likely to<br />
commit more of them again. Crime is a very repetitive behavior!<br />
The likelihood statistics indicates that the model was fit quite closely. The likelihood statistics<br />
were better than that of a normal OLS and a Poisson NB1 models (not shown). The model error was also<br />
slightly better for the negative binomial. For example, the MAD for this model was 0.93 compared to<br />
0.95 for the normal and 0.93 for the Poisson NB1. The MSPE for this model was 3.90 compared to 3.93<br />
for the normal and also 3.90 for the Poisson NB1. The negative binomial and Poisson models produce<br />
very similar results because, in both cases, the means are modeled as Poisson variables. The differences<br />
are in the dispersion statistics. For example, the standard error of the four parameters (intercept plus<br />
three independent variables was 0.012, 0.003, 0.008, and 0.0003 respectively for the negative binomial<br />
compared to 0.015, 0.004, 0.010, and 0.0004 for the Poisson NB1 model. In general, the negative<br />
binomial will fit the data better when the dependent variable is highly skewed and will usually produce<br />
lower model error.<br />
Advantages of the Negative Binomial Model<br />
The main advantage of the negative binomial model over the Poisson and Poisson with linear<br />
dispersion correction (NB 1) is that it incorporates the theory of Poisson but allows more flexibility in that<br />
multiple underlying distributions may be operating. Further, mathematically it separates out the<br />
assumptions of the mean (Poisson) from that of the dispersion (Gamma) whereas the Poisson with linear<br />
dispersion correction only adjust the dispersion after the fact (i.e., it determines that there is<br />
overdispersion and then adjusts it). This is neater from a mathematical perspective. Separating the mean<br />
from the dispersion can also allow alternative dispersion estimates to be modeled, such as the lognormal<br />
(Lord, 2006). This is very useful for modeling highly skewed data.<br />
Disadvantages of the Negative Binomial Model<br />
The biggest disadvantage is that the constancy of sums is not maintained. Whereas the Poisson<br />
model (both “pure” and with the linear dispersion correction) maintains the constancy of the sums (i.e.,<br />
the sum of the predicted values equals the sum of the input values), the negative binomial does not<br />
maintain this. Usually, the degree of error in the sum of the predicted values is not far from the sum of<br />
the input values. But, occasionally substantial distortions are seen.<br />
37
Table Up. 2.8:<br />
Number of Crimes Committed in Manchester in 2006<br />
Negative Binomial Model<br />
(N= 56,367 Offenders)<br />
DepVar: NUMBER OF CRIMES COMMITTED IN 2006<br />
N: 56,367<br />
Df: 56,362<br />
Type of regression model:<br />
Poisson with Gamma dispersion<br />
Method of estimation:<br />
Maximum likelihood<br />
Likelihood statistics<br />
Log Likelihood: -89,103.7<br />
AIC: 178,217.4<br />
BIC/SC : 178,262.1<br />
Deviance: 36,616.6<br />
p-value of deviance: 0.0001<br />
Pearson Chi-square: 80,950.2<br />
Model error estimates<br />
Mean absolute deviation: 0.9<br />
1 st (highest) quartile: 1.9<br />
2 nd quartile: 0.7<br />
3 rd quartile: 0.6<br />
4 th (lowest) quartile: 0.6<br />
Mean squared predicted error: 3.9<br />
1 st (highest) quartile: 13.8<br />
2 nd quartile: 0.7<br />
3 rd quartile: 0.6<br />
4 th (lowest) quartile: 0.6<br />
Over-dispersion tests<br />
Adjusted deviance: 0.6<br />
Adjusted Pearson Chi-Square: 1.4<br />
Dispersion multiplier: 0.2<br />
Inverse dispersion multiplier: 6.2<br />
-----------------------------------------------------------------------------<br />
Predictor DF Coefficient Stand Error Tolerance Z-value p<br />
INTERCEPT 1 0.509 0.012 - 41.90 0.001<br />
DISTANCE<br />
FROM CITY<br />
CENTER 1 -0.022 0.003 0.999 -6.74 0.001<br />
PRIOR<br />
OFFENCE 1 0.629 0.008 0.982 80.24 0.001<br />
AGE OF<br />
OFFENDER 1 -0.012 0.0003 0.981 -35.09 0.001<br />
-----------------------------------------------------------------------------<br />
38
Alternative Regression Models<br />
Another disadvantage is related to the small sample size and low sample mean bias. It has been<br />
shown that the dispersion parameter of NB models can be significantly biased or misestimated when not<br />
enough data are available for estimating the model (Lord, 2006).<br />
There are a number of alternative MLE methods for estimating the likely value of a count given a<br />
set of independent predictors. There are a number of variations of these involving different assumptions<br />
about the dispersion term, such as a lognormal function. There are also a number of different Poissontype<br />
models including the zero-inflated Poisson (or ZIP; Hall, 2000), the Generalized Extreme Value<br />
family (Weibul, Gumbel and Fréchet), and the lognormal function (see NIST 2004 for a list of common<br />
non-linear functions).<br />
Limitations of the Maximum Likelihood Approach<br />
The functions considered up to this point are part of the single-parameter exponential family of<br />
functions. Because of this, maximum likelihood estimation (MLE) can be used. However, there are more<br />
complex functions that are not part of this family. Also, some functions come from multiple families and<br />
are, therefore, too complex to solve for a single maximum. They may have multiple ‘peaks’ for which<br />
there is not a single optimal solution. For these functions, a different approach has to be used.<br />
Also, one of the criticisms leveled against maximum likelihood estimation (MLE) is that the<br />
approach overfits data. That is, it finds the values of the parameters that maximize the joint probability<br />
function. This is similar to the old approach of fitting a curve to data points with higher-order<br />
polynomials. While one can find some combination of higher-order terms to fit the data almost perfectly,<br />
such an equation has no theoretical basis nor cannot easily be explained. Further, such an equation does<br />
not usually do very well as a predictive tool when applied to a new data set, a phenomenon.<br />
MLE has been seen as analogous to this approach. By finding parameters that maximize the<br />
joint probability density distribution, the approach may be fitting the data too tightly. The original logic<br />
behind the AIC and BIC/SC criteria were to penalize models that included too many variables (Findley,<br />
1993). The problem is that these corrections only partially adjust the model. It is still possible to overfit<br />
a model. Radford (2006) has suggested that, in addition to a penalty for too many variables, that the<br />
gradient assent in a maximum likelihood algorithm be stopped before reaching the peak. The result is that<br />
there is a reasonable solution to the problem rather than an exact one.<br />
Nannen (2003) has argued that overfitting creates a paradox because as a model fits the data<br />
better and better, it will do worse on other datasets to which it is applied for prediction purposes. In other<br />
words, it is better to have a simpler, but more robust, model than one that closely models one data set.<br />
Probably the biggest criticism against the MLE approach is that it underestimates the sampling errors by,<br />
again, overfitting the parameters (Husmeier and McGuire, 2002).<br />
39
Markov Chain Monte Carlo (MCMC) Simulation of Regression Functions<br />
To estimate a regression model from a complex function, we use a simulation approach called<br />
Markov Chain Monte Carlo (or MCMC). Chapter 9 of the <strong>CrimeStat</strong> manual discussed the Correlated<br />
Walk Analysis (CWA) routines. This was an example of a random walk whereby each step follows from<br />
the previous step. That is, a new position is defined only with respect to the previous position. This is an<br />
example of a Markov Chain.<br />
In recent years, there have been numerous attempts to utilize this methodology for simulating<br />
regression and other models using a Bayesian approach (Lynch, 2007; Gelman, Carlin, Stern, and Rubin,<br />
2004; Lee, 2004; Denison, Holmes, Malick and Smith, 2002; Carlin and Louis, 2000; Leonard and Hsu,<br />
1999).<br />
Hill Climbing Analogy<br />
To understand the MCMC approach, let us use a ‘hill climbing’ analogy. Imagine a mountain<br />
climber who wants to climb the highest mountain in a mountain range (for example, Mount Everest in the<br />
Himalaya mountain range). However, suppose a cloud cover has descended on the range such that the<br />
tops of mountains cannot be seen; in fact, assume that only the bases of the mountains can be seen.<br />
Without a map, how does the climber find the mountain with the highest peak and then climb it?<br />
Realistically, of course, no climber is going to try to climb without a map and, certainly, without good<br />
visibility. But, for the sake of the exercise, think of how this could be done.<br />
First, the climber could adopt a gradient approach with a systematic walking pattern. For<br />
example, he/she takes a step. If the step is higher than the current elevation (i.e., it is uphill), the climber<br />
then accepts the new position and moves to it. On the other hand, if the step is at the same or a lower<br />
elevation as the current elevation, the step is rejected. After each iteration (accepting or rejecting the new<br />
step), the procedure continues. Such a procedure is sometimes called a greedy algorithm because it<br />
optimizes the decision in incremental steps (local optimization; Wikipedia, 2010c; Cormen, Leiserson,<br />
Rivest, & Stein; 2009; So, Ye, & Zhang, 2007; Dijkestra, 1959).<br />
This strategy can be useful if there is a single mountain to climb. Because generally moving<br />
uphill means moving towards the peak of the mountain, this approach will often lead the climber to get to<br />
the peak if the mountain is smooth. For a single mountain, a greedy algorithm such as our hill climbing<br />
example often works fine. Maximum likelihood is similar to this in that it requires a smooth function for<br />
which each step upward is assumed to be climbing the mountain. For functions that are smooth, such as<br />
the single-parameter exponential family, such an algorithm will work very well.<br />
But, if there are multiple mountains (i.e., a range of mountains), how can we be sure that the peak<br />
that is climbed is really that of the highest mountain? In other words, again, without a map, for a range of<br />
mountains where there are multiple peaks but with only one being the highest, there is no guarantee that<br />
this greedy algorithm will find the single highest peak. Greedy algorithms work for simple problems but<br />
not necessarily for complex ones. Because they optimize the local decision process, they will not<br />
necessarily see the best approach for the whole problem (the global decision process).<br />
40
In other words, there are two problems that the climber faces. First, he/she does not know where<br />
to start. For this a ‘map’ would be ideal. Second, the search strategy of always choosing the step that<br />
goes up does not allow the climber to find alternative routes. Hills or mountains, as we all know, are<br />
rarely perfectly smooth; there are crevices and ridges and undulations in the gradient so that a climber<br />
will not always be going up in scaling a mountain. Instead, a climber needs to search a larger area<br />
(sampling, if you wish) in order to find a path that really does go up to the peak.<br />
This is the main reason why the MLE approach cannot estimate the parameters of a complex<br />
function since the approach works only for functions that are part of the single-parameter exponential<br />
family; they are closed-form functions for which there is a simple maxima that can be estimated. For<br />
these functions, which are very common, the MLE is a good approach. These functions are perfectly<br />
smooth which will allow a greedy algorithm to work. All of the generalized linear model functions –<br />
OLS, Poisson, negative binomial, binomial probit, and other, can be solved with the MLE approach.<br />
However, for a two or higher-parameter family, the approach will not work because there may be<br />
multiple peaks and a simple optimization approach will not necessarily discover the highest likelihood. In<br />
fact, for a complex surface, MLE may get stuck on a local peak (a local optima) and not have a way to<br />
backtrack in order to find another peak which is truly the highest.<br />
For these, one needs a map for a good starting location and a sampling strategy that allows the<br />
exploration of a larger area than just that defined by a greedy algorithm. The ‘map’ comes from a<br />
Bayesian approach to the problem and the alternative search strategy comes from a sampling approach.<br />
This is essentially the logic behind the MCMC method.<br />
Bayesian Probability<br />
Let us start with the ‘map’ and briefly review the information that was discussed in <strong>Update</strong><br />
chapter 2.1. Bayes Theorem is a formulation that relates the conditional and marginal probability<br />
distributions of random variables. The marginal probability distribution is a probability independent of<br />
any other conditions. Hence, P(A) and P(B) is the marginal probability (or just plain probability) of A<br />
and B respectively.<br />
The conditional probability is the probability of an event given that some other event has<br />
occurred. It is written in the form of P(A|B) (i.e., event A given that event B has occurred). In probability<br />
theory, it is defined as:<br />
or<br />
P(<br />
A<br />
B)<br />
P(<br />
A | B)<br />
(Up. 2.48)<br />
P(<br />
B)<br />
P(<br />
A B)<br />
P(<br />
B | A)<br />
(Up. 2.49)<br />
P(<br />
A)<br />
41
Bayes Theorem relates the two equivalents of the ‘and’ condition together.<br />
P( B)<br />
P(<br />
A | B)<br />
P(<br />
A)<br />
P(<br />
B | A)<br />
(Up. 2.50)<br />
P(<br />
A)<br />
P(<br />
B | A)<br />
P(<br />
A | B)<br />
<br />
P(<br />
B)<br />
(Up. 2.51)<br />
or<br />
P(<br />
B)<br />
P(<br />
A | B)<br />
P(<br />
B | A)<br />
(Up. 2.52)<br />
P(<br />
A)<br />
Bayesian Inference<br />
In the statistical interpretation of Bayes Theorem, the probabilities are estimates of a random<br />
variable. Let θ be a parameter of interest and let X be some data. Thus, Bayes Theorem can be expressed<br />
as:<br />
P(<br />
X | ) P(<br />
)<br />
P(<br />
| X ) (Up. 2.53)<br />
P(<br />
X )<br />
Interpreting this equation, P( | X ) is the probability of given the data, X . P ( ) is the<br />
probability that has a certain distribution and is usually called the prior probability. P ( X | ) is the<br />
probability that the data would be obtained given that θ is true and is usually called the likelihood function<br />
(i.e., it is the likelihood that the data will be obtained given . Finally, P (X ) is the marginal probability<br />
of the data, the probability of obtaining the data under all possible scenarios of ’s.<br />
The data are what was obtained from some data gathering exercise (either experimental or from<br />
observations). Since the prior probability of obtaining the data (the denominator of the above equation) is<br />
not known or cannot easily be evaluated, it is not easy to estimate it. Consequently, often the numerator<br />
only is used for estimating the posterior probability since<br />
P( | X ) P(<br />
X | ) P(<br />
)<br />
(Up. 2.54)<br />
where means ‘proportional to’. Because probabilities must sum to 1.0, the final result can be re-scaled<br />
so that the probabilities of all entities do sum to 1.0. The prior probability, P ( ) , essentially is the ‘map’<br />
in the hill climbing analogy discussed above! It points the way towards the correct solution.<br />
The key point behind this logic is that an estimate of a parameter can be updated by additional<br />
information systematically. The formula requires that a prior probability value for the estimate be given<br />
with new information being added that is conditional on the prior estimate, meaning that it factors in<br />
information from the prior. Bayesian approaches are increasingly being used to provide estimates for<br />
42
complex calculations that previously were intractable (Denison, Holmes, Mallilck, and Smith, 2002; Lee,<br />
2004; Gelman, Carlin, Stern, and Rubin, 2004).<br />
Markov Chain Sequences<br />
Now, let us look at an alternative search strategy, the MCMC strategy. Unlike a conventional<br />
random number generator that generates independent samples from the distribution of a random variable,<br />
the MCMC technique simulates a Markov chain with a limiting distribution equal to a specified target<br />
distribution. In other words, a Markov chain is a sequence of samples generated from a random variable<br />
in which the probability of occurrence of each sample depends only on the previous one. More<br />
specifically, a conventional random number generator draws a sample of size N and stops. It is noniterative<br />
and there is no notion of the generator converging. We simply require N sufficiently large. An<br />
MCMC algorithm, on the other hand, is iterative with the generation of the next sample depending on the<br />
value of the current sample. The algorithm requires us to sample until convergence has been obtained.<br />
Since the initial values of an MCMC algorithm are usually chosen arbitrarily and samples generated from<br />
one iteration to the next are correlated (autocorrelation), the question of when we can safely accept the<br />
output from the algorithm as coming from the target distribution gets complicated and is an important<br />
topic in MCMC (convergence monitoring and diagnosis).<br />
The MCMC algorithm involves five conceptual steps for estimating the parameter:<br />
1. The user specifies a functional model and sets up the model parameters.<br />
2. A likelihood function is set up and prior distributions for each parameter are assumed.<br />
3. A joint posterior distribution for all unknown parameters is defined by multiplying the likelihood<br />
and the priors as in equation Up. 2.54.<br />
4. Repeated samples are drawn from this joint posterior distribution. However, it is difficult to<br />
directly sample from the joint distribution since the joint distribution is usually a multidimensional<br />
distribution. The parameters are, instead, sampled sequentially from their full<br />
conditional distributions, one at a time holding all existing parameters constant (e.g. Gibbs<br />
sampling). This is the Markov Chain part of the MCMC algorithm. Typically, because it takes<br />
the chain a while to reach an equilibrium state, the early samples are thrown out as a burn-in and<br />
the results are summarized based on the M-L samples where M is the total number of iterations<br />
and L are the discarded (burn-in) samples (Miaou, 2006).<br />
5. The estimates for all coefficients are based on the results of the M-L samples, for example the<br />
mean, the standard deviation, the median and various percentiles. Similarly, the overall model fit<br />
is based on the M-L samples.<br />
43
MCMC Simulation<br />
Each of these conceptual steps are complex, of course, and involve some detail. The following<br />
represents a brief discussion of the steps. In Appendix D, Dominique Lord presents a more formal<br />
discussion of the MCMC method in the context of the Poisson-Gamma-CAR model.<br />
Step 1: Specifying a Model<br />
The MCMC algorithm can be used for many different types of models. In this version of<br />
<strong>CrimeStat</strong>, we examine two types of model:<br />
1. Poisson-Gamma Model. This is similar to the negative binomial model discussed above<br />
except that it is estimated by MCMC rather than by MLE. Formally, it is defined as:<br />
y<br />
~ Poisson ( )<br />
repeat (Up. 2.45)<br />
i<br />
|<br />
i<br />
i<br />
The Poisson mean<br />
<br />
i<br />
is organized as:<br />
T<br />
exp( x β )<br />
repeat (Up. 2.46)<br />
i<br />
i<br />
i<br />
where exp() is an exponential function, β is a vector of unknown coefficients for the k covariates plus an<br />
intercept, and <br />
i<br />
is the model error independent of all covariates. The exp( i<br />
) is assumed to follow the<br />
gamma distribution with a mean equal to 1 and a variance equal to 1/<br />
where is a parameter that<br />
is greater than 0 (Lord, 2006; Cameron & Trivedi, 1998).<br />
In the Bayesian approach, prior probabilities have to be assigned to all unknown parameters,<br />
β and . It is usually assumed that the coefficients follow a multivariate normal distribution with<br />
k 1 dimensions:<br />
β<br />
k<br />
MVN ( b , )<br />
(Up. 2.55)<br />
~<br />
k1 0<br />
B0<br />
where MVN<br />
k 1<br />
indicates a multivariate normal distribution with k 1<br />
dimension, and b<br />
0<br />
and B<br />
0<br />
are<br />
hyper-parameters (parameters that define the multivariate normal distribution). For a non-informative<br />
T<br />
prior specification, we usually assume b0 (0, ,0)<br />
and a large variance B<br />
0<br />
100I<br />
k 1<br />
, where I<br />
k1<br />
denotes the ( k 1<br />
)-dimensional identity matrix. Alternatively, independent normal priors can be placed<br />
on each of the regression parameters, e.g. <br />
k<br />
~ N(0, 100).<br />
If no prior information is known aboutβ ,<br />
then sometimes a flat uniform prior is also used.<br />
44
2. Poisson-Gamma-Conditional Autoregressive (CAR) Model. This is the negative binomial<br />
model but with a spatial autocorrelation term. Formally, it is defined as:<br />
y<br />
i<br />
|<br />
i<br />
i<br />
~ Poisson ( )<br />
(Up. 2.56)<br />
with the mean of Poisson-Gamma-CAR organized as:<br />
T<br />
exp( x β )<br />
(Up. 2.57)<br />
i<br />
i<br />
i<br />
i<br />
The assumption on the uncorrelated error term <br />
i<br />
is the same as in the Poisson-Gamma model. The third<br />
term in the expression, <br />
i<br />
, is a spatial random effect, one for each observation. Together, the spatial<br />
effects are distributed as a complex multivariate normal (or Gausian) density function. In other words,<br />
the second model is a spatial regression model within a negative binomial model.<br />
Spatial Component<br />
There are two common ways to express the spatial component, either as a CAR or as a<br />
Simultaneous Autoregressive (SAR) function (De Smith, Goodchild, & Longley, 2007). The CAR model<br />
is expressed as:<br />
ji<br />
<br />
E ( y | y ) w ( y )<br />
(Up. 2.58)<br />
i<br />
i<br />
ji<br />
ij<br />
j<br />
j<br />
where μ i is the expected value for observation i, w ij is a spatial weight between the observation, i, and all<br />
other observations, j (and for which all weights sum to 1.0), and ρ is a spatial autocorrelation parameter<br />
that determines the size and nature of the spatial neighborhood effect. The summation of the spatial<br />
weights times the difference between the observed and predicted values is over all other observations<br />
(i≠j).<br />
The SAR model has a simpler form and is expressed as:<br />
ji<br />
<br />
E( y | y ) w y<br />
(Up. 2.59)<br />
i<br />
i<br />
ji<br />
ij<br />
j<br />
where the terms are as defined above. Note, in the CAR model the spatial weights are applied to the<br />
difference between the observed and expected values at all other locations whereas in the SAR model, the<br />
weights are applied directly to the observed value. In practice, the CAR and SAR models produce very<br />
similar results. In this version of <strong>CrimeStat</strong>, we will only utilize the CAR model. We will add the SAR<br />
model to the next version.<br />
45
Step 2: Setting up a Likelihood Function<br />
The log likelihood function is set up as a sum of individual logarithms of the model. In the case<br />
of the Poisson-Gamma model, the log likelihood function is:<br />
<br />
L ln<br />
<br />
<br />
n<br />
<br />
i1<br />
e<br />
(<br />
)<br />
i<br />
( i<br />
)<br />
y !<br />
i<br />
y<br />
i<br />
<br />
<br />
<br />
n<br />
i<br />
yi<br />
ln( i<br />
) log<br />
( yi<br />
1)<br />
<br />
i1<br />
(Up. 2.60)<br />
with y i<br />
being the observed (actual) value of the dependent variable and <br />
i<br />
being the posterior mean of<br />
each site.<br />
For the Poisson-Gamma-CAR model, the log likelihood function is the same. The only<br />
difference is that, for the Poisson-Gamma, the posterior mean is based on<br />
T<br />
exp( x β )<br />
repeat (Up. 2.46)<br />
i<br />
i<br />
i<br />
while for the Poisson-Gamma-CAR model, the posterior mean is based on:<br />
T<br />
exp( x β )<br />
repeat (Up. 2.57)<br />
i<br />
i<br />
i<br />
i<br />
Step 3: Defining a Joint Posterior Distribution<br />
In the case of the Poisson-Gamma model, the posterior probability, p ( λ,<br />
β,<br />
| y)<br />
, of the joint<br />
posterior distribution is defined as:<br />
( λ,<br />
β,<br />
| y)<br />
f ( y | λ)<br />
<br />
( λ | β,<br />
) <br />
( 1)<br />
<br />
( ) <br />
( )<br />
(Up. 2.61)<br />
and is not in standard form (Park, 2009). Note that this is a general formulation. The parameters of<br />
interests are ( 1,<br />
n),<br />
( 1,<br />
<br />
J<br />
), and . Since it is difficult to draw samples of the parameters from<br />
the joint posterior distribution, we usually draw samples of each parameter from its full conditional<br />
distribution sequentially. This is an iterative process (the Markov Chain part of the algorithm).<br />
Prior distributions for these parameters have to be assigned. In the <strong>CrimeStat</strong> implementation,<br />
there is a parameter dialogue box that allows estimates for each of the parameters (including the<br />
intercept). On the other hand, if the user does not know which values to assign as prior probabilities, very<br />
vague values are used as default conditions to simulate what is known as non-informative priors<br />
(essentially, vague information). Sometimes these are known as flat priors if they assume all values are<br />
likely. In <strong>CrimeStat</strong>, we assign a default value for the expected coefficients of 0. As mentioned, the user<br />
can substitute more precise values for the expected value of the coefficients (based on previous research,<br />
for example). Generally, having more precise prior values for the parameters will lead to quicker<br />
convergence and a more accurate estimate.<br />
J<br />
46
Step 4: Drawing Samples from the Full Conditional Distribution<br />
Since the full conditional distribution itself is sometimes complicated (and becomes more so<br />
when the spatial components are added), the parameters are estimated by sampling from a distribution<br />
that represents the target distribution, either the target distribution itself if the function is standardized or<br />
a proposal distribution. While there are several approaches to sampling from a joint posterior<br />
distribution, the particular sampling algorithm used in <strong>CrimeStat</strong> is a Metropolis-Hastings (or MH)<br />
algorithm (Gelman, Carlin, Stern & Rubin, 2004; Denison, Holmes, Mallick, & Smith, 2002) with slice<br />
sampling of individual parameters. 4<br />
The MH algorithm is a general procedure for estimating the value of parameters of a complex<br />
function (Hastings, 1970; Metropolis, Rosenbluth, Rosenbluth, Teller & Teller, 1953). It was developed<br />
in the U. S. Hydrogen Bomb project by Metropolis and his colleagues and improved by Hastings. Hence,<br />
it is known as the Metropolis-Hastings algorithm. With this algorithm, we do not need to sample directly<br />
from the target distribution but from an approximation called a proposal distribution (Lynch, 2008). The<br />
basic algorithm consists of six steps (Train, 2009; Lynch, 2008; Denison, Holmes, Mallick, & Smith,<br />
2002).<br />
1. Define the functional form of the target distribution and establish starting values for each<br />
parameter that is to be estimated, θ 0 . For the first iteration, the existing value of the<br />
parameter, θ E , will equal θ 0 . Set t=1.<br />
2. Draw a candidate parameter from a proposal density, θ C .<br />
3. Compute the posterior probability of the candidate parameter and divide it by the posterior<br />
probability of the existing parameter. Call this R.<br />
4. If R is greater than 1, then accept the proposal density, θ C .<br />
5. If R is not greater than 1, compare it to a random number drawn from a uniform distribution<br />
that varies from 0 to 1, u. If R is greater than u, accept the candidate parameter, θ C . If R is<br />
not greater than u, keep the existing parameter θ E .<br />
6. Return to step 2 and keep drawing samples until sufficient draws are obtained.<br />
Let us discuss these steps briefly. In the first step, an initial value of the parameter is taken. It is<br />
assumed that the functional form of the target population is known and has been defined (e.g., the target is<br />
a Poisson-Gamma function or a Poisson-Gamma-CAR function). The initial value should be consistent<br />
with this function. As mentioned above, a non-informative prior value can be selected.<br />
Second, for each parameter in turn, a value is selected from a proposal density distribution. It is<br />
considered a ‘candidate’ since it is not automatically accepted as a draw from the target distribution. The<br />
proposal density can take any form that is easy to sample from, such as a normal distribution or a uniform<br />
4<br />
The Gibbs sampler utilizes the conditional probabilities of all parameters, which have to be specified. For a model<br />
such as the Poisson-Gamma, the Gibbs sampler could have been used. However, for a more complex model such as<br />
the Poisson-Gamma-CAR, the conditional probabilities were not easily defined. Consequently, we have decided to<br />
utilize the MH algorithm in the routine. More information on the Gibbs sampler can be found in Lynch (2008);<br />
Gelman, Carlin, Stern & Rubin (2004); and Denison, Holmes, Mallick, & Smith (2002). Slice sampling is a way of<br />
drawing random samples from a distribution by sampling under the density distribution (Radford, 2003).<br />
47
distribution though usually the normal is used. Also, usually the distribution is symmetric though the<br />
algorithm can work for non-symmetric proposal distributions, too (see Lynch, 2008, 109-112). In the<br />
<strong>CrimeStat</strong> implementation, we use a normal distribution. The proposal distribution does not have to be<br />
centered over the previous value of the parameter.<br />
Third, the ratio of the posterior probability of the candidate parameter to the posterior probability<br />
of the existing parameter is calculated. This is called the Acceptance probability and is defined as:<br />
Acceptance probability =<br />
f ( <br />
C<br />
) * g(<br />
<br />
E<br />
)<br />
R (Up. 2.62)<br />
f ( ) * g(<br />
)<br />
E<br />
C<br />
The acceptance probability is made up of the product of two ratios. The function f is the target<br />
distribution and the function g is the proposal distribution. The first ratio, f ( <br />
C<br />
) * f ( <br />
E<br />
) , is the ratio of<br />
the densities of the target function using the candidate parameter in the numerator relative to the existing<br />
parameter in the denominator. That is, with the target function (the function for which we are trying to<br />
estimate the parameter values), we calculate the density using the candidate value and then divide this by<br />
the density using the existing value. Lynch (2008) calls it the importance ratio since the ratio will be<br />
greater than 1 if the candidate value yields a higher density than the existing one.<br />
The second ratio, g( <br />
E<br />
) * g(<br />
<br />
C<br />
) , is the ratio of the proposal density using the existing value to<br />
the proposal density with the candidate value. This latter ratio adjusts for the fact that some candidate<br />
values may be selected more often than others (especially with asymmetrical proposal functions). Note<br />
that the first ratio involves the target function densities whereas the second ratio involves the proposal<br />
function densities. If the proposal density is symmetric, then the second ratio will only have a very small<br />
effect.<br />
Fourth, if R is greater than 1, meaning that the proposal density is greater than the original<br />
density, the candidate is accepted. However, if R is not greater than 1, this does not mean that the<br />
candidate is rejected but is instead compared to a random draw (otherwise we would have a ‘greedy<br />
algorithm’ that would only find local maxima).<br />
Fifth, a random number, u, that varies from 0 to 1 is drawn from a uniform distribution and<br />
compared to R. If R is greater than u, then the value of the candidate parameter is accepted and becomes<br />
the new ‘existing’ parameter. Otherwise, if R is not greater than u, the existing parameter remains.<br />
Finally, in the sixth step, we repeat this algorithm and keep drawing samples until the desired sample size<br />
is reached.<br />
Now what does this procedure do? Essentially, it draws values from the proposal distribution that<br />
increase the probability obtained from the target distribution. That is, generally only candidate values that<br />
increase the importance ratio will be accepted. But, this will not happen automatically (as in, for<br />
example, a greedy algorithm) since the ratio has to be compared to a random number, u, from 0 to 1. In<br />
the early steps of the algorithm, the random number may be higher than the existing R since it varies from<br />
0 to 1. Thus, the candidate value is initially rejected more because it does not contribute to a high R ratio.<br />
48
But, slowly, the acceptance probability will start to be accepted more often than the random<br />
draws since the candidate value will slowly approximate the true value of the parameter as it maximizes<br />
the target function’s probability. Using the hill climbing analogy, the climber will wander around initially<br />
going in different directions but will slowly start to climb the hill and, most likely, the hill that is highest<br />
in the nearby vicinity. Each step will not necessarily be accepted if it goes up since it is compared with a<br />
random ‘step’. Thus, the climber has to explore other directions than just ‘up’. But, over time, the<br />
climber will slowly move upward and, probably, more likely climb the highest hill nearby.<br />
It is still possible for this algorithm to find a local ‘peak’ rather than the highest ‘peak’ since it<br />
explores in the vicinity of the starting location. To truly climb the highest peak, the algorithm needs a<br />
good starting value. Where does this ‘good’ starting value come from? Earlier research can be one basis<br />
for choosing a likely starting point. The more a researcher knows about a phenomenon, the better he/she<br />
can utilize that information to ensure that the algorithm starts at a likely place. Lynch (2008) proposes<br />
using the MLE approach to calculate parameters that are used as the initial values. That is, for a common<br />
distribution, such as the negative binomial, we can use the MLE negative binomial to estimate the values<br />
of the coefficients and intercept and then plug these into the MCMC routine as the initial values for that<br />
algorithm. <strong>CrimeStat</strong> allows the defining of initial values for the coefficients in the MCMC routine.<br />
Step 5: Summarizing the Results from the Sample<br />
Finally, after a sufficient number of samples have been drawn, the results can be summarized by<br />
analyzing the sample. That is, if a sample is drawn from a target population (using the MH approach or<br />
another one, such as the Gibbs method), then the distribution of the sample parameters is our best guess<br />
for the distribution of the parameters of the target function. The mean of each parameter would be the<br />
best guess for the coefficient value of the parameter in the target function. Similarly, the standard<br />
deviation of the sample values would be the best guess for the standard error of the parameter in the target<br />
distribution. Credible intervals can be estimated by taking percentiles of the distribution. This is the<br />
Bayesian equivalent to a confidence interval in that it is estimated from a sample rather than from an<br />
asymptotic distribution. For example, the 95% credible interval can be calculated by taking the 2.5 th and<br />
97.5 th percentiles of the sample while the 99% credible interval can be calculated by taking the 0.5 th and<br />
99.5 th percentiles. There are also other statistics that can be calculated, for example the median (50 th<br />
percentile and the inter-quartile range (25 th and 75 th percentiles).<br />
In other words, all the results from the MCMC sample are used to calculate statistics about the<br />
target distribution. Once the MCMC algorithm has reached ‘equilibrium’, meaning that it approximates<br />
the target distribution fairly closely, then a sample of values for each parameter from this algorithm yields<br />
an accurate representation of the target distribution.<br />
Before we discuss some of the subtleties of the method, such as how many samples to draw and<br />
how many samples to discard before equilibrium has been established (burn in), let us illustrate this with<br />
the example that we have been using in this chapter.<br />
The MCMC algorithm for the Poisson-Gamma (negative binomial) model was run on the<br />
Houston burglary dataset. The total number of iterations that were run was 25,000 with the initial 5,000<br />
49
Table Up. 2.9:<br />
Predicting Burglaries in the City of Houston: 2006<br />
MCMC Poisson-Gamma Model<br />
(N= 1,179 Traffic Analysis Zones)<br />
DepVar:<br />
2006 BURGLARIES<br />
N: 1179<br />
Df: 1175<br />
Type of regression model:<br />
Poisson - Gamma<br />
Method of estimation:<br />
MCMC<br />
Number of iterations: 2500 Burn in: 5000<br />
Likelihood statistics<br />
Log Likelihood: -4430.8<br />
DIC: 10,105.5<br />
AIC: 8,869.6<br />
BIC/SC: 8,889.9<br />
Deviance: 1,387.5<br />
p-value of deviance: 0.0001<br />
Pearson Chi-Square: 1,106.4<br />
Model error estimates<br />
Mean absolute deviation: 40.0<br />
1 st (highest) quartile: 124.9<br />
2 nd quartile: 19.5<br />
3 rd quartile: 6.2<br />
4 th (lowest) quartile: 9.0<br />
Mean squared predicted error: 63,007.2<br />
1 st (highest) quartile: 245,857.0<br />
2 nd quartile: 6,527.5<br />
3 rd quartile: 119.4<br />
4 th (lowest) quartile: 156.2<br />
Over-dispersion tests<br />
Adjusted deviance: 1.2<br />
Adjusted Pearson Chi-Square: 0.9<br />
Dispersion multiplier: 1.5<br />
Inverse dispersion multiplier: 0.7<br />
MC error/<br />
Predictor Mean Std t-value p MC error std G-R stat<br />
-----------------------------------------------------------------------------<br />
INTERCEPT 2.3204 0.086 26.88 *** 0.002 0.019 1.002<br />
HOUSEHOLDS 0.0012 0.00007 17.57 *** 0.0000009 0.013 1.001<br />
MEDIAN<br />
HOUSEHOLD<br />
INCOME -0.00001 0.00002 -4.92 *** 0.00000003 0.019 1.002<br />
____________<br />
*** p≤.001<br />
50
eing discarded (the ‘burn in’ period). In other words, the results are based on the final 20,000 samples.<br />
Table Up. 2.9 show the results.<br />
First, there are convergence statistics indicating whether the algorithm converged. They do this<br />
by comparing chains of estimated values for parameters, either with themselves or with the complete<br />
series. The first convergence statistic is the Monte Carlo simulation error, called MC Error (Ntzoufras,<br />
2009, 30-40). Two estimates of the value of each parameter are calculated and their discrepancy is<br />
evaluated. The first estimate is the mean value of the parameter over all M-L iterations (total number of<br />
iterations minus the number of burn-in samples discarded). The second estimate is the mean value of the<br />
parameter after breaking the M-L iterations into m chains of approximately m iterations each where m is<br />
the square root of M-L.<br />
and<br />
Let:<br />
(<br />
Mean ) K<br />
(Up. 2.63)<br />
K i<br />
/<br />
i<br />
(<br />
Mean ) m<br />
(Up. 2.64)<br />
M m<br />
/<br />
m<br />
MCError <br />
Mean K<br />
Mean M<br />
m( m 1)<br />
(Up. 2.65)<br />
Generally, the MC error is related to the standard deviation of the parameters. If the ratio is less<br />
than 0.05, then the sequence is considered to have converged after the ‘burn in’ samples have been<br />
discarded (Ntzourfras, 2009). As can be seen, the ratios are very low in Table Up. 2.9.<br />
The second convergence statistic is the Gelman-Rubin convergence diagnostic (G-R), sometimes<br />
called the scale reduction factor (Gelman, Carlin, Stern & Rubin, 2004; Gelman, 1996; Gelman & Rubin,<br />
1992). Gelman and Rubin called it the R statistic, but we will call it the G-R statistic. The concept is,<br />
again, to break the larger chain into multiple smaller chains and calculate whether the variation within the<br />
chains for a parameter approximately equals the total variation across the chains (Lynch, 2008; Carlin &<br />
Louis, 2000). That is, when m chains are run, each of length n, the mean of a parameter θ m can be<br />
calculated for each chain as well as the overall mean of all chains θ G , the within-chain variance, and the<br />
between-chain variance. The G-R statistic is the square root of the total variance divided by the withinchain<br />
variance<br />
G R <br />
m 1<br />
n 1<br />
* <br />
m n<br />
B<br />
W<br />
<br />
<br />
<br />
n 1<br />
<br />
mn <br />
(Up. 2.66)<br />
51
where B is the variance between the means from the m parallel chains, W is the average of the m withinchain<br />
variances, and n is the length of each chain (Lynch, 2008; Carlin & Louis, 2000).<br />
The G-R statistic should generally be low for each parameter. If the G-R statistic is under<br />
approximately 1.2, then the posterior distribution is commonly considered to have converged (Mitra and<br />
Washington, 2007). In the example above, they are very low for all three parameters as well as for the<br />
error term. In other words, the algorithm appears to have converged properly and the results are based on<br />
a good equilibrium chain.<br />
Second, looking at the likelihood statistics, we see that they are very similar to that of the MLE<br />
negative binomial model (Table Up. 2.7). The log likelihood value is identical for the two models -<br />
4430.8. The AIC and BIC/SC statistics are also almost identical (8869.6 and 8869.8 compared to 8869.6<br />
and 8889.9). The table also includes a new summary statistic, the Deviance Information Criterion (or<br />
DIC). For models estimated with the MCMC, this is generally considered a more reliable indicator than<br />
the AIC or BIC/SC criteria. But since this is not calculated for the MLE, we cannot compare them. The<br />
deviance statistic is very similar for the two models - 1,387,5 compared to 1,390.1, as is the Pearson Chisquare<br />
statistic – 1,106.4 compared to 1,112.7.<br />
Third, in terms of the model error statistics, the MAD and MSPE are also very similar (40.0 and<br />
63,007.2 compared to 39.6 and 62,031.2; while the difference in the MSPE is 976.0, it is less than 2% of<br />
the MSPE for the MLE. 5<br />
Fourth, the over-dispersion tests reveal identical: adjusted deviance (1.2 for both); adjusted<br />
Pearson Chi-square (0.9 for both);; and the Dispersion multiplier (both 1.5).<br />
Fifth, the coefficients are identical with the MLE up through third decimal place. For example,<br />
for the intercept the MCMC gives 2.3204 compared to 2.3210; that of the two independent variables are<br />
identical within the precision of the table. This is not surprising since when we use non-informative<br />
priors, it is expected that the posterior estimates will be very close to those estimated by the MLE.<br />
Sixth, the standard errors are identical for all three coefficients. In the MCMC, the standard errors<br />
are calculated by taking the standard deviation of the sample. In general, the MCMC will produce similar<br />
or slightly larger standard errors. The theoretical distribution assumes that the errors are normally<br />
distributed. This may or may not be true depending on the data set. Thus, the MCMC standard errors are<br />
non-parametric.<br />
Seventh, a t-test (or more precisely a pseudo t-test) is calculated by dividing the coefficient by the<br />
standard error. If the standard errors are normally distributed (or approximately normally distributed),<br />
then such a test is valid. On the other hand, if the standard errors are skewed, then the approximate t-test<br />
is not accurate. <strong>CrimeStat</strong> outputs additional statistics that list the percentiles of the distributions. These<br />
are more accurate indicators of the true confidence intervals and are known as credible intervals. We will<br />
5<br />
Frequently, the model error is greater for an MCMC model than an MLE model. Whether this represents true model<br />
error or just a coincidence cannot be easily determined at this point.<br />
52
illustrate these shortly with another example. In short, the pseudo t-test is an approximation to true<br />
statistical significance and should be seen as a guide, rather than a definitive answer.<br />
Why Run an MCMC when MLE is So Easy to Estimate?<br />
What we have seen is that the MCMC negative binomial model produces results that are very<br />
similar to that of the MLE negative binomial model. In other words, simulating the distribution of the<br />
Poisson-Gamma function with the MCMC method has produced results that are completely consistent<br />
with a maximum likelihood estimate.<br />
A key question, then, is why bother? The maximum likelihood algorithm works efficiently with<br />
functions from the single-parameter exponential family while the MCMC method takes time to calculate.<br />
Further, the larger the database, the greater the differential in calculating time. For example, Table Up.<br />
2.8 presented an MLE negative binomial model of the number of 2006 crimes committed by individual<br />
offenders in Manchester as a function of three independent variables – distance from the city center, prior<br />
conviction, and age of the offenders. For the MLE test, the run took 6 seconds. For an MCMC<br />
equivalent test, the run took 86 minutes! Clearly, the MCMC algorithm is a lot more calculation intensive<br />
than the MLE algorithm. If they produce essentially the same results, there is no obvious reason for<br />
choosing the slower method over the faster one.<br />
The reason for preferring the MCMC method, however, has to do with the complexity of other<br />
models. The MLE approach works when all the functions in a mixed function model are part of the<br />
exponential family of functions. MLE is particularly well suited for this family. For more complex<br />
functions, however, the method does not work very well. The likelihood functions need to be worked out<br />
explicitly for the MLE approach to work. For example, if we were to substitute a lognormal term for the<br />
Gamma term in the negative binomial (so that the model became a Poisson-lognormal), a different<br />
likelihood function would need to be defined. If other functions for the dispersion were used, such as a<br />
Weibul or Gumbel or Cauchy or uniform distribution, the MLE approach would not easily be able to<br />
solve such equations since the mathematics are complex and there may not be a single optimal solution.<br />
Further, if we start combining functions in different mixtures, such as Poisson mean, Gamma<br />
dispersion but Weibul shape function, the MLE is not easily adapted. An example is spatial regression<br />
where assumptions about the mean, the variance and spatial autocorrelation need to be specified exactly.<br />
This is a complex model and there is not a simple second derivative that can be calculated for such a<br />
function. The existing spatial models have tried to work around this by using a linear form but allowing a<br />
spatial autocorrelation term either as a predictive variable (the spatial lag model) or as part of the error<br />
term (the spatial error model; DeSmith, Goodchild, & Longley, 2007; Anselin, 2002).<br />
In short, the MCMC method has an advantage over MLE for complex functions. For simpler<br />
functions in which the functions are all part of the same exponential family and for which the<br />
mathematics has been worked out, MLE is clearly superior in terms of efficiency. However, the more<br />
irregular and complex the function to be estimated, the more the simulation approach has an advantage<br />
over the MLE. In practice, the MLE is usually the preferred approach for estimating models, unless the<br />
53
model is too complex to be estimated via a likelihood function or informative priors can be used to refine<br />
the estimate of the model.<br />
In future versions of <strong>CrimeStat</strong>, we plan on introducing more complex models. For this version,<br />
we introduce the Poisson-Gamma-CAR model which cannot be solved by the MLE approach.<br />
Poisson-Gamma-CAR Model<br />
The Poisson-Gamma-CAR model has three mathematical properties. First, it has a Poisson mean,<br />
similar to the Poisson family of models. Second, it has a Gamma dispersion parameter, similar to the<br />
negative binomial model. Third, it incorporates an estimate of local spatial autocorrelation in a CAR<br />
format (see equation Up. 2.55). As mentioned above, the Poisson-Gamma-CAR function is defined as:<br />
y<br />
i<br />
|<br />
i<br />
i<br />
~ Poisson ( )<br />
repeat (Up. 2.56)<br />
with the mean of Poisson-Gamma-CAR organized as:<br />
exp( x β ) exp( x β ) <br />
repeat (Up. 2.57)<br />
i<br />
T<br />
i<br />
i<br />
i<br />
T<br />
i<br />
i<br />
i<br />
where exp() is an exponential function, β is a vector of unknown coefficients for the k covariates plus an<br />
intercept, and <br />
i<br />
is the model error independent of all covariates. The i<br />
exp( i<br />
) is assumed to follow<br />
the gamma distribution with a mean equal to 1 and a variance equal to 1 / where is a parameter that<br />
is greater than 0, and <br />
i<br />
is a spatial random effect, one for each observation.<br />
To model the spatial effect, <br />
i<br />
, we assume the following:<br />
2<br />
<br />
<br />
w w <br />
i<br />
ij<br />
p(<br />
<br />
<br />
i<br />
| Φ<br />
i<br />
) exp<br />
<br />
<br />
2 i<br />
<br />
<br />
j <br />
(Up. 2.67)<br />
2<br />
<br />
<br />
ji<br />
wi<br />
<br />
where p( <br />
i<br />
| Φi<br />
) is the probability of a spatial effect given a lagged spatial effect, wi<br />
w which ij<br />
sums all over j except i (all other zones). This formulation gives a conditional normal density with<br />
2<br />
wij<br />
<br />
i<br />
mean <br />
j<br />
and variance . The parameter determines the direction and overall magnitude<br />
ji<br />
wi<br />
<br />
w i <br />
of the spatial effects. The term w ij is a spatial weight function between zones i and j (see below). In<br />
the algorithm, the term 2 1/<br />
and the same variance is used for all observations.<br />
<br />
<br />
i<br />
j<br />
The Phi ( i<br />
) variable is, in turn, a function of three hyperparameters. The first is Rho ( ) and<br />
might be considered a global component. The second is Tauphi ( <br />
) and might be considered a local<br />
54
component while the third is Alpha ( ) and might be considered a neighborhood component since it<br />
measures the distance decay. Phi (Φ) is normally distributed and is a function of Rho and Tauphi.<br />
<br />
n<br />
<br />
2<br />
<br />
<br />
i<br />
| Φ<br />
i<br />
~ N (<br />
wij<br />
/ wi<br />
) <br />
j<br />
, <br />
/ wi<br />
(Up. 2.68)<br />
ji<br />
<br />
Tauphi, in turn, is assumed to follow a Gamma distribution<br />
2<br />
~ Gamma ( a , b )<br />
(Up. 2.69)<br />
<br />
<br />
<br />
<br />
where a<br />
and b<br />
<br />
are hyper-parameters. For a non-informative prior a<br />
0. 01and b<br />
0. 01are used as<br />
a default. Since the error term was assumed to be distributed as a Gamma distribution, it is easy to show<br />
T<br />
-x i<br />
that i<br />
follows Gamma ( , e i β<br />
) . The prior distribution for is again assumed to follow a Gamma<br />
distribution<br />
<br />
~<br />
<br />
Gamma ( a , b )<br />
(Up. 2.70)<br />
where a<br />
and b<br />
<br />
are hyper-parameters. For a non-informative prior a<br />
0. 01and b<br />
0. 01are used as<br />
a default.<br />
Finally, the spatial weights function, w<br />
ij<br />
, is a function of the neighborhood parameter, , which<br />
is a distance decay function. Three distance weight functions are available in Crimestat:<br />
1. Negative Exponential Distance Decay<br />
<br />
d ij<br />
w ij<br />
e<br />
(Up. 2.71)<br />
where d ij<br />
is the distance between two zones or points and α is the decay coefficient. The weight<br />
decreases with the distance between zones with α indicating the degree of decay.<br />
2. Restricted Negative Exponential Distance Decay<br />
<br />
d ij<br />
w ij<br />
Ke<br />
(Up. 2.72)<br />
where K is 1 if the distance between points is less than equal to a search distance and 0 if it is not. This<br />
function stops the decay if the distance is greater than the user-defined search distance (i.e., the weight<br />
becomes 0).<br />
3. Contiguity Function<br />
c<br />
ij<br />
w<br />
(Up. 2.73)<br />
ij<br />
55
where w<br />
ij<br />
is 1 if observation j is within a specified search distance of observation I (a neighbor) and 0<br />
if it is not.<br />
Example of Poisson-Gamma-CAR Analysis of Houston Burglaries<br />
To illustrate, we run the Houston burglary data set using a negative exponential spatial weights.<br />
The procedure we follow is similar to that outlined in Oh, Lyon, Washington, Persaud, and Bared (2003).<br />
First, we ran the Poisson-Gamma model that was illustrated in Table Up. 2.9 and saved the residual<br />
errors.<br />
Second, we tested the residual errors for spatial autocorrelation using the Moran’s “I” routine in<br />
<strong>CrimeStat</strong>. As expected, the “I” for the residuals was highly significant (“I” = 0.0089; p≤.001) indicating<br />
that there is substantial spatial autocorrelation in the error term.<br />
Third, we estimated the value of α, the distance decay coefficient. In <strong>CrimeStat</strong>, there is a<br />
diagnostic utility that will calculate a range of probable values for α. The diagnostic calculates the nearest<br />
neighbor distance (the average distance of the nearest neighbors for all observations) and then estimates<br />
values based on weights assigned to this distance. Three weights are estimated: 0.9, 0.75 and 0.5. We<br />
utilized the 0.75 weight. In the example, based on the nearest neighbor distance of 0.45 miles and a<br />
weight of 0.75, the alpha value would be -0.637 for distance units in miles.<br />
Fourth, the Poisson-Gamma-CAR model was run on the Houston burglary dataset using the<br />
estimated alpha value in mile units (-0.637). Table Up. 2.10 present the results. The likelihood statistics<br />
indicate that the overall model fit was similar to that of the Poisson-Gamma model. However, the log<br />
likelihood was slightly lower and the DIC, AIC and BIC/SC were slightly higher. Similarly the deviance<br />
the Pearson Chi-square tests were slightly higher. In other words, the Poisson-Gamma-CAR model does<br />
not have a higher likelihood than the Poisson-Gamma model. The reason is that the inclusion of the<br />
spatial component,, Φ, has not improved the predictability of the model. The DIC, AIC, BIC, deviance,<br />
and Pearson Chi-square statistics penalize the inclusion of additional variables.<br />
Regarding the individual coefficients, the intercept and the two independent variables have values<br />
very similar to that of MCMC Poisson-Gamma presented in Table Up. 2.9. Note, though, that the<br />
coefficient value for the intercept is now smaller. The reason is that the spatial effects, the Φ values, have<br />
absorbed some of the variance that was previously associated with the intercept. The table presents an<br />
average Phi value over all observations. The overall average was not statistically significant. However,<br />
Phi values for individual coefficients were output as an individual file and the predicted values of the<br />
individual cases include the individual Phi values.<br />
56
Table Up. 2.10:<br />
Predicting Burglaries in the City of Houston: 2006<br />
MCMC Poisson-Gamma-CAR Model<br />
(N= 1,179 Traffic Analysis Zones)<br />
DepVar:<br />
2006 BURGLARIES<br />
N: 1179<br />
Df: 1174<br />
Type of regression model:<br />
Poisson-Gamma-CAR<br />
Method of estimation:<br />
MCMC<br />
Number of iterations: 25000<br />
Burn in: 5000<br />
Distance decay function:<br />
Negative exponential<br />
Likelihood statistics<br />
Log Likelihood: -443<strong>3.3</strong><br />
DIC: 10,853.8<br />
AIC: 8,876.5<br />
BIC/SC: 8,901.9<br />
Deviance: 1,469.5<br />
p-value of deviance: 0.0001<br />
Pearson Chi-square: 1,335.0<br />
Model error estimates<br />
Mean absolute deviation: 45.1<br />
Mean squared predicted error: 94,236.4<br />
Over-dispersion tests<br />
Adjusted deviance: 1.3<br />
Adjusted Pearson Chi-Square: 1.1<br />
Dispersion multiplier: 1.4<br />
Inverse dispersion multiplier: 0.7<br />
MC error/<br />
Predictor Mean Std t-value p MC error std G-R stat<br />
-----------------------------------------------------------------------------<br />
INTERCEPT 2.2164 0.094 23.53 *** 0.0034 0.039 1.015<br />
HOUSEHOLDS 0.0012 0.00007 17.90 *** 0.000001 0.021 1.003<br />
MEDIAN<br />
HOUSEHOLD<br />
INCOME -0.000008 0.000002 -5.18 *** 0.00000003 0.020 1.003<br />
PHI(Average) 0.024 0.026 0.95 n.s. 0.001 0.056 1.023<br />
____________<br />
n.s. Not significant<br />
*** p≤.001<br />
57
Figure Up. 2.8 show the residual errors from the Poisson-Gamma-CAR model. As seen, the<br />
model overestimated on the west, southwest and southeast parts of Houston. This is in contrast with the<br />
normal model (Figure Up. 2.4), which underestimated in the southwest part of Houston with similar<br />
overestimation in the west and southeast. The Poisson-Gamma-CAR model has shifted the estimation<br />
errors in the southwest. As we have seen, this may not be the best model for this data set, though it is not<br />
particularly bad.<br />
Spatial Autocorrelation of the Residuals from the Poisson-Gamma-CAR model<br />
When we look at spatial autocorrelation among the residual errors, we now find much less spatial<br />
autocorrelation. The Moran’s “I” test for the residual errors was 0.0091. It is significant, but much less<br />
than before. To understand this better, Table Up. 2.11 presents the “I” values and the Getis-Ord “G”<br />
values for a search area of 1 mile for the raw dependent variable (2006 burglaries) and four separate<br />
models – the normal (OLS), the Poisson-NB1, the MCMC Poisson-Gamma (non-spatial), and the MCMC<br />
Poisson-Gamma-CAR, along with the Φ coefficient from the Poisson-Gamma-CAR model.<br />
Table Up. 2.11:<br />
Spatial Autocorrelation in the Residual Errors of the Houston Burglary Model<br />
Residuals<br />
Residuals MCMC Poisson<br />
Residuals MCMC Poisson- Gamma-<br />
Raw Residuals Poisson Poisson- Gamma- CAR<br />
Dependent Normal NB1 Gamma CAR Φ<br />
Variable Model Model Model Model Coefficient<br />
Moran’s “I” 0.252 **** 0.057 **** 0.119 **** 0.009 *** 0.009 *** 0.042 ****<br />
Getis-Ord “G” 0.007 **** -6.785 ** -16.118 ** 0.019 n.s. 0.017 n.s. 0.027 n.s.<br />
(1 mile search<br />
radius)<br />
____________<br />
n.s. Not significant<br />
** p≤.01<br />
*** p≤.001<br />
**** p≤.0001<br />
Moran’s “I” tests for positive and negative spatial autocorrelation. A positive value indicates that<br />
adjacent zones are similar in value while a negative value indicates that adjacent zones are very different<br />
in value (i.e., one being high and one being low). As can be seen, there is positive spatial autocorrelation<br />
58
Figure Up. 2.8:
for the dependent variable and for each of the four comparison models. However, the amount of positive<br />
spatial autocorrelation decreases substantially. With the raw variable – the number of 2006 burglaries per<br />
zone, there is sizeable positive spatial autocorrelation. However, the models reduce this substantially by<br />
accounting for some of the variance of this variable through the two independent variables. The two<br />
negative binomial (Poisson-Gamma) models have the least amount with little difference between the<br />
Poisson-Gamma and the Poisson-Gamma-CAR.<br />
The Getis-Ord “G” statistic, however, distinguishes two types of positive spatial autocorrelation,<br />
positive spatial autocorrelation where the zones with high values are adjacent to zones also with high<br />
values (high positive) and positive spatial autocorrelation where the zones with low values are adjacent<br />
zones also with low values (low positive). This is a property that Moran’s “I” test cannot do. A routine<br />
for the “G” statistic was introduced in <strong>CrimeStat</strong> version 3.2 and the documentation of it can be found in<br />
the update chapter for that version.<br />
The “G” has to be compared to an expected “G”, which is essentially the sum of the weights.<br />
However, when used with negative numbers, such as residual errors, the “G” has to be compared with a<br />
simulation envelope. The statistical test for “G” in Table Up. 2.11 indicate whether the observed “G” was<br />
higher than the 97.5 th or 99.5 th percentiles (high positive) or lower than the 2.5 th or 0.5 th percentiles (low<br />
positive) of the simulation envelope.<br />
The results show that the “G” for the raw burglary values are ‘high positive’, meaning that zones<br />
with many burglaries tend to be near other zones also with many burglaries. For the analysis of the<br />
residual errors, however, the normal and Poisson-NB1 models are negative and significant, meaning that<br />
they show positive spatial autocorrelation but of the ‘low positive’ type. That is, the clustering occurs<br />
because zones with low residual errors are predominately near other zones with low residual errors. That<br />
is, the models have better predicted the zones with low numbers of burglaries than those with high<br />
numbers. On the other hand, the residuals errors for the MCMC Poisson-Gamma and for the MCMC<br />
Poisson-Gamma-CAR models are not significant. In other words, these models have accounted for much<br />
of the effect measured by the “G” statistic.<br />
The last column analyzes the spatial autocorrelation tests on the individual Phi coefficients. There<br />
is spatial autocorrelation for the Phi values, as seen by a very significant Moran “I” value, but it is neither<br />
a ‘high positive’ or a ‘low positive’ based on the “G” test. In other words, the Phi values appear to be<br />
neutral with respect to the clustering of residual errors.<br />
Figure Up. 2.9 show the distribution of the Phi values. By and large, the spatial adjustment is<br />
very minor in most parts of Houston with its greatest impact at the edges, where one might expect some<br />
spatial autocorrelation due to very low numbers of burglaries and ‘edge effects’.<br />
Putting this in perspective, the spatial effects in the Poisson-Gamma-CAR model are small<br />
adjustments to the predicted values of the dependent variable. They slightly improve the predictability of<br />
the model but do not fundamentally alter it. Keep in mind that spatial autocorrelation is a statistical effect<br />
of some other variable operating that is not being measured in the model. Spatial autocorrelation is not a<br />
‘thing’ or a process but the result of not adequately accounting for the dependent variable.<br />
60
Figure Up. 2.9:
In theory, with a correctly specified model, the variance of the dependent variable should be<br />
completely explained by the independent variables with the error term truly representing random error.<br />
Thus, there should be no spatial autocorrelation in the residual errors under this ideal situation. The<br />
example that we have been using is an overly simple one. There are clearly other variables that explain<br />
the number of burglaries in a zone other than the number of households and the median household income<br />
– the types of buildings in the zone, the street layout, lack of visibility, the types of opportunities for<br />
burglars, the amount of surveillance, and so forth. The existence of a spatial effect is an indicator that the<br />
model could still be improved by adding more variables.<br />
Risk Analysis<br />
Sometimes a dependent variable is analyzed with respect to an exposure variable. For example,<br />
instead of modeling just burglaries, a user might want to model burglaries relative to the number of<br />
households. In our example in this chapter (Houston burglaries), we have included the number of<br />
households as a predictor variable but it is unstandardized, meaning that the estimated effect of<br />
households on burglaries cannot be easily compared to other studies that model burglaries relative to<br />
households.<br />
For this, a different type of analysis has to be used. Frequently called a risk analysis, the<br />
dependent variable is related to an exposure measure. The formulation we use is that of Besag, Green,<br />
Higdon and Mengersen (1995). Like all the non-linear models that we have examined, the dependent<br />
variable, y , is modeled as a Poisson function of the mean, μ i with a Gamma dispersion:<br />
i<br />
y Poisson(<br />
)<br />
(Up. 2.74)<br />
i<br />
~<br />
i<br />
In turn, the mean of the Poisson is modeled as:<br />
<br />
(Up. 2.75)<br />
i<br />
i<br />
i<br />
where<br />
i<br />
is an exposure measure and<br />
i<br />
is the rate (or risk). The exposure variable is the baseline<br />
variable to which the number of events is related. For example, in motor vehicle crash analysis, the<br />
exposure variable is usually Vehicle Miles Traveled or Vehicle Kilometers Traveled (times some multiple<br />
of 10 to eliminate very small numbers, such as per 1000 or per 100 million). In epidemiology, the<br />
exposure variable is the population at risk, either the general population or the population of a specific age<br />
group perhaps broken down further into gender. For crime analysis, the exposure variable might be the<br />
number of households for residential crimes or the number of businesses for commercial crimes.<br />
Choosing an appropriate exposure variable is not a trivial matter. In some cases, there are national<br />
standards for exposure (e.g., number of infants for analyzing child mortality; Vehicle Miles Traveled for<br />
analyzing motor vehicle crash rates). But, often there are not accepted exposure standards.<br />
62
The rate is further structured in the Poisson-Gamma-CAR model as:<br />
T<br />
<br />
<br />
exp( x β )<br />
(Up. 2.76)<br />
i<br />
i<br />
i<br />
i<br />
i<br />
where the symbols have the same definitions as in equation Up. 2.57.<br />
With the exposure term, the full model is estimated as the same fashion,<br />
i<br />
i<br />
y<br />
i<br />
~<br />
i i<br />
Poisson ( )<br />
(Up. 2.77)<br />
-x βi<br />
~ Gamma ( , e<br />
)<br />
i<br />
T<br />
i<br />
(Up. 2.78)<br />
Note that no coefficient for the exposure variable <br />
i<br />
is estimated (i.e., it is 1.0). It is sometimes<br />
called an offset variable (or exposure offset). The model is then estimated either with an MLE or MCMC<br />
estimation algorithm.<br />
An example is that of Levine (2010) who analyzed the number of motor vehicle crashes in which<br />
a male was the primary driver relative to the number of crashes in which a female was the primary driver<br />
for each major road segment in the Houston metropolitan area. In the risk model set up, the dependent<br />
variable was the number of crashes involving a male primary driver for each road segment while the<br />
exposure (offset) variable was the number of crashes involving a female primary driver. The independent<br />
variables in the equation were volume-to-capacity ratio (an indicator of congestion on the road), the<br />
distance to downtown Houston, and several road categories (freeway, principal arterial, etc).<br />
To illustrate this type of model, we ran an MCMC Poisson-Gamma-CAR model using the<br />
number of households as the exposure variable. There was, therefore, only one independent variable,<br />
median household income. Table Up. 2.12 show the results.<br />
The summary statistics indicate that the overall model fit is good. The log likelihood is high while<br />
the AIC and BIC are moderately low. Compared to the non-exposure burglary model (Table Up. 2.11),<br />
the model does not fit the data as well. The log likelihood is lower while the AIC and BIC are higher.<br />
Further, the DIC is very high<br />
For the model error estimates, the MAD and the MSPE are smaller, suggesting that the burglary<br />
risk model is more precise, though not more accurate.<br />
However, the dispersion statistics indicate that there is ambiguity over-dispersion. The dispersion<br />
multiplier is very low which, by itself, would suggest that a “pure” Poisson model could be used.<br />
However, the adjusted Pearson Chi-square is very high while the adjusted deviance is moderately high.<br />
In other words, the exposure variable has not eliminated the dispersion as much as the random effects<br />
(non-exposure) model.<br />
63
Table Up. 2.12:<br />
Predicting Burglaries in the City of Houston: 2006<br />
MCMC Poisson-Gamma-CAR Model with Exposure Variable<br />
(N= 1,179 Traffic Analysis Zones)<br />
DepVar:<br />
2006 BURGLARIES<br />
N: 1179<br />
Df: 1174<br />
Type of regression model:<br />
Poisson-Gamma-CAR<br />
Method of estimation:<br />
MCMC<br />
Number of iterations: 25000<br />
Burn in: 5000<br />
Distance decay function:<br />
Negative exponential<br />
Likelihood statistics<br />
Log Likelihood: -4,736.6<br />
DIC: 146,129.2<br />
AIC: 9,481.2<br />
BIC/SC: 9,501.5<br />
Deviance: 2,931.1<br />
p-value of deviance: 0.0001<br />
Pearson Chi-square: 34,702.9<br />
Model error estimates<br />
Mean absolute deviation: 18.6<br />
Mean squared predicted error: 1,138.9<br />
Over-dispersion tests<br />
Adjusted deviance: 2.5<br />
Adjusted Pearson Chi-Square: 29.5<br />
Dispersion multiplier: 0.6<br />
Inverse dispersion multiplier: 1.7<br />
MC error/<br />
Predictor Mean Std t-value p MC error std G-R stat<br />
-----------------------------------------------------------------------------<br />
Exposure/offset variable:<br />
HOUSEHOLDS 1.0<br />
Linear predictors:<br />
INTERCEPT -2.2794 0.0786 -29.00 *** 0.003 0.036 1.007<br />
MEDIAN<br />
HOUSEHOLD<br />
INCOME -0.00002 0.000002 -10.38 *** 0.00000005 0.032 1.006<br />
AVERAGE PHI 0.0442 0.0320 -1.38 n.s. 0.0098 0.021 1.002<br />
____________<br />
n.s. Not significant<br />
*** p≤.001<br />
64
Table Up. 2.12 (continued)<br />
Percentiles 0.5 th 2.5 th 97.5 th 99.5 th<br />
-------------------------------------------------------------<br />
INTERCEPT -2.4879 -2.4365 -2.1292 -2.0810<br />
MEDIAN<br />
HOUSEHOLD<br />
INCOME -0.00002 -0.00002 -0.00001 -0.00001<br />
AVERAGE PHI -0.1442 -0.1128 0.0145 0.0348<br />
Looking at the coefficients, the offset variable (number of households) has a coefficient of 1.0<br />
because it is defined as such. The coefficient for median household income is still negative, but is<br />
stronger than in Table Up. 2.10. The effect of standardizing households as the baseline exposure variable<br />
has increased the importance of household income in predicting the number of burglaries, controlling for<br />
the number of households. Finally, the average Φ value is positive but not significant, similar to what it<br />
was in Table Up. 2.10.<br />
The second part of the table show percentiles for the coefficients, and is preferable for statistical<br />
testing than the asymptotic t-test. The reason is that the distribution of parameter values may not be<br />
normally distributed or may be very skewed, whereas the t- and other parametric significance tests<br />
assume that there is perfect normality. <strong>CrimeStat</strong> outputs a number of percentiles for distribution. We<br />
have shown only four of them, the 0.5 th , 2.5 th , 97.5 th , and 99.5 th percentiles. The 2.5 th and 97.5 th represent<br />
95% credible intervals while the 0.5 th and 99.5 th represent 99% credible intervals.<br />
The way to interpret the percentiles is to check whether a coefficient of 0 (the ‘null hypothesis’)<br />
or any other particular value is outside the 95% or 99% credible intervals. For example, with the intercept<br />
term, the 95% credible interval is defined by -2.4365 to -2.1292. Since both are negative, clearly a<br />
coefficient of 0 is outside this range; in fact, it is outside the 99% credible interval as well (-2.4879 to -<br />
2.0810). In other words, the intercept is significantly different than 0, though the use of the term<br />
‘significant’ is different than with the usual asymptotic normality assumptions since it is based on the<br />
distribution of the parameter values from the MCMC simulation.<br />
Of the other parameters that were estimated, median household income is also significant beyond<br />
the 99% credible interval but the Φ coefficient is not significantly different than a 0 coefficient (i.e., a Φ<br />
of 0 falls between the 2.5 th and the 97.5 th percentiles).<br />
In other words, percentiles can be used as a non-parametric alternative to the t- or Z-test. Without<br />
making assumptions about the theoretical distribution of the parameter value (which the t- and Z-test do –<br />
they are assumed to be normal or near normal for “t”), significance can be assessed empirically.<br />
65
In summary, in risk analysis, an exposure variable is defined and held constant in the model.<br />
Thus, the model is really a risk or rate model that relates the dependent variable to the baseline exposure.<br />
The independent variables are now predicting the rate, rather than the count by itself.<br />
Issues in MCMC Modeling<br />
We now turn to four issues in MCMC modeling. The first is the starting values of the MCMC<br />
algorithm. The second is the issue of convergence to an equilibrium state. The third issue is the<br />
statistical testing of parameters and the general problem of overfitting the data while the fourth issue is<br />
the performance of the MCMC algorithm with large datasets.<br />
Starting Values of Each Parameter<br />
The MCMC algorithm requires that initial values be provided for each parameter to be estimated.<br />
These are called prior probabilities even though they do not have to be standardized in terms of a number<br />
from 0 to 1. The <strong>CrimeStat</strong> routine allows the defining of initial starting values for each of the parameters<br />
and for the overall Φ coefficient in the Poisson-Gamma-CAR model. If the user does not define the<br />
initial starting values, then default values are used. Of necessity, these are vague. For the individual<br />
coefficients (and the intercept), the initial default values are 0. For the Φ coefficient, the initial default<br />
values are defined in terms of its hyperparameters, (Rho = 0.5; Tauphi = 1; alpha = -1). Essentially, these<br />
assume very little about the distribution and are, for all practical purposes, non-informative priors.<br />
The problem with using vague starting values, however, is that the algorithm could get stuck on a<br />
local ‘peak’ and not actually find the highest probability. Even though the MCMC algorithm is not a<br />
greedy algorithm, it still explores a limited space. It will generally find the highest peak within its search<br />
radius. But, there is no guarantee that it will explore regions far away from its initial location. If the user<br />
has some basis for estimating a prior value, then this will usually be of benefit to the algorithm in that it<br />
can minimize the likelihood of finding local ‘peaks’ rather than the highest ‘peak’.<br />
Where do the prior values come from? They can come from other research, of course.<br />
Alternatively, they can come from other methods that have attempted to analyze the same phenomena.<br />
Lynch (2008), for example proposes running an MLE Poisson-Gamma (negative binomial) model and<br />
then using those estimates as the prior values for the MCMC Poisson-Gamma. Even if the user is going<br />
to run an MCMC Poisson-Gamma-CAR model, the estimates from the MLE negative binomial are<br />
probably good starting values, as we saw in the Houston burglary example above.<br />
Example of Defining Prior Values for Parameters<br />
We can illustrate this with an example. A model was run on 325 Baltimore County traffic<br />
analysis zones (TAZ) predicting the number of crimes that occurred in each zone in 1996. There were<br />
four independent variables:<br />
1. Population (1996)<br />
2. Relative median household income index<br />
66
3. Retail employment (1996)<br />
4. Distance from the center of the metropolitan area (in the City of Baltimore)<br />
The dataset was divided into two groups, group A with 163 TAZs and group B with 162 TAZs.<br />
The model was run as a Poisson-Gamma-CAR for each of the groups. Table Up. 2.13 show the results of<br />
the coefficients with the standard errors in brackets.<br />
Table Up. 2.13:<br />
The Effects of Starting Values on Coefficient Estimates for Baltimore County Crimes:<br />
Dependent Variable = Number of Crimes in 1996<br />
(1) (2) (3)<br />
Group A Group B Group B<br />
(N=163 TAZs) (N=162 TAZs) (N=162 TAZs)<br />
Starting values: Default/ Default/ Group A<br />
‘non-informative’ ‘non-informative’ estimates<br />
Independent variables<br />
Intercept 4.3621 4.7727 4.7352<br />
(0.2674) (0.2434) (0.2489)<br />
Population 0.00035 0.00034 0.00035<br />
(0.00004) (0.00004) (0.00004)<br />
Relative<br />
Income -0.0234 -0.0226 -0.0224<br />
(0.0047) (0.0041) (0.0043)<br />
Retail<br />
Employment 0.0021 0.0017 0.0017<br />
(0.0002) (0.0002) (0.0001)<br />
Distance from<br />
Center -0.0590 -0.0898 -0.0881<br />
(0.0160) (0.0141) (0.0142)<br />
Phi (Φ)<br />
Coefficient 0.0104 -0.0020 0.0077<br />
(0.1117) (0.0676) (0.0683)<br />
Column 1 show the results of running the model on group A. Column 2 show the results of<br />
running the model on group B while column 3 show the results of running the model on group B but<br />
using the coefficient estimates from group A as prior values. With the exception of the relative income<br />
variable, the coefficients of column C generally fall between the results for group A and group B by<br />
themselves. Even the one exception – relative income, is very close to the ‘non-informative’ estimate for<br />
group B.<br />
67
In other words, using prior values that are based on realistic estimates (in this case, the estimates<br />
from group A) have produced results that incorporate that information in estimating the information just<br />
from the data. Essentially, this is what equation Up. 2.54 does, updating the probability estimate of the<br />
data given the likelihood based on the prior probability. In short, using prior estimates combines old<br />
information with the new information to update the estimates. Aside from protecting against finding local<br />
optima in the MCMC algorithm, the prior information generally improves the knowledge base of the<br />
model.<br />
Convergence<br />
In theory, the MCMC algorithm should converge into a stable equilibrium state whereby the true<br />
probability distribution is being sampled. With the hill climbing analogy, the climber has found the<br />
highest mountain to be climbed and is simply sampling different locations on the mountain to see which<br />
one will provide the best path up the mountain. The first iterations in a sequence are thrown away (the<br />
‘burn in’) because the sequence is assumed to be looking for the true probability distribution. Put another<br />
way, the starting values of the MCMC sequence have a big effect on the early draws and it takes a while<br />
for the algorithm to move away from those initial values (remember, it is a random walk and the early<br />
steps are near the initial starting location).<br />
A key question is how many samples to draw and a second, ancillary question is how many<br />
should be discarded as the ‘burn in’? Unfortunately, there is not a simple answer to these questions. For<br />
some distributions, the algorithm quickly converges on the correct solution and a limited number of draws<br />
are needed to accurately estimate the parameters. In the Houston burglary example, the algorithm easily<br />
converged with 20,000 iterations after the first 5,000 had been discarded. We have been able to estimate<br />
the model accurately after only 4000 iterations with 1000 burn in samples being discarded. The<br />
dependent variable is well behaved because it is at the zonal level and the model is simple.<br />
On the other hand, some models do not easily converge to an equilibrium stage. Models with<br />
individual level data are typically more volatile. Also, models with many independent variables are<br />
complex and do not easily converge. To illustrate, we estimate a model of the residence locations of<br />
drunk drivers (DWI) who were involved in crashes in Baltimore County between 1999 and 2001 (Levine<br />
& Canter, 2010). The drivers lived in 532 traffic analysis zones (TAZ) in both Baltimore County and the<br />
City of Baltimore. The dependent variable was the annual number of drivers involved in DWI crashes<br />
who lived in each TAZ and there were six independent variables:<br />
1. Total population of the TAZ<br />
2. The percent of the population who were non-Hispanic White<br />
3. Whether the TAZ was in the designated rural part of Baltimore County (dummy variable: 1 –<br />
Yes; 0 – No)<br />
4. The number of liquor stores in the TAZ<br />
5. The number of bars in the TAZ<br />
6. The area of the TAZ (a control variable).<br />
Table Up. 2.14 present the results.<br />
68
Table Up. 2.14:<br />
Number of Drivers Involved in DWI Crashes Living in Baltimore County: 1999-2001<br />
MCMC Poisson-Gamma Model with 20,000 Iterations<br />
(N= 532 Traffic Analysis Zones)<br />
DepVar:<br />
ANNUAL NUMBER OF DRIVERS INVOLVED IN DWI<br />
CRASHES LIVING IN TAZ<br />
N: 532<br />
Type of regression model:<br />
Poisson with Gamma dispersion<br />
Method of estimation:<br />
MCMC<br />
Total number of iterations: 25,000 Burn in: 5,000<br />
Likelihood statistics<br />
Log Likelihood: -278.7<br />
DIC: 256,659.6<br />
AIC: 573.4<br />
BIC/SC: 607.6<br />
Deviance: 316.6<br />
p-value of deviance: 0.0001<br />
Pearson Chi-square: 475.6<br />
Model error estimates<br />
Mean absolute deviation: 0.32<br />
Mean squared predicted error: 0.25<br />
Over-dispersion tests<br />
Adjusted deviance: 0.60<br />
Adjusted Pearson Chi-Square: 0.91<br />
Dispersion multiplier: 0.15<br />
Inverse dispersion multiplier: 6.77<br />
MC error/<br />
Predictor Mean Std t-value p MC error std G-R stat<br />
----------------------------------------------------------------------------<br />
Intercept -4.5954 0.476 -9.65 *** 0.0386 0.081 1.349<br />
Population 0.0004 0.00005 8.70 *** 0.000003 0.068 1.165<br />
Pct White 0.0237 0.005 4.81 *** 0.0004 0.079 1.283<br />
Rural 0.6721 0.329 2.04 * 0.0184 0.056 1.042<br />
Liquor<br />
Stores 0.2423 0.125 1.94 n.s. 0.0059 0.047 1.028<br />
Bars 0.1889 0.058 3.28 ** 0.0024 0.041 1.008<br />
Area -0.0548 0.033 -1.68 n.s. 0.0018 0.055 1.041<br />
____________<br />
n.s. Not significant<br />
** p≤.01<br />
*** p≤.001<br />
69
The overall model fit was statistically significant and there was very little over-dispersion (as<br />
seen by the dispersion parameter). A “pure” Poisson model could have been used in this case. Of the<br />
parameters, the intercept and four of the six independent variables were statistically significant, based on<br />
the pseudo t-test. The results were consistent with expectations, namely zones (TAZs) with greater<br />
population, with a greater percentage of non-Hispanic White persons, that were in the rural part of the<br />
county, that had more liquor stores, and that had more bars had a higher number of drunk drivers residing<br />
in those zones.<br />
However, the convergence statistics were questionable. Two of the parameters had G-R values<br />
higher than the acceptable 1.2 level and five of the MC error/standard error values were higher than the<br />
acceptable 0.05 level. In other words, it appears that the model did not properly converge.<br />
Consequently, we ran the model again with 90,000 iterations after discarding the initial 10,000<br />
‘burn in’ samples. Table Up. 2.15 show the results. Comparing Table s Up. 2.15 with Up. 2.14, we can<br />
see that the overall likelihood statistics was approximately the same as were the over-dispersion statistics.<br />
However, the convergence statistics indicate that the model with 90,000 iterations had better convergence<br />
than that with only 20,000. Of the parameters, none had a G-R value greater than 1.2 while only one had<br />
an MC Error/Standard error value greater than 0.05, and that only slightly.<br />
This had an effect on both the coefficients and the significance levels. The coefficients were in<br />
the same direction for both models but were slightly different. Further, the standard deviations were<br />
generally smaller with more iterations and only one of the independent variables was not significant (area,<br />
which was a control variable).<br />
In other words, increasing the number of iterations improved the model. It apparently converged<br />
for the second run whereas it had not for the first run. The algorithm did this for two reasons. First, by<br />
taking a larger number of iterations, the model was more precise. Second, by dropping more initial<br />
iterations during the ‘burn in’ phase (10,000 compared to 5,000), the series apparently reached an<br />
equilibrium state before the sample iterations are calculated. The smaller standard errors suggest that<br />
there still was a trend when only 5,000 were dropped but had ceased by the time the first 10,000 iterations<br />
had been reached.<br />
The point to remember is that one wants a stable series before drawing a sample. If in doubt, run<br />
more iterations and drop more during the ‘burn in’ phase. This increases the calculating time, of course,<br />
but the results will be more reliable. One can do this in stages. For example, run the model with the<br />
default 25,000 iterations with 5,000 for the ‘burn in’ (for a total of 20,000 sample iterations from which to<br />
base the conclusions). If the convergence statistics suggest that the series has not yet stabilized, run the<br />
model again with more iterations and ‘burn in’ samples.<br />
70
Table Up. 2.15:<br />
Number of Drivers Involved in DWI Crashes Living in Baltimore County: 1999-2001<br />
MCMC Poisson-Gamma Model with 90,000 Iterations<br />
(N= 532 Traffic Analysis Zones)<br />
DepVar:<br />
NUMBER OF DRIVERS INVOLVED IN DWI CRASHES<br />
LIVING IN TAZ<br />
N: 532<br />
Type of regression model:<br />
Poisson with Gamma dispersion<br />
Method of estimation:<br />
MCMC<br />
Total number of iterations: 100,000 Burn in: 10,000<br />
Likelihood statistics<br />
Log Likelihood: -278.6<br />
DIC: 2,915,931.9<br />
AIC: 573.2<br />
BIC/SC: 607.4<br />
Deviance: 317.9<br />
p-value of deviance: 0.0001<br />
Pearson Chi-square: 479.5<br />
Model error estimates<br />
Mean absolute deviation: 0.32<br />
Mean squared predicted error: 0.25<br />
Over-dispersion tests<br />
Adjusted deviance: 0.61<br />
Adjusted Pearson Chi-Square: 0.92<br />
Dispersion multiplier: 0.14<br />
Inverse dispersion multiplier: 7.36<br />
MC error/<br />
Predictor Mean Std t-value p MC error std G-R stat<br />
----------------------------------------------------------------------------<br />
Intercept -4.6608 0.425 -10.96 *** 0.0222 0.052 1.085<br />
Population 0.0004 0.00005 8.78 *** 0.000002 0.041 1.041<br />
Pct White 0.0243 0.004 5.77 *** 0.0002 0.050 1.081<br />
Rural 0.6378 0.324 1.97 * 0.0092 0.028 1.005<br />
Liquor<br />
Stores 0.2431 0.123 1.98 * 0.0033 0.027 1.002<br />
Bars 0.1859 0.055 <strong>3.3</strong>6 *** 0.0011 0.020 1.004<br />
Area -0.0515 0.032 -1.63 n.s. 0.0009 0.029 1.008<br />
___________<br />
n.s. Not significant<br />
* p≤.05<br />
** p≤.01<br />
*** p≤.001<br />
71
Monitoring Convergence<br />
A second concern is how to monitor convergence. There appear to be two different approaches.<br />
One is a graphical approach whereby a plot of the parameter values is made against the number of<br />
iterations (often called trace plots). If the chain has converged, then there should be no visible trend in<br />
the data (i.e., the series should be flat). The WinBugs software package uses this approach (BUGS, 2008).<br />
For the time being, we have not included a graphical plot of the parameters in this version of <strong>CrimeStat</strong><br />
because of the difficulties in using this plot with the block sampling approach to be discussed shortly.<br />
Also, graphical visualizations, while useful for informing readers, can be misinterpreted. A series<br />
that appears to be stable, such as the Baltimore County DWI crash example given above, may actually<br />
have a subtle trend. A series can look stable and yet summary statistics such as the G-R statistic and the<br />
MC Error relative to the standard error statistic do not indicate convergence.<br />
On the other hand, summary convergence statistics, such as these two measures, are not<br />
completely reliable indicators either since a series may only temporarily be stable. This would be<br />
especially true for a simulation with a limited number of runs. Both the G-R and MC Error statistics<br />
require that at least 2500 iterations be run, with more being desirable.<br />
Some authors argue that one needs multiple approaches for monitoring convergence (Carlin and<br />
Louis, 2000, 182-183). While we would agree with this approach, for the time being we are utilizing<br />
primarily the convergence statistics approach. In a later version of <strong>CrimeStat</strong>, we may allow a graphical<br />
time series plot of the parameters.<br />
Statistically Testing Parameters<br />
With an MCMC model, there are two ways that statistical significance can be tested. The first is<br />
by assuming that the sampling errors of the algorithm approximate a normal distribution and, thereby, the<br />
t-test is appropriate. In the output table, the t-value is shown, which is the coefficient divided by the<br />
standard error. With a simple model, a dependent variable with higher means and adequate sample, this<br />
might be a reasonable assumption for a regular Poisson or Poisson-Gamma function. However, for<br />
models with many variables and with low sample means, such an assumption is probably not valid (Lord<br />
& Miranda-Moreno, 2008). Further, with the addition of many predictor parameters added, the<br />
assumption becomes more questionable.<br />
Consequently, MCMC models tend to be tested by looking at the sampling distribution of the<br />
parameter and calculating approximate 95% and 99% credible intervals based on the percentile<br />
distribution, as illustrated above in Table Up. 2.12.<br />
Multicollinearity and Overfitting<br />
But statistical testing does not just involve testing the significance of the coefficients, whether by<br />
asymptotic t- or Z-tests or by percentiles. A key issue is whether a model is properly specified. On the<br />
one hand, a model can be incomplete since there are other variables that could predict the dependent<br />
72
variable. The Houston burglary model is clearly underspecified since there are additional factors that<br />
account for burglaries, as we suggested above.<br />
But, there is also the problem of overspecifying a model, that is, including too many independent<br />
variables. While the algorithms – MLE or MCMC, can fit virtually any model that is defined, logically<br />
many of these models should have never been tested in the first place.<br />
Multicollinearity<br />
The phenomenon of multicollinearity among independent variables is well known, and most<br />
statistical texts discuss this. In theory, each independent variable should be statistically independent of<br />
the other independent variables. Thus, the amount of variance for the dependent variable that is<br />
accounted for by each independent variable should be a unique contribution. In practice, however, it is<br />
rare to obtain completely independent predictive variables. More likely, two or more of the independent<br />
variables will be correlated. The effect is that the estimated standard error of a predictor variable is no<br />
longer unique since it shares some of the variance with other independent variables. If two variables are<br />
highly correlated, it is not clear what contribution each makes towards predicting the dependent variable.<br />
In effect, multicollinearity means that variables are measuring the same thing.<br />
Multicollinearity among the independent variables can produce very strange effects in a<br />
regression model. Among these effects are: 1) If two independent variables are highly correlated, but one<br />
is more correlated with the dependent variable than the other, the stronger one will usually have a correct<br />
sign while the weaker one will sometimes get flipped around (e.g., from positive to negative, or the<br />
reverse). 2) Two variables can cancel each other out; each coefficient is significant when it alone is<br />
included in a model but neither are significant when they are together; 3) One independent variable can<br />
inhibit the effect of another correlated independent variable so that the second variable is not significant<br />
when combined with the first one; and 4) If two independent variables are virtually perfectly correlated,<br />
many regression routines break down because the matrix cannot be inverted. All these effects indicate that<br />
there is non-independence among the independent variables.<br />
Aside from producing confusing coefficients, multicollinearity can overstate the predictability of<br />
a model. Since every independent variable accounts for some of the variance of the dependent variable,<br />
with multicollinearity, the overall model will appear to improve when it probably has not.<br />
A good example of this is a model that we ran relating the number of 1996 crime trips that<br />
originated in each of 532 traffic analysis zones in Baltimore County and the City of Baltimore that<br />
culminated in a crime committed in Baltimore County. The dependent variable was, therefore, the<br />
number of 1996 crimes originating in the zone while there were six independent variables:<br />
1. Population of the zone (1996)<br />
2. An index of relative median household income of the zone (relative to the zone with the<br />
highest income)<br />
3. Retail employment in the zone (1996)<br />
4. Non-retail employment in the zone (1996)<br />
73
5. The number of miles of the Baltimore Beltway (I-695) that passed through the zone<br />
6. A dummy variable indicating whether the Baltimore Beltway passed through the zone.<br />
The last two variables are clearly highly correlated. If a zone has the Baltimore Beltway passing<br />
through it, then it has some miles of that freeway assigned to it. The simple Pearson correlation between<br />
the two variables is 0.71. Logically, one should not include highly correlated variables in a model. But,<br />
what happens if we do this? Table Up. 2.16 illustrate what can happen. Only the coefficients are shown.<br />
In the first model, the Beltway miles variable was used along with population, income, retail employment<br />
and non-retail employment. In the second model, the dummy variable for whether the Baltimore Beltway<br />
passed through the zone or not was used with the four other independent variables. In the third model,<br />
both the Beltway miles and the dummy variable for the Baltimore Beltway were both included along with<br />
the four other independent variables.<br />
Table Up. 2.16:<br />
Effects of Multicollinearity on Estimation<br />
MLE Poisson-Gamma Model<br />
(N= 532 Traffic Analysis Zones in Baltimore County)<br />
Dependent variable:<br />
Number of 1996 crimes that originated in a zone<br />
(1) (2) (3)<br />
Model 1: Model 2: Model 3:<br />
Independent variables<br />
Intercept 1.6437 *** 1.5932 *** 1.5964 ***<br />
Population 0.00045 *** 0.00045 *** 0.00045 ***<br />
Relative<br />
Income -0.0184 *** -0.0188 *** -0.0188 ***<br />
Retail<br />
Employment -0.00024 * -0.00026 * -0.00026 *<br />
Non-retail<br />
Employment -0.0001 *** -0.00013 *** -0.00013 ***<br />
Beltway miles 0.1864 n.s. --- -0.0397 n.s.<br />
Beltway --- 0.3194 * 0.3496 *<br />
____________<br />
n.s. Not significant<br />
* p≤.05<br />
** p≤.01<br />
*** p≤.001<br />
The coefficients for the intercept and the four other independent variables are very similar (and<br />
sometimes identical) across the three models. So, look at the two correlated variables. In the first model,<br />
the Beltway miles variable is positive, but not significant. In the second model, the Beltway dummy<br />
variable is positive and significant. In the third model, however, when both Beltway variables were<br />
74
included, the Beltway miles variable has become negative while the Beltway dummy variable remains<br />
positive and significant.<br />
In other words, including two highly correlated variables has caused illogical results. That is,<br />
without realizing that the two variables are, essentially, measuring the same thing, one might conclude<br />
that the effect of the Beltway passing through a zone is to increase the likelihood that offenders live in<br />
that zone but that the effect of having Beltway miles in the zone decreases the likelihood! Any such<br />
conclusion is nonsense, of course. In short, do not include highly correlated variables in the same model.<br />
Well, how do we know if two or more variables are correlated? There is a simple tolerance test<br />
that is included in the MLE models and in the diagnostics utility for the regression module. Repeating<br />
equation Up. 2.18, tolerance is defined as:<br />
Tol i = 1 – R 2 j≠i repeat (Up. 2.18)<br />
where R 2 j≠i is the R-square associated with the prediction of one independent variable with the remaining<br />
independent variables in the model. In the example, the tolerance of both the Beltway miles variable and<br />
the Beltway dummy variable was 0.49 whereas when each were in the equation by themselves (models 1<br />
and 2), the tolerance was 0.97. The tolerance test should be the first indicator in suspecting too much<br />
overlap in two or more independent variables.<br />
The tolerance test is a simple one and is based on normal (OLS) regression. Nevertheless, it is a<br />
very good indicator of potential problems. When the tolerance of a variable becomes low, then the<br />
variable should be excluded from the model. Typically, when this happens two or more variables will<br />
show a low tolerance and the user can choose which one to remove.<br />
How ‘low’ is low? There is no simple answer to this, but variables with reasonably high<br />
tolerance values can have substantial multicollinearity. For example, if there are only two independent<br />
variables in a model and they are correlated 0.3, then the tolerance score is 0.91 (100 – 0.3 2 ). While 0.91<br />
appears high, in fact it indicates that is 9% of overlap between the two variables. <strong>CrimeStat</strong> prints out a<br />
warning message about the degree of multicollinearity based on the tolerance levels. But, the user needs<br />
to understand that overlapping independent variables can lead to ambiguous and unreliable results. The<br />
aim should be to have truly independent variables in a model since the results are more likely to be<br />
reliable over time.<br />
Stepwise Variable Entry to Control Multicollinearity<br />
One solution to limiting the number of variables in a model is to use a stepwise fitting procedure.<br />
There are three standard stepwise procedures. In the first procedure, variables are added one at a time (a<br />
forward selection model). The independent variable having the strongest linear correlation with the<br />
dependent variable is added first. Next, the independent variable from the remaining list of independent<br />
variables having the highest correlation with the dependent variable controlling for the one variable<br />
already in the equation is added and the model is re-estimated. In each step, the independent variable<br />
remaining from the list having the highest correlation with the dependent variable controlling for the<br />
75
variables already in the equation is added to the model, and the model is re-estimated. This proceeds until<br />
either all the independent variables are added to the equation or else a stopping criterion is met. The usual<br />
criterion is only variables with a certain significance level are allowed to enter (called a p-to-enter).<br />
Second, a backward elimination procedure works in reverse. All independent variables are<br />
initially added to the equation. The variable with the weakest coefficient (as defined by the significance<br />
level and the t- or Z-test) is removed, and the model is re-estimated. Next, the variable with the weakest<br />
coefficient in the second model is removed, and the model is re-estimated. This procedure is repeated<br />
until either there are no more independent variables left in the model or else a stopping criterion is met.<br />
The usual criterion is that all remaining variables pass a certain significance level (called a p-to-remove).<br />
This ensures that all variables in the model pass this significance level.<br />
The third method is a combination of these procedures, first adding a variable in a forward<br />
selection manner but second removing any variables that are no longer significant or using a backward<br />
elimination procedure but allowing new variables to enter the model if they suddenly become significant.<br />
There are advantages to each approach. A fixed model allows specified variables to be included.<br />
If either theory or previous research has indicated that a particular combination of variables is important,<br />
then the fixed model allows that to be tested. A stepwise procedure might drop one of those variables.<br />
On the other hand, a stepwise procedure usually can obtain the same or higher predictability than a fixed<br />
procedure.<br />
Within the stepwise procedures, there are also advantages and disadvantages to each method,<br />
though the differences are generally very small. A forward selection procedure adds variables one at a<br />
time. Thus, the contribution of each new variable can be seen. On the other hand, a variable that is<br />
significant at an early stage could become not significant at a later stage because of the unique<br />
combinations of variables. Similarly, a backward elimination procedure will ensure that all variables in<br />
the equation meet a specified significance level. But, the contribution of each variable is not easily seen<br />
other than through the coefficients. In practice, one usually obtains the same model with either<br />
procedure, so the differences are not that critical.<br />
A stepwise procedure will not guarantee that multicollinearity will be removed entirely.<br />
However, it is a good procedure for narrowing down the variables to those that are significant. Then, any<br />
co-linear variables can be dropped manually and the model re-estimated.<br />
In the normal and MLE Poisson routines, there is a backward elimination procedure whereby<br />
variables are dropped from an equation if their coefficients are not significant.<br />
Overfitting<br />
Overfitting is a more general phenomenon of including too many variables in an equation. With<br />
the development of Bayesian models, this has become an increasing occurrence because the models,<br />
usually estimated with the MCMC algorithm, can fit an enormous number of parameters. Many of these<br />
models estimate parameters that are properties of the functions used (called hyperparameters) rather than<br />
76
just the variables input as part of the data. In the Poisson-Gamma-CAR model, for example, we estimate<br />
the dispersion parameter (ψ) and a general Φ function. Phi (Φ), in turn, is a function of a global<br />
component (Rho, ρ), a local component (Tauphi τ Φ ), and a neighborhood component (Alpha -α).<br />
These parameters are part of the functions and are not data. But, since they can vary and are<br />
often estimated from the data, there is always the potential that they could be highly correlated and,<br />
thereby, cause ambiguous results to occur. Unfortunately, there are not good diagnostics for<br />
multicollinearity among the hyperparameters, as there is with the tolerance test. But, the problem is a real<br />
one and one that the user should be cognizant. Sometimes an MCMC or MLE model fails to converge<br />
properly, meaning that it either doesn’t finish or else produced inconsistent results from one run to<br />
another. We usually assume that the probability structure of the space being modeled is too complex for<br />
the model that we are using. And, while that may be true, it is also possible that there is overlap in some<br />
of the hyperparameters. In this case, one would be better off choosing a simpler model – one with fewer<br />
hyperparameters, than a more complex one.<br />
Condition Number of Matrix<br />
In other words, a user should be very cautious about overfitting models with too many variables,<br />
both the data variables and those estimated from functions (the hyperparameters). We have included a<br />
condition matrix test for the distance matrix in the Poisson-Gamma-CAR model. The condition number<br />
of a matrix is an indicator of how amenable it is to digital solution (Wikipedia, 2010d). A matrix with a<br />
low condition number is said to be well conditioned whereas one with a high number is said to be illconditioned.<br />
With ill-conditioned matrices, the solutions are volatile and inconsistent from one run to<br />
another. How ‘high’ is high? Numbers higher than, say, 400 are generally ill-conditioned while low<br />
condition numbers (say, under 100) are well conditioned. Between 100 and 400 is an ambiguous area.<br />
For the Poisson-Gamma-CAR model, if you see a condition number higher than 100, be cautious. If you<br />
see one higher than 400, assume the results are completely unreliable with respect to the spatial<br />
component.<br />
Overfitting and Poor Prediction<br />
There is also a question about the extent to which a model that is fit is reliable and accurate for<br />
predicting a data set which is different. Without going into an extensive literature review, a few<br />
guidelines can be given. The Machine Learning computing community concentrates on training samples<br />
in order to estimate parameters and then using the estimated models to predict a test sample (another data<br />
set). In general, they have found that simple models do better for prediction than complicated models.<br />
One can always fit a particular data set by adding variables or adding complexity to the mathematical<br />
function. On the other hand, the more complex the model – the more independent variables in it and the<br />
more specified hyperparameters, generally the model will do worse when applied to a new data set.<br />
Nannen (2003) called this the paradox of overfitting, and it is a rule that a user would be well advised to<br />
follow. Try to keep your models simple and reliable. In the long run, simple models with well-defined<br />
independent variables will generally do better for prediction.<br />
77
Improving the Performance of the MCMC Algorithm<br />
Most medium- and large police departments use large datasets, such as calls for service, crime<br />
reports, motor vehicle crash reports and other data sets. The largest police departments have huge data<br />
sets, constituting millions of records. Further, these data are being collected on a continual basis.<br />
<strong>CrimeStat</strong> was developed to handle fairly large data sets and the routines are optimized for this.<br />
However, large data sets pose a problem for multivariate modeling in a number of ways. First,<br />
they pose a computing problem in terms of the processing of information. As the number of records goes<br />
up, the demand for computer resources increases exponentially. For example, consider the problem of<br />
calculating a distance matrix for use in, say, the Poisson-Gamma-CAR model. If each number is<br />
represented by 64 bits (double precision), then the amount of memory space required is a function of<br />
K 2 *64 where K is the number of records. For example, if there are 10,000 records (a relatively small<br />
database by police standards), then the amount of memory required will be 10,000*10,000*64 = 6.4<br />
billion bits (or 800 Mb). On the other hand, if the number of records is 100,000, then the memory<br />
demand goes up to 80,000 Mb (or 80 Gb). That such databases take a long time to be analyzed is<br />
understandable.<br />
Second, large data sets pose problems for interpretation. The ‘gold standard’ for testing of<br />
coefficients or even the overall fit of a model has been to compare the coefficients to 0. This follows<br />
from traditional statistics (whom the Bayesians call frequentists) whereby a particular statistic (in this<br />
case, a regression coefficient) is compared to a ‘null hypothesis’ which is usually 0. However, with large<br />
datasets, especially with extremely large datasets, virtually all coefficients will be significantly different<br />
from 0, no matter how they are tested (with t-tests or with percentiles). In this case, ‘significance’ does<br />
not necessarily mean ‘importance’. For example, if you have a data set of one million records and plug in<br />
a model with 10 independent variables, the chances are that the majority of the variables will be<br />
significantly different than 0. This does not mean that the variables are important in any way, only that<br />
they account for some of the variance of the dependent variable greater than what would be expected on<br />
the basis of chance.<br />
The two problems interact when a user works with a very large dataset. The routines may have<br />
difficulty calculating the solution and the results may not necessarily be very meaningful, albeit<br />
significance is tested in the usual way. This will be particularly true for complex models, such as the<br />
Poisson-Gamma-CAR. An example will illustrate this. With an Intel 2.4 Ghz computer with a duel core,<br />
we ran a model with three independent variables on a scalable dataset; that is, we took a large dataset and<br />
sampled smaller subsets of it. We then tested the MCMC Poisson-Gamma and MCMC Poisson-Gamma-<br />
CAR models with subsets of different size. Table Up. 2.17 present the results.<br />
As can be seen, the calculation time goes up exponentially with the sample size. Further, with the<br />
spatial Poisson-Gamma-CAR model, a limit was reached. Because this routine is calculating the distance<br />
between each observation and every other observation as part of calculating the spatial weight coefficients<br />
(see equation Up. 2.55), the memory demands blow up very quickly. The non-spatial Poisson-Gamma<br />
model can be run on larger datasets (we have run them on sets as large as 100,000 records) but the spatial<br />
78
model cannot be. Even with the non-spatial model, the calculation time for a very large dataset goes up<br />
very substantially with the sample size.<br />
Table Up. 2.17:<br />
Effects of Sample Size on Calculations<br />
(Second to Complete)<br />
Sample size Poisson-Gamma Poisson-Gamma-CAR<br />
125 23 67<br />
250 43 163<br />
500 81 480<br />
1,000 160 1,569<br />
2,000 305 6,000<br />
4,000 622 25,740<br />
5,000 762 43,740<br />
8,000 1,247 Unable to complete<br />
12,000 1,869 Unable to complete<br />
15,000 2,412 Unable to complete<br />
20,000 3,278 Unable to complete<br />
Scaling of the Data<br />
There are several things that can be done to improve the performance of the MCMC algorithm<br />
with large datasets. The first is to scale the data, either by reducing the number of digits that represent<br />
each value or by standardizing by Z-scores. There are different ways to scale the data, but a simple one is<br />
to move the decimal places. For example, if one of the variables is median household income and is<br />
measured in tens of thousands (e.g., 55,000, 135,000), then these values can be divided by 1000 so that<br />
they represent ‘per 1000’ (i.e., 55.0 and 135.0 in the example).<br />
To illustrate, we ran a single-family housing value model on a large data set of 588,297 singlefamily<br />
home parcels. The data came from the Harris County Appraisal District and the model related the<br />
2007 assessed value against the square feet of the home, the square feet of the parcel, the distance from<br />
downtown Houston and two dummy variables - whether the home had received a major remodeling<br />
between 1985 and 2007 and whether the parcel was within 200 feet of a freeway. The valuations were<br />
coded as true dollars and were then re-scaled into units of ‘per 1000’ (e.g., 45,000 became 45.0). When<br />
the data were in real units, the time to complete the run was 20.8 minutes for the MCMC Poisson-Gamma<br />
(using the Block Sampling Method). When the data were in units of thousandths, the time to complete<br />
the run was 15.3 minutes for the MCMC Poisson-Gamma.<br />
In other words, scaling the data by reducing the number of decimal places led to an improvement<br />
in calculating time of around 25% for the MCMC model. The effects on an MLE model will be even<br />
79
more powerful due to the different algorithm used. The point is, scaling your data will pay in terms of<br />
improving the efficiency of runs.<br />
Block Sampling Method for the MCMC<br />
Another solution is to sample records from the full database and run the MCMC algorithm on that<br />
sample. The statistics from the run are calculated. Then, the process is repeated with another sample, and<br />
the statistics are calculated on this sample. Then, the process is repeated again and again. We call this<br />
the block sampling method and it has been implemented in <strong>CrimeStat</strong>.<br />
The user defines certain three parameters for controlling the sampling:<br />
1. The block sampling threshold – the size of the database beyond which the block sampling<br />
method will be implemented. For example, the default block sampling threshold is set at<br />
6,000 observations, though the user can change this. With this default, any dataset that has<br />
fewer than 6,000 records/observations will be analyzed with the full database. However, any<br />
dataset that has 6,000 records or more will cause the block sampling routine to be<br />
implemented.<br />
2. Average block size – the expected block size of a sample from the block sampling method.<br />
The default is 400 records thought the user can change this. The routine defines a sampling<br />
interval, based on n/N where n is the defined average block size and N is the total number of<br />
records. For drawing a sample, however, a uniform random number from 0 to 1 is drawn and<br />
compared to the ratio of n/N. If the number is equal to or less than this ratio (probability),<br />
then the record is accepted for the block sample; if the number is greater than this ratio, the<br />
record is not accepted for the block sample. Thus, any one sample may not have exactly the<br />
number of records defined by the user. But, on average, the average sample size over all runs<br />
will be very close to the defined average block size though the variability is high.<br />
3. Number of samples – the number of samples drawn. The default is 25 though the user can<br />
change this. We have found that 20-30 samples produce very reasonable results.<br />
The routine then proceeds to implement the block sampling method. For example, if the user<br />
keeps the default parameters, then the block sampling method will only be implemented for databases of<br />
6,000 records or more. If the database passes the threshold, then each of the 25 samples are drawn with,<br />
approximately, 400 records per sample. The MCMC algorithm is run on each of the samples and the<br />
statistics are calculated. After all 25 samples have been run, the routine summarizes the results by<br />
averaging the summary statistics (likelihood, AIC, BIC/SC, etc), the coefficients, the standard errors, and<br />
the percentile distribution. The results that are printed represent the average over all 25 samples.<br />
We have found that this method produces very good approximations to the full database. For<br />
several datasets, we have compared the results of the block sampling method with running the full<br />
database through the MCMC routine. The means of the coefficients appear to be unbiased estimates of<br />
the coefficients for the full database. Similarly, the percentiles appear to be very close, if not unbiased,<br />
80
estimates of the percentiles for the full database. On the other hand, the standard errors appear to be<br />
biased estimates of standard errors of the full database. The reason is that they are calculated from a<br />
sample of n observations where the standard errors of the full database are calculated from N<br />
observations.<br />
An adjusted standard error is produced which approximates the true standard error of the full<br />
database. It is defined as;<br />
<br />
n<br />
AdjStd. Err StdErrblock<br />
*<br />
(Up. 2.79)<br />
N<br />
where StdErr block is the average standard error from the k samples, N is the total number of records, and<br />
<br />
n is the average block size (the empirical average, not the expected sample size). This is only output<br />
when the block sampling method is used.<br />
Another statistic that does not scale well with the block sampling method is the Deviance<br />
Information Criterion (DIC). Consequently, the DIC is calculated as the average of the block sample<br />
rather than being scaled to a full dataset. A note to that effect is printed. In making comparisons between<br />
models, one should use the block sample average for the DIC. Other statistics, however, appear to be<br />
well estimated by the block sampling method.<br />
Comparison of Block Sampling Method with Full Dataset<br />
Test 1<br />
A test was constructed to compare the block sampling method with the full MCMC method on<br />
two datasets. The first dataset contained 4000 road segments in the Houston metropolitan area and the<br />
model that was run was a traffic model relating vehicle miles traveled (VMT - the dependent variable)<br />
against the number of lanes, the number of lane miles, and the volume-to-capacity ratio of the segment. It<br />
is not a very meaningful model but was used to test the algorithm.<br />
The dataset was tested with the MCMC model using all records (the full dataset) and the block<br />
sampling method. For simplicity, the variables have been called X 1 …X k . The significance levels of the<br />
coefficients for the full dataset based on the t-test are shown, since these are based on the estimated<br />
standard errors rather than the adjusted standard errors.<br />
Table Up. 2.18 show the results of the traffic dataset. The coefficients are very close within the<br />
second decimal place and the adjusted standard errors are within the third decimal place. On the other<br />
hand, the block sampling method took 11.2 minutes to run compared to only 7.7 for the full dataset. With<br />
a dataset of this size (N=4000), there was no advantage for the block sampling method even though it<br />
produced very similar results.<br />
81
Test 2<br />
Now, let’s take a more complicated dataset. The second represented 97,429 crimes committed in<br />
Manchester, England. It is part of a study on gender differences in crime travel (Levine & Lee, 2010).<br />
The model related the journey to crime distance against 14 independent variables involving spatial<br />
location, land use, type of crime, ethnicity of the offender, prior conviction history, and gender. Not all of<br />
the variables are significant, according to the t-test of the full dataset.<br />
Table Up. 2.18:<br />
Comparing Block Sampling Method with Full Database<br />
MCMC Poisson-Gamma Model<br />
Houston Traffic Dataset<br />
(Time to Complete)<br />
Dependent variable = Vehicle Miles Traveled<br />
Full dataset<br />
Block Sampling method<br />
(N=4000) (n = 402.9)<br />
Iterations: 20,000 20,000<br />
Burn in: 5,000 5,000<br />
Number of samples: 1 20<br />
Time to<br />
complete run: 7.7 minutes 11.2 minutes<br />
Adj.<br />
Std. Std. Std.<br />
Variable Coefficient Error Coefficient Error Error<br />
Intercept 4.5414 *** 0.045 4.5498 *** 0.140 0.044<br />
X 1 0.6254 *** 0.022 0.6267 *** 0.066 0.021<br />
X 2 0.8502 *** 0.020 0.8618 *** 0.064 0.020<br />
X 3 2.4163 *** 0.049 2.3938 *** 0.154 0.049<br />
_____________________________________________________________________________<br />
Significance of block sampling method based on unadjusted standard error<br />
n.s. Not significant<br />
* p≤.05<br />
** p≤.01<br />
*** p≤.001<br />
Table Up. 2.19 show the results of the journey to crime dataset. In this case, there were greater<br />
discrepancies in the coefficients between the full dataset and the block sampling method. The signs of the<br />
coefficients were identical for all parameters except X 10 , which was not significant. For all parameters,<br />
though, the coefficient for the full dataset was within the 95% credible interval of the block sampling<br />
method. That is, since this is a sample, the sampling error of the block sampling method incorporates the<br />
coefficient for the full dataset for all 16 parameters. The adjusted standard errors from the block sampling<br />
method were quite close to the standard errors of the full dataset; the biggest discrepancy was 0.004 for<br />
variable X 6 and is about 15% larger. Most of the adjusted standard errors are within 10% of the standard<br />
82
error for the full dataset, and three are exactly the same. Further, where there is a discrepancy, the<br />
adjusted standard errors were slightly larger, suggesting that this is a conservative adjustment.<br />
Table Up. 2.19:<br />
Comparing Block Sampling Method with Full Database<br />
MCMC Poisson-Gamma Model<br />
Manchester Journey to Crime Dataset<br />
(Time to Complete)<br />
Dependent variable = distance traveled<br />
Full dataset<br />
Block Sampling method<br />
(N = 97,429) (n=402.8)<br />
Iterations: 100,000 100,000<br />
Burn in: 10,000 10,000<br />
Number of samples: 1 30<br />
Time to<br />
complete run: 4,855.1 minutes 222.7 minutes<br />
Adj.<br />
Std. Std. Std.<br />
Variable Coefficient Error Coefficient Error Error<br />
Intercept 0.2096 *** 0.018 0.2103 0.321 0.021<br />
X 1 0.8871 *** 0.025 1.0135 * 0.430 0.028<br />
X 2 0.3311 *** 0.018 0.3434 0.294 0.019<br />
X 3 -0.2274 *** 0.012 -0.2751 0.199 0.013<br />
X 4 -0.2820 *** 0.014 -0.3137 0.231 0.015<br />
X 5 0.2525 *** 0.016 0.3099 0.256 0.016<br />
X 6 0.3560 *** 0.027 0.3783 0.488 0.031<br />
X 7 0.0753 *** 0.013 0.1092 0.214 0.014<br />
X 8 0.1766 *** 0.021 -0.0030 0.374 0.024<br />
X 9 0.1880 *** 0.023 0.1326 0.406 0.026<br />
X 10 0.0135 n.s. 0.016 -0.0070 0.268 0.017<br />
X 11 -0.5697 *** 0.016 -0.6759 * 0.265 0.017<br />
X 12 0.0042 n.s. 0.014 0.0521 0.226 0.015<br />
X 13 -0.2214 *** 0.016 -0.2755 0.262 0.017<br />
X 14 0.0056 *** 0.001 -0.00004 0.016 0.001<br />
Error -0.7299 *** 0.008 -0.7062 *** 0.139 0.009<br />
____________<br />
Based on asymptotic t-test:<br />
n.s. Not significant<br />
* p≤.05<br />
** p≤.01<br />
*** p≤.001<br />
83
In short, the block sampling method produced reasonably close results to that of the full dataset<br />
for both the coefficients and the standard errors. Given that this model was a very complex one (with 14<br />
independent variables), the fit was good. The biggest advantage of the block sampling method, on the<br />
other hand, is the efficiency of it. The block sampling method took 222.7 minutes to run compared to<br />
4,855.1 minutes for the full dataset, an improvement of more than 20 times! Running a large dataset<br />
through the MCMC algorithm is a very time consuming process. The block sampling approach produced<br />
reasonably close results in a much shorter period of time.<br />
Statistical Testing with Block Sampling Method<br />
Regarding statistical testing of the coefficients, however, we think that the modeled standard<br />
errors (or percentiles) be used rather than the adjusted errors. The adjusted standard error is an<br />
approximation to the full dataset if that dataset had been run. In most cases, it won’t be. On the other<br />
hand, the standard errors estimated from the block sampling method and the percentile distribution were<br />
the products of running the individual samples. The errors are larger because the samples were much<br />
smaller. But, because this was the method used, statistical inferences should be based on the sample.<br />
What to do if there is a discrepancy? For some datasets, the coefficients from the block sampling<br />
method will not be significant whereas they would be if the full dataset was run. In the Manchester<br />
example above, only 3 of the coefficients were significant using the block sampling method compared to<br />
14 for the full dataset. This brings up a statistical dilemma. Does one adopt the adjusted standard errors<br />
and then re-test the coefficients using the asymptotic t-test or does one accept the estimated standard<br />
errors and the percentiles? Our opinion is to do the latter. The former is making an assumption (and a big<br />
one) that the adjusted standard errors will be a good approximation to the real ones. In these two datasets,<br />
this appears to be the case. But, we have no theoretical basis for assuming that. It has just worked out for<br />
these and a couple of other datasets that we have tested.<br />
Therefore, the choice for a researcher is to do one of three things if some of the coefficients are<br />
not significant using the block sampling method when it appears that they might be if the full dataset<br />
would be used. First, one could always run the full dataset through the MCMC algorithm. If the dataset<br />
is large, then it will take a long time to calculate. But, if it is important, then the user should do that.<br />
Note that it will be possible to do this only for the Poisson-Gamma model and not for the Poisson-<br />
Gamma-CAR spatial model.<br />
Second, the researcher could try to tweak the MCMC algorithm to increase the likelihood of<br />
finding statistical significance for the coefficients increasing the number of iterations to improve the<br />
precision of the estimate and by increasing the average sample size of the block sample. If 400 samples<br />
were not sufficient, perhaps 600 would be? In doing this, the efficiency advantage of the block sampling<br />
method becomes less important compared to improving the accuracy of the estimates.<br />
Third, the researcher can accept the results of the block sampling method and ‘live’ with the<br />
conclusions. If one or more variables was not significant using the block sampling method (which, after<br />
all, was based on 20 to 30 samples of around 400 records each), then the variables are probably not<br />
important. In other words, running the MCMC algorithm on the full dataset or increasing the sample size<br />
84
of the block samples may find statistical significance in one or more variables. But, the chances are that<br />
the variables are not very important, from a statistical perspective. They may be significantly different<br />
than 0, but probably not very important. In our experience, the strongest variables are significant with the<br />
block sampling scheme. Perhaps the researcher or analyst should focus on those and build a model<br />
around them, rather than scouring for other variables that have very small effect? In short, our opinion is<br />
that a smaller, but more robust, model is better than a larger, more volatile one. In terms of<br />
understanding, the major variables need to be isolated because they contribute the most to the<br />
development of theory. In terms of prediction, also the strongest variables will have the biggest impact.<br />
Elegance in a model should be the aim, not a comprehensive list of variables that might be important but<br />
probably are not.<br />
The <strong>CrimeStat</strong> Regression Module<br />
We now describe the <strong>CrimeStat</strong> regression module. 6 There are two pages in the module. The<br />
Regression I page allows the testing of a model while the Regression II page allows a prediction to be<br />
made based on an already-estimated model. Figure Up. 2.10 displays the Regression I page.<br />
In the current version, six possible regression models are available with several options for each<br />
of these:<br />
Normal (OLS)<br />
MLE Poisson<br />
MLE Poisson with linear dispersion correction (NB1)<br />
MLE Poisson-Gamma<br />
MCMC Poisson-Gamma<br />
MCMC Poisson-Gamma-CAR<br />
There are several sections to the page that define these models.<br />
Input Data Set<br />
The data set for the regression module is the Primary File data set. The coordinate system and<br />
distance units are also the same. The routine will not work unless the Primary File has X/Y coordinates.<br />
Dependent Variable<br />
To start loading the module, click on the ‘Calibrate model’ tab. A list of variables from the<br />
Primary File is displayed. There is a box for defining the dependent variable. The user must choose one<br />
6<br />
The code for the Linear, Poisson, and MLE Poisson-Gamma functions came from the MLE++ package of routines<br />
developed by Ian Cahill of Cahill Software, Ottawa, Ontario. We have added additional summary statistics,<br />
significance tests, tolerance estimates and stepwise procedures to this package. The code for the MCMC routines was<br />
developed by us under instructions from Dr. Shaw-pin Miaou of College Station, TX. The programming was<br />
conducted by Ms. Haiyan Teng of Houston, TX. We thank these individuals for their contributions.<br />
85
Figure Up. 2.10:<br />
Regression I Setup Page
dependent variable. A keystroke trick is to click on the first letter of the variable that will be the<br />
dependent variable and the routine will go to the first variable with that letter.<br />
Independent Variables<br />
There is another box for defining the independent variables. The user must choose one or more<br />
independent variables. In the routine, there is no limit to the number. Keep in mind that the variables are<br />
output in the same order as specified in the dialogue so a user might want to think how these should be<br />
displayed.<br />
Type of Dependent Variable<br />
There are five options that must be defined. The first is the type of dependent variable: Normal<br />
(OLS) or Skewed (Poisson). The default is a Poisson. At this point, these are the only choices that are<br />
available though we will be adding a binomial and multinomial choice soon.<br />
Type of Dispersion Estimate<br />
The second option that must be defined is the type of dispersion estimate to be used. The choices<br />
are Gamma, Poisson, Poisson with linear correction (NB1), and Normal (automatically defined for the<br />
OLS model). The default is Gamma. Soon, we will be adding a log linear and possibly another<br />
dispersion parameter to the routine.<br />
Type of Estimation Method<br />
The third option is the type of estimation method to be used: Maximum Likelihood (MLE) or<br />
Markov Chain Monte Carlo (MCMC). The default is MLE. These methods were discussed above and in<br />
appendices C and D.<br />
Spatial Autocorrelation Estimate<br />
Fourth, if the user accepts an MCMC algorithm, then another choice is whether to run a spatial<br />
autocorrelation estimate along with it (a Conditional Autoregressive function, or CAR). This can only be<br />
run if the dependent variable is Poisson and the dispersion parameter is Gamma. If the spatial<br />
autocorrelation estimate is run, then the model becomes a Poisson-Gamma-CAR while if the spatial<br />
autocorrelation estimate is not run the model remains a Poisson-Gamma.<br />
Type of Test Procedure<br />
The fifth, and last option, is whether to run a fixed model or a backward elimination stepwise<br />
procedure (only with the normal or an MLE Poisson model). With a fixed model, the total model is<br />
estimated and the coefficients for each of the variables are estimated at the same time. With the backward<br />
elimination stepwise procedure, all the variables in the model initially but are removed one at a time,<br />
based on the probability level for remaining in the model.<br />
87
If the fixed model is chosen, then all independent variables will be regressed simultaneously.<br />
However, if the stepwise backward elimination procedure is selected, the user must define a p-to-remove<br />
value. The choices are: 0.1, 0.05, 0.01, and 0.001. The default is 0.01. Traditionally, 0.05 is used as a<br />
minimal threshold for significance. We put in 0.01 to make the model stricter; with the large datasets that<br />
typically occur in police departments, the less strict 0.05 criterion would not exclude many independent<br />
variables. But, the user can certainly use 0.05 instead.<br />
MCMC Choices<br />
If the user chooses the MCMC algorithm to estimate either a Poisson-Gamma or a Poisson-<br />
Gamma-CAR model, then several decisions have to be made.<br />
Number of Iterations<br />
Specify the number of iterations to be run. The default is 25,000. The number should be<br />
sufficient to produce reliable estimates of the parameters. Check the MC Error/Standard deviation ratio<br />
and the G-R statistic to be sure these are below 1.05 and 1.20 respectively.<br />
‘Burn in’ Iterations<br />
Specify the number of initial iterations that will be dropped from the final distribution (the ‘burn<br />
in’ period). The default is 5,000. The number of ‘burn in’ iterations should be sufficient for the<br />
algorithm to reach an equilibrium state and produce reliable estimates of the parameters. Check the MC<br />
Error/Standard deviation ratio and the G-R statistic to be sure these are below 1.05 and 1.20 respectively.<br />
Block Sampling Threshold<br />
The MCMC algorithm will be run on all cases unless the number of records exceeds the number<br />
specified in the block sampling threshold. The default is 6,000 cases. Note that if you run the MCMC for<br />
more cases than this, calculating time will increase substantially. For the non-spatial Poisson-Gamma<br />
model, the increase is linear. However, for the spatial Poisson-Gamma model, the increase is exponential.<br />
Further, we have found that we cannot calculate the spatial model for more than about 6,000 cases.<br />
Average Block Size<br />
Specify the number of cases to be drawn in each block sample. The default is 400 cases. Note<br />
that this is an average. Actual samples will vary in size. The output will display the expected sample size<br />
and the average sample size that was drawn.<br />
Number of Samples Drawn<br />
Specify the number of samples to be drawn. The default is 25. We have found that reliable<br />
estimates can be obtained from 20 to 30 samples especially if the sequence converges quickly and even<br />
88
10 samples can produce meaningful results. Obviously, the more samples that are drawn, the more<br />
reliable will be the final results. But, having more samples will not necessarily increase the precision<br />
beyond 30.<br />
Calculate Intercept<br />
The model can be run with or without an intercept (constant). The default is with an intercept<br />
estimated. To run the model without the intercept, uncheck the ‘Calculate intercept’ box.<br />
Calculate Exposure/Offset<br />
If the model is a risk or rate model (see equations Up. 2.74 through Up. 2.78), then an exposure<br />
(offset) variable needs to be defined. Check the ‘Calculate exposure/offset’ box and identify the variable<br />
that will be used as the exposure variable. The coefficient for this variable will automatically be 1.0.<br />
Advanced Options<br />
There is also a set of advanced options for the MCMC algorithm. Figure Up. 2.11 show the<br />
advanced options dialogue. We would suggest keeping the default values initially until you become very<br />
familiar with the routine.<br />
Initial Parameters Values<br />
The MCMC algorithm requires an initial estimate for each parameter. There are default values<br />
that are used. For the beta coefficients (including the intercept), the default values are 0. This assumes<br />
that the coefficient is ‘not significant’ and is frequently called a ‘non-informative’ prior. These are<br />
displayed as a blank screen for the Beta box. However, estimates of the beta coefficients can be<br />
substituted for the assumed 0 coefficients. To do this, all independent variable coefficients plus the<br />
intercept (if used) must be listed in the order in which they appear in the model and must be separated by<br />
commas. Do not include the beta coefficients for the spatial autocorrelation, Φ, term (if used).<br />
For example, suppose there are three independent variables. Thus, the model will have four<br />
coefficients (the intercept and the coefficients for each of three independent variables). Suppose a prior<br />
study had been done in which a Poisson-Gamma model was estimated as:<br />
Y = e 4.5 + 0.3 X1 – 2.1X2 + 3.4X3 (Up. 2.80)<br />
The researcher wants to repeat this model but with a different data set. The researcher assumes that the<br />
model using the new data set will have coefficients similar to the earlier research. Thus, the following<br />
would be specified in the box for the betas under the advanced options:<br />
4.5, 0.3, -2.1, 3.4 (Up. 2.81)<br />
89
Figure Up. 2.11:<br />
Advanced Options for MCMC Poisson-Gamma-CAR Model
The routine will then use these values for the initial estimates of the parameters before starting the<br />
MCMC process (with or without the block sampling method). The advantage is that the distribution will<br />
converge more quickly (assuming the model is appropriate for the new data set).<br />
Rho (ρ) and Tauphi (τ ϕ )<br />
The spatial autocorrelation component, Φ, is made up of three separate sub-components, called<br />
Rho (ρ), Tauphi (τ ϕ ), and Alpha (α, see formulas Up. 2.70 – Up. 2.72). These are additive. Rho is<br />
roughly a global component that applies to the entire data set. Tauphi is roughly a neighborhood<br />
component that applies to a sub-set of the data. Alpha is essentially a localized effect. The routine works<br />
by estimating values for Rho and Tauphi but uses a pre-defined value for Alpha. The default initial<br />
values for Rho and Tauphi are 0.5 and 1 respectively. The user can substitute alternative values for these<br />
parameters.<br />
Alpha(α)<br />
Alpha (α) is the exponent for the distance decay function in the spatial model. Essentially, the<br />
distance decay function defines the weight to be applied to the values of nearby records. The weight can<br />
be defined by one of three mathematical functions. First, the weight can be defined by a negative<br />
exponential function where<br />
Weight = e –α*d(ij) (Up. 2.82)<br />
where d(ij) is the distance between observations and α is the value for alpha. It is automatically assumed<br />
that alpha will be negative whether the user puts in a minus sign or not. The user inputs the alpha value in<br />
this box.<br />
Second, the weight can be defined by a restricted negative exponential whereby the negative<br />
exponential operates up to the specified search distance, whereupon the weight becomes 0 for greater<br />
distances<br />
Up to Search distance: Weight = e –α*d(ij) for d(ij) ≥ 0, d(ij)≤ d p (Up. 2.83)<br />
Beyond search distance: 0 for d(ij) > d p (Up. 2.84)<br />
where d p is the search distance. The coefficient for the linear component is assumed to be 1.0.<br />
Third, the weight can be defined as a uniform value for all other observations within a specified<br />
search distance. This is a contiguity (or adjacency) measure. Essentially, all other observations have an<br />
equal weight within the search distance and 0 if they are greater than the search distance. The user inputs<br />
the search distance and units in this box.<br />
For the negative exponential and restricted negative exponential functions, substitute the selected<br />
value for α in the alpha box.<br />
91
Diagnostic Test for Reasonable Alpha Value<br />
The default function for the weight is a negative exponential with a default alpha value of -1 in<br />
miles. For many data sets, this will be a reasonable value. However, for other data sets, it will not.<br />
Reasonable values for alpha with the negative exponential function are obtained with the<br />
following procedure:<br />
1. Decide on the measurement units to be used to calculate alpha (miles, kilometers, feet, etc).<br />
The default is miles. <strong>CrimeStat</strong> will convert from the units defined for the Primary File input<br />
dataset to those specified by the user.<br />
2. Calculate the nearest neighbor distance from the Nna routine on the Distance Analysis I page.<br />
These may have to be converted into units that were selected in step 1 above. For example, if<br />
the Nearest Neighbor distance is listed as 2000 feet, but the desired units for alpha are miles,<br />
convert 2000 feet to miles by dividing the 2000 by 5280.<br />
3. Input the dependent variable as the Z (intensity) variable on the Primary File page.<br />
4. Run the Moran Correlogram routine on this variable on the Spatial Autocorrelation page<br />
(under Spatial Description). By looking at the values and the graph, decide whether the<br />
distance decay in this variable is very ‘sharp’ (drops off quickly) or very ‘shallow’ (drops off<br />
slowly).<br />
5. Define the appropriate weight for the nearest neighbor distance:<br />
a. Assume that the weight for an observation with itself (i.e., distance = 0) is 1.0.<br />
b. If the distance decay drops off sharply, then a low weight for nearby values should be<br />
given. Assume that any observations at the nearest neighbor distance will only have<br />
a weight of 0.5 with observations further away being even lower.<br />
c. If the distance decay drops off more slowly, then a higher weight for nearby values<br />
should be given. Assume that any observations at the nearest neighbor distance will<br />
have a weight of 0.9 with observations further away being lower but only slightly so.<br />
d. An intermediate value for the weight is to assume it to be 0.75.<br />
6. A range of alpha values can be solved using these scenarios:<br />
a. For the sharp decay, alpha is given by:<br />
α = ln(0.5)/NN(distance) (Up. 2.85)<br />
92
where NN(distance) is the nearest neighbor distance.<br />
b. For the shallow distance decay, alpha is given by:<br />
α = ln(0.9)/NN(distance) (Up. 2.86)<br />
where NN(distance) is the nearest neighbor distance.<br />
c. For the intermediate decay, alpha is given by:<br />
α = ln(0.75)/NN(distance) (Up. 2.87)<br />
where NN(distance) is the nearest neighbor distance.<br />
These calculations will provide a range of appropriate values for α. The diagnostics routine<br />
automatically estimates these values as part of its output.<br />
Value for 0 Distances Between Records<br />
The advanced options dialogue has a parameter for the minimum distance to be assumed between<br />
different records. If two records have the same X and Y coordinates (which could happen if the data are<br />
individual events, for example), then the distance between these records will be 0. This could cause<br />
unusual calculations in estimating spatial effects. Instead, it is more reliable to assume a slight difference<br />
in distance between all records. The default is 0.005 miles but the user can modify this (including<br />
substituting 0 for the minimal distance).<br />
Output<br />
The output depends on whether an MLE or an MCMC model has been run.<br />
Maximum Likelihood (MLE) Model Output<br />
The MLE routines (Normal, Poisson, Poisson with linear correction, MLE Poisson-Gamma)<br />
produce a standard output which includes summary statistics and estimates for the individual coefficients.<br />
MLE Summary Statistics<br />
The summary statistics include:<br />
Information About the Model<br />
1. The dependent variable<br />
2. The number of cases<br />
3. The degrees of freedom (N – number of parameters estimated)<br />
93
4. The type of regression model (Normal (OLS), Poisson, Poisson with linear correction,<br />
Poisson-Gamma)<br />
5. The method of estimation (MLE)<br />
Likelihood Statistics<br />
6. Log likelihood estimate, which is a negative number. For a set number of independent<br />
variables, the more negative the log likelihood the better.<br />
7. Akaike Information Criterion (AIC) adjusts the log likelihood for the degrees of freedom.<br />
The smaller the AIC, the better.<br />
8. Bayesian Information Criterion (BIC), sometimes known as the Schwartz Criterion (SC),<br />
adjusts the log likelihood for the degrees of freedom. The smaller the BIC, the better.<br />
9. Deviance compares the log likelihood of the model to the log likelihood of a model that<br />
fits the data perfectly. A smaller deviance is better.<br />
10. The probability value of the deviance based on a Chi-square with k-1 degrees of freedom.<br />
11. Pearson Chi-square is a test of how closely the predicted model fits the data. A smaller<br />
Chi-square is better since it indicates the model fits the data well.<br />
Model Error Estimates<br />
12. Mean Absolute Deviation (MAD). For a set number of independent variables, a smaller<br />
MAD is better.<br />
13. Quartiles for the Mean Absolute Deviation. For any one quartile, smaller is better.<br />
14. Mean Squared Predictive Error (MSPE). For a set number of independent variables, a<br />
smaller MSPE is better.<br />
15. Quartiles for the Mean Squared Predictive Error. For any one quartile, smaller is better.<br />
16. Squared multiple R (for linear model only). This is the percentage of the dependent<br />
variable accounted for by the independent variables.<br />
17. Adjusted squared multiple R (for linear model only). This is the squared multiple R<br />
adjusted for degrees of freedom.<br />
Over-dispersion Tests<br />
18. Adjusted deviance. This is a measure of the difference between the observed and<br />
predicted values (the residual error) adjusted for degrees of freedom. The smaller the<br />
adjusted deviance, the better. A value greater than 1 indicates over-dispersion.<br />
19. Adjusted Pearson Chi-square. This is the Pearson Chi-square adjusted for degrees of<br />
freedom. The smaller the Pearson Chi-square, the better. A value greater than 1 indicates<br />
over-dispersion.<br />
20. Dispersion multiplier. This is the ratio of the expected variance to the expected mean.<br />
For a set number of independent variables, the smaller the dispersion multiplier, the<br />
better. In a pure Poisson distribution, the dispersion should be 1.0. In practice, a ratio<br />
greater than 10 indicates that there is too much variation that is unaccounted for in the<br />
model. Either add more variables or change the functional form of the model.<br />
94
21. Inverse dispersion multiplier. For a set number of independent variables, a larger inverse<br />
dispersion multiplier is better. A ratio close to 1.0 is considered good.<br />
MLE Individual Coefficient Statistics<br />
For the individual coefficients, the following are output:<br />
22. The coefficient. This is the estimated value of the coefficient from the maximum likelihood<br />
estimate.<br />
23. Standard Error. This is the estimated standard error from the maximum likelihood estimate.<br />
24. Pseudo-tolerance. This is the tolerance value based on a normal prediction of the variable by<br />
the other independent variables. See equation Up. 2.18.<br />
25. Z-value. This is asymptotic Z-test that is defined based on the coefficient and standard error.<br />
It is defined as Coefficient/Standard Error.<br />
26. p-value. This is the two-tail probability level associated with the Z-test.<br />
Markov Chain Monte Carlo (MCMC) Model Output<br />
The MCMC routines (MCMC Poisson-Gamma, Poisson-Gamma-CAR) produce a standard<br />
output and an optional expanded output. The standard output includes summary statistics and estimates<br />
for the individual coefficients.<br />
MCMC Summary Statistics<br />
The summary statistics include:<br />
Information About the Model<br />
1. The dependent variable<br />
2. The number of records<br />
3. The sample number. This is only output when the block sampling method is used.<br />
4. The number of cases for the sample. This is only output when the block sampling<br />
method is used.<br />
5. Date and time for sample. This is only output when the block sampling method is used<br />
6. The degrees of freedom (N – number of parameters estimated)<br />
7. The type of regression model (Linear, Poisson, Poisson with linear correction, Poisson-<br />
Gamma, Poisson-Gamma-CAR)<br />
8. The method of estimation<br />
9. The number of iterations<br />
10. The ‘burn in’ period<br />
11. The distance decay function used for a Poisson-Gamma-CAR model. This is output with<br />
the Poisson-Gamma-CAR model only.<br />
12. The block size is the expected number of records selected for each block sample. The<br />
actual number may vary.<br />
95
13. The number of samples drawn. This is output when the block sampling method used.<br />
14. The average block size. This is output when the block sampling method used.<br />
15. The type of distance decay function. This is output for the Poisson-Gamma-CAR model<br />
only.<br />
16. Condition number for the distance matrix. If the condition number is large, then the<br />
model may not have properly converged. This is output for the Poisson-Gamma-CAR<br />
model only.<br />
17. Condition number for the inverse distance matrix. If the condition number is large, then<br />
the model may not have properly converged. This is output for the Poisson-Gamma-<br />
CAR model only.<br />
Likelihood Statistics<br />
18. Log likelihood estimate, which is a negative number. For a set number of independent<br />
variables, the smaller the log likelihood (i.e., the most negative) the better.<br />
19. Deviance Information Criterion (DIC) adjusts the log likelihood for the effective degrees<br />
of freedom. The smaller the DIC, the better.<br />
20. Akaike Information Criterion (AIC) adjusts the log likelihood for the degrees of freedom.<br />
The smaller the AIC, the better.<br />
21. Bayesian Information Criterion (BIC), sometimes known as the Schwartz Criterion (SC),<br />
adjusts the log likelihood for the degrees of freedom. The smaller the BIC, the better.<br />
22. Deviance compares the log likelihood of the model to the log likelihood of a model that<br />
fits the data perfectly. A smaller deviance is better.<br />
23. The probability value of the deviance based on a Chi-square with k-1 degrees of freedom.<br />
24. Pearson Chi-square is a test of how closely the predicted model fits the data. A smaller<br />
Chi-square is better since it indicates the model fits the data well.<br />
Model Error Estimates<br />
25. Mean Absolute Deviation (MAD). For a set number of independent variables, a smaller<br />
MAD is better.<br />
26. Quartiles for the Mean Absolute Deviation. For any one quartile, smaller is better.<br />
27. Mean Squared Predictive Error (MSPE). For a set number of independent variables, a<br />
smaller MSPE is better.<br />
28. Quartiles for the Mean Squared Predictive Error. For any one quartile, smaller is better.<br />
Over-dispersion Tests<br />
29. Adjusted deviance. This is a measure of the difference between the observed and<br />
predicted values (the residual error) adjusted for degrees of freedom. The smaller the<br />
adjusted deviance, the better. A value greater than 1 indicates over-dispersion.<br />
30. Adjusted Pearson Chi-square. This is the Pearson Chi-square adjusted for degrees of<br />
freedom. The smaller the Pearson Chi-square, the better. A value greater than 1 indicates<br />
over-dispersion.<br />
96
31. Dispersion multiplier. This is the ratio of the expected variance to the expected mean.<br />
For a set number of independent variables, the smaller the dispersion multiplier, the<br />
better. In a pure Poisson distribution, the dispersion should be 1.0. In practice, a ratio<br />
greater than 10 indicates that there is too much variation that is unaccounted for in the<br />
model. Either add more variables or change the functional form of the model.<br />
32. Inverse dispersion multiplier. For a set number of independent variables, a larger inverse<br />
dispersion multiplier is better. A ratio close to 1.0 is considered good.<br />
MCMC Individual Coefficient Statistics<br />
For the individual coefficients, the following are output:<br />
33. The mean coefficient. This is the mean parameter value for the N-k iterations where k is<br />
the ‘burn in’ samples that are discarded. With the MCMC block sampling method, this is<br />
the mean of the mean coefficients for all block samples.<br />
34. The standard deviation of the coefficient. This is an estimate of the standard error of the<br />
parameter for the N-k iterations where k is the ‘burn in’ samples that are discarded. With<br />
the MCMC block sampling method, this is the mean of the standard deviations for all<br />
block samples.<br />
35. t-value. This is the t-value based on the mean coefficient and the standard deviation. It is<br />
defined by Mean/Std.<br />
36. p-value. This is the two-tail probability level associated with the t-test.<br />
37. Adjusted standard error (Adj. Std). The block sampling method will produce substantial<br />
variation in the mean standard deviation, which is used to estimate the standard error.<br />
Consequently, the standard error will be too large. An approximation is made by<br />
multiplying the estimated standard deviation by where n is the average sample size<br />
N<br />
of the block samples and N is the number of records. If no block samples are taken, then<br />
this statistic is not calculated.<br />
38. Adjusted t-value. This is the t-value based on the mean coefficient and the adjusted<br />
standard deviation. It is defined by Mean/Adj_Std. If no block samples are taken, then<br />
this statistic is not calculated.<br />
39. Adjusted p-value. This is the two-tail probability level associated with the adjusted t-<br />
value. If no block samples are taken, then this statistic is not calculated.<br />
40. MC error is a Monte Carlo simulation error. It is a comparison of the means of m<br />
individual chains relative to the mean of the entire chain. By itself, it has little meaning.<br />
41. MC error/Std is the MC error divided by the standard deviation. If this ratio is less than<br />
.05, then it is a good indicator that the posterior distribution has converged.<br />
42. G-R stat is the Gelman-Rubin statistic which compares the variance of m individual<br />
chains relative to the variance of the entire chain. If the G-R statistic is under 1.2, then<br />
the posterior distribution is commonly considered to have converged.<br />
n <br />
97
43. Spatial autocorrelation term (Phi, ϕ) for Poisson-Gamma-CAR models only. This is the<br />
estimate of the fixed effect spatial autocorrelation effect. It is made up of three<br />
components: a global component (Rho, ρ); a local component (Tauphi, τ φ ); and a local<br />
neighborhood component (Alpha, α, which is defined by the user).<br />
44. The log of the error in the model (Taupsi). This is an estimate of the unexplained<br />
variance remaining. Taupsi is the exponent of the dispersion multiplier, e τψ . For any<br />
fixed number of independent variables, the smaller the Taupsi, the better.<br />
Expanded Output (MCMC Only)<br />
If the expanded output box is selected, additional information on the percentiles from the MCMC<br />
sample are displayed. If the block sampling method is used, the percentiles are the means of all block<br />
samples. The percentiles are:<br />
45. 2.5 th percentile<br />
46. 5 th percentile<br />
47. 10 th percentile<br />
48. 25 th percentile<br />
49. 50 th percentile (median)<br />
50. 75 TH percentile<br />
51. 90 th percentile<br />
52. 95 th percentile<br />
53. 97.5 th percentile<br />
The percentiles can be used to construct confidence intervals around the mean estimates or to<br />
provide a non-parametric estimate of significance as an alternative to the estimated t-value in the standard<br />
output. For example, the 2.5 th and 97.5 th percentiles provide approximate 95 percent confidence intervals<br />
around the mean coefficient while the 0.5 th and 99.5 th percentiles provide approximate 99 percent<br />
confidence intervals.<br />
The percentiles will be output for all estimated parameters including the intercept, each individual<br />
predictor variable, the spatial effects variable (Phi), the estimated components of the spatial effects (Rho<br />
and Tauphi), and the overall error term (Taupsi).<br />
Output Phi Values (Poisson-Gamma-CAR Model Only)<br />
For the Poisson-Gamma-CAR model only, the individual Phi values can be output. This will<br />
occur if the sample size is smaller than the block sampling threshold. Check the ‘Output Phi value if<br />
sample size smaller than block sampling threshold’ box. An ID variable must be identified and a DBF<br />
output file defined.<br />
98
Save Output<br />
The predicted values and the residual errors can be output to a DBF file with a REGOUT file name where rootname is the name specified by the user. The output is saved as a ‘dbf’ file<br />
under a different file name. The output includes all the variables in the input data set plus two new ones:<br />
1) the predicted values of the dependent variable for each observation (with the field name<br />
PREDICTED); and 2) the residual error values, representing the difference between the actual /observed<br />
values for each observation and the predicted values (with the field name RESIDUAL). The file can be<br />
imported into a spreadsheet or graphics program and the errors plotted against the predicted dependent<br />
variable (similar to figure Up. 2.3).<br />
Save Estimated Coefficients<br />
The individual coefficients can be output to a DBF file with a REGCOEFF file<br />
name where rootname is the name specified by the user. This file can be used in the ‘Make Prediction’<br />
routine under Regression II.<br />
Diagnostic Tests<br />
The regression module has a set of diagnostic tests for evaluating the characteristics of the data<br />
and the most appropriate model to use. There is a diagnostics box on the Regression I page (see figure<br />
Up. 2.10). Diagnostics are provided on:<br />
1. The minimum and maximum values for the dependent and independent variables<br />
2. Skewness in the dependent variable<br />
3. Spatial autocorrelation in the dependent variable<br />
4. Estimated values for the distance decay parameter – alpha, for use in the Poisson-Gamma-<br />
CAR model<br />
5. Multicolinarity among the independent variables<br />
Minimum and Maximum Values for the Variables<br />
The minimum and maximum values of both the dependent and independent variables are listed.<br />
A user should look for ineligible values (e.g., -1) as well as variables that have a very high range. The<br />
MLE routines are sensitive to variables with very large ranges. To minimize the effect, variables are<br />
internally scaled when being run (by dividing by their mean) and then re-scaled for output. Nevertheless,<br />
variables with extreme ranges in values and especially variables where there are a few observations with<br />
extreme values can distort the results for models. 7 A user would be better choosing a more balanced<br />
variable than using one where one or two observations determines the relationship with the dependent<br />
variable.<br />
7<br />
For example, in Excel, two columns of random numbers from 1 to 10 were listed in 99 rows to represent two variables<br />
X1 and X2. The correlation between these two variables over the 99 rows (observations) was -0.03. An additional row<br />
was added and the two variables given a value of 100 each for this row. Now, the correlation between these two<br />
variables increased to 0.89! The point is, one or two extreme values can distort a statistical relationship.<br />
99
Skewness Tests<br />
As we have discussed, skewness in a variable can distort a normal model by allowing high values<br />
to be underestimated while allowing low values to be overestimated. For this reason, a Poisson-type<br />
model is preferred over the normal for highly skewed variables.<br />
The diagnostics utility tests for skewness using two different measures. First, the utility outputs<br />
the “g” statistic (Microsoft, 2003):<br />
g<br />
n<br />
<br />
3<br />
[( X<br />
i<br />
X ) / s]<br />
( n 1)(<br />
n 2)<br />
(Up. 2.88)<br />
i<br />
where n is the sample size, X i is observation i, X is the mean of X, and s is the sample standard deviation<br />
(corrected for degrees of freedom). The sample standard deviation is defined as:<br />
s <br />
<br />
i<br />
<br />
( X<br />
i<br />
X )<br />
( n 1)<br />
2<br />
(Up. 2.89)<br />
The standard error of skewness (SES) can be approximated by (Tabachnick and Fidell, 1996):<br />
SES<br />
6<br />
(Up. 2.90)<br />
n<br />
An approximate Z-test can be obtained from:<br />
g<br />
Z( g)<br />
<br />
(Up. 2.91)<br />
SES<br />
Thus, if Z is greater than +1.96 or smaller than -1.96, then the skewness is significant at the p≤.05 level.<br />
An example is the number of crimes originating in each traffic analysis zone within Baltimore<br />
County in 1996. The summary statistics were:<br />
<br />
X = 75.108<br />
s = 96.017<br />
n = 325<br />
Therefore,<br />
<br />
i<br />
3<br />
[( X<br />
i<br />
X ) / s]<br />
898.391<br />
<br />
100
325<br />
g *898.391 <br />
324*323<br />
2.79<br />
SES<br />
<br />
6 <br />
325<br />
0.136<br />
2.79<br />
Z ( g)<br />
20.51<br />
0.136<br />
The Z of the g value shows the data are highly skewed.<br />
The second skewness measure is a ratio of the simple variance to the simple mean. While this<br />
ratio had not been adjusted for any predictor variables, it is usually a good indicator of skewness. Ratios<br />
greater than about 2:1 should make the user cautious about using a normal model.<br />
If either measure indicates skewness, <strong>CrimeStat</strong> prints out a message indicating the dependent<br />
variable appears to be skewed and that a Poisson or Poisson-Gamma model should be used.<br />
Testing for Spatial Autocorrelation in the Dependent Variable<br />
The third type of test in the diagnostics utilities is the Moran’s “I” coefficient for spatial<br />
autocorrelation. The statistic was discussed extensively in chapter 4. If the “I” is significant, <strong>CrimeStat</strong><br />
outputs a message indicating that there is definite spatial autocorrelation in the dependent variable and<br />
that it needs to be accounted for, either by a proxy variable or by estimating a Poisson-Gamma-CAR<br />
model.<br />
A proxy variable would be one that can capture a substantial amount of the primary reason for the<br />
spatial autocorrelation. One such variable that we have found to be very useful is the distance of the<br />
location from the metropolitan center (e.g., downtown). Almost always, population densities are much<br />
higher in the central city than in the suburbs, and this differential in density applies to most phenomena<br />
including crime (e.g., population density, employment density, traffic density, events of all types). It<br />
represents a first-order spatial effect, which was discussed in chapters 4 and 5 and is the result of other<br />
processes. Another proxy variable that can be used is income (e.g., median household income, median<br />
individual income) which tends to account for much clustering in an urban area. The problem with<br />
income as a proxy variable is that it is both causative (income determines spatial location) as well as a byproduct<br />
of population densities. The combination of both income and distance from the metropolitan<br />
center can capture most of the effect of spatial autocorrelation.<br />
An alternative is to use the Poisson-Gamma-CAR model to filter out some of the spatial<br />
autocorrelation. As we discussed above, this is useful only when all obvious spatial effects have already<br />
been incorporated into the model. A significant spatial effect only means that the model cannot explain<br />
the additional clustering of the dependent variable.<br />
101
Estimating the Value of Alpha (α) for the Poisson-Gamma-CAR Model<br />
The fourth type of test produced by the diagnostics utility is an estimate of a plausible value for<br />
the distance decay function alpha, α, in the Poisson-Gamma-CAR model. The way the estimate is<br />
produced was discussed above and is based on assigning a proportional weight for the distance associated<br />
with the nearest neighbor distance, the average distance from each observation to its nearest ‘neighbor’<br />
(see chapter 6).<br />
Three values of α are given in different distance units, one associated with a weight of 0.9<br />
( a very steep distance decay, one associated with a weight of 0.75 (a moderate distance decay), and one<br />
associated with a weight of 0.5 (a shallow distance decay). Users should run the Moran Correlogram and<br />
examine the gra ph of the drop off in spatial autocorrelation to assess what type of decay function most<br />
likely exists. The user should choose an α value that best represents the distance decay and should define<br />
the distance units for it.<br />
Multicollinearity Tests<br />
The fifth type of diagnostic test is for multicollinearity among the independent predictors. As we<br />
have discussed in this chapter, one of the major problems with many regression models, whether MLE or<br />
MCMC, is multicollinearity among the independent variables.<br />
To assess multicollinearity, the pseudo-tolerance test is presented for each independent variable.<br />
This was discussed above in the chapter (see equation Up. 2.18).<br />
Likelihood Ratios<br />
One test that we have not implemented in the regression I module is the likelihood ratio because<br />
it is so simple. A likelihood ratio is the ratio of the log likelihood of one model to that of another. For<br />
example, a Poisson-Gamma model run with three independent variables can be compared with a Poisson-<br />
Gamma model with two independent variables to see if the third independent variable significantly adds<br />
to the prediction.<br />
The test is very simple. Let L C be the log likelihood of the comparison model and let L B be the<br />
log likelihood of the baseline model (the model to which the comparison model is being compared).<br />
Then,<br />
LR = 2(L C – L B ) (Up. 2.92)<br />
2<br />
LR is distributed as a statistic with K degrees of freedom where K is the difference in the number of<br />
parameters estimated between the two models including the intercepts. In the example above, K is 1 since<br />
a model with three independent variables plus an intercept (d.f. = 4) is being compared with a model with<br />
two independent variables plus an intercept (d.f.=3).<br />
102
Regression II Module<br />
The Regression II module allows the user to apply a model to another dataset and make a<br />
prediction. Figure Up. 2.12 show the Regression II setup page. The ‘Make prediction’ routine allows the<br />
application of coefficients to a dataset.<br />
Note that, in this case, the coefficients are being applied to a different Primary File than that from<br />
which they were calculated. For example, a model might be calculated that predicts robberies for 2006.<br />
The saved coefficient file then is applied to another dataset, for example robberies for 2007.<br />
There are two types of models that are fitted – normal and Poisson. For the normal model, the<br />
routine fits the equation:<br />
Y = β 0 + β 1 X 1 + ……..+ β k X k (Up. 2.93)<br />
whereas for the Poisson model, the routine fits the equation:<br />
E(Y i / X ki ) = λ i = e β0 + β1X1 + ……..+ βkXk + [Φ] (Up. 2.94)<br />
with β 0 being the intercepted (if calculated), β 1 …. β k being the saved coefficients and Φ i is the saved Phi<br />
values (if the Poisson-Gamma-CAR model was estimated). Notice that there is no error in each equation.<br />
Error was part of the estimation model. What were saved was only the coefficients.<br />
For both types of model, the coefficients file must include information on the intercept and each<br />
of the coefficients. The user reads in the saved coefficient file and matches the variables to those in the<br />
new dataset based on the order of the coefficients file.<br />
If the model had estimated a general spatial effect from a Poisson-Gamma-CAR model, then the<br />
general Φ will have been saved with the coefficient files. If the model had estimated specific spatial<br />
effects from a Poisson-Gamma-CAR model, then the specific Φ i values will have been saved in a separate<br />
Phi coefficients file. In the latter case, the user must read in the Phi coefficients file along with the<br />
general coefficient file.<br />
103
Figure Up. 2.12:<br />
Regression II Setup Page
References<br />
Abraham, Bovas & Johannes Ledolter (2006). Introduction to Regression Modeling. Thompson<br />
Brooks/Cole: Belmont, CA.<br />
Anselin, L. (2002). “Under the hood: Issues in the specification ad interpretation of spatial regression<br />
models”, Agricultural Economics, 17(3), 247-267.<br />
Berk, Kenneth N. (1977). “Tolerance and condition in regression computations”, Journal of the<br />
American Statistical Association, 72 (360), 863-866.<br />
Besag, J., P. Green, D. Higdon, & K. Mengersen (1995). “Bayesian computation and stochastic systems<br />
(with discussion)”, Statistical Science, 10, 3-66.<br />
Bishop, Y. M. M., S. E. Feinberg, & P. W. Holland (1975). Discrete Multivariate Analysis: Theory and<br />
Practice. MIT Press: Cambridge, MA.<br />
Boswell, M. T. & G.P. Patil, (1970). “Chance mechanisms generating negative binomial<br />
distributions”. In Random Counts in Scientific Work, Vol. 1, G. P. Patil, ed., Pennsylvania State<br />
University Press:University Park, PA, 3-22.<br />
BUGS (2008). The BUGS (Bayesian Inference Using Gibbs Sampling) Project. MRC Biostatistics Unit,<br />
University of Cambridge: Cambridge. http://www.mrc-bsu.cam.ac.uk/bugs/. Accessed March 23, 2010.<br />
Cameron, A. Colin & Pravin K. Trivedi (1998). Regression Analysis of Count Data. Cambridge<br />
University Press: Cambridge, U.K.<br />
Carlin, Bradley P. & Thomas A. Louis (2000). Bayes and Empirical Bayes Methods for Data Analysis,<br />
Chapman and Hall/CRC: Boca Raton.<br />
Cressie, Noel (1993). Statistics for Spatial Data. John Wiley & Sons: New York.<br />
Clayton, David & John Kaldor (1987). “Empirical Bayes estimates of age-standardized relative risks for<br />
use in disease mapping”. Biometrics, 43, 671-681.<br />
Cormen, T. H., Leiserson, C. E., Rivest, R. L. & Stein, C. (2009). “Ch. 16: Greedy algorithms”,<br />
Introduction to Algorithms, MIT Press: Cambridge, MA.<br />
Denison, D.G.T., C.C. Holmes, B.K. Mallick, & A.F.M. Smith (2002). Bayesian Methods for Nonlinear<br />
Classification and Regression. John Wiley & Sons, Ltd: Chichester, Sussex.<br />
De Smith, Michael, Michael F. Goodchild, & Paul A. Longley (2007). Geospatial Analysis (second<br />
edition). Matador: Leicester, U.K.<br />
105
Dijkstra, E. W. (1959). “A note on two problems in connection with graphs”, Numerische Mathematik, 1,<br />
269-271.<br />
Draper, Norman & Harry Smith (1981). Applied Regression Analysis, Second Edition. John Wiley &<br />
Sons: New York.<br />
Findley, David F. (1993). The Overfitting Principles Supporting AIC. Statistical Research Division<br />
Report Series, SRD Research Report no. CENSUS/SRD/ RR-93/04, U.S. Bureau of the Census:<br />
Washington, DC. http://www.census.gov/srd/papers/pdf/rr93-04.pdf.<br />
Fotheringham, A. Stewart, Chris Brunsdon, & Martin Charlton (2002). Geographically Weighted<br />
Regression: The Analysis of Spatially Varying Relationships. John Wiley & Sons: New York.<br />
Gelman, A. (1996). “Inference and monitoring convergence”. In Gilks, W. R., S. Richardson, & D. J.<br />
Spiegelhalter (eds), Markov Chain Monte Carlo in Pratice, Chapman and Hall: London.<br />
Gelman, A., J. B. Carlin, H. S. Stern, & D. B. Rubin (2004). Bayesian Data Analysis (second edition).<br />
Chapman and Hall/CRC: Boca Raton, FL.<br />
Gelman, A. & D. B. Rubin (1992). “Inference from iterative simulation using multiple sequences (with<br />
discussion)”, Statistical Science, 7, 457-511.<br />
Greenwood, M. & Yule, G. U. (1920). “An inquiry into the nature of frequency distributions of multiple<br />
happenings, with particular reference to the occurrence of multiple attacks of disease or repeated<br />
accidents”. Journal of the Royal Statistical Society, 83, 255-279.<br />
Guo, Feng, Xuesong Wang, & Mohamed A. Abdel-Aty (2009). “Modeling signalized intersection safety<br />
with corridor-level spatial correlations”, Accident Analysis and Prevention, In press.<br />
Hall, D. B. (2000). “Zero-inflated Poisson and binomial regression with random effects: a case study”.<br />
Biometrics, 56, 1030-1039.<br />
Hastings, W. K. (1970). “Monte Carlo sampling methods using Markov Chains and their applications”,<br />
Biometrika, 57, 97-109.<br />
H-GAC (2010). Transportation and air quality program, Houston-Galveston Area Council. http://www.hgac.com/taq/.<br />
Hilbe, Joseph M. (2008). Negative Binomial Regression (with corrections). Cambridge University Press:<br />
Cambridge.<br />
106
Husmeier, Dirk & Grainne McGuire (2002). “Detecting recombination in DNA sequence alignments: A<br />
comparison between maximum likelihood and Markov Chain Monte Carlo”. Biomathematics and<br />
Statistics Scotland, SCRI: Dundee.<br />
http://www.bioss.ac.uk/~dirk/software/BARCEtdh/Manual/em/em.html<br />
Jessen, R.J. (1979). Statistical Survey Techniques. John Wiley & Sons: New York.<br />
Kanji, Gopal K. (1993). 100 Statistical Tests. Sage Publications: Thousand Oaks, CA.<br />
Lee, Peter M. (2004). Bayesian Statistics: An Introduction (third edition). Holder Arnold: London.<br />
Leonard, Thomas & John S.J. Hsu (1999). Bayesian Methods: An Analysis for Statisticians and<br />
Interdisciplinary Researchers. Cambridge University Press: Cambridge.<br />
Levine, Ned (2010). “Spatial variation in motor vehicle crashes by gender in the Houston metropolitan<br />
area”. Proceedings of the 4 th International Women’s Issues in Transportation Conference. In press.<br />
Levine, Ned & Phil Canter (2010). “Linking origins with destinations for DWI motor vehicle crashes: An<br />
application of Crime Travel Demand modeling”. Crime Mapping, Under revision.<br />
Levine, Ned & Patsy Lee (2010). “Gender and journey-to-crime in Manchester, England”. Criminology,<br />
Under revision.<br />
Lord, Dominique (2006). “Modeling motor vehicle crashes using Poisson-gamma models: Examining the<br />
effects of low sample mean values and small sample size on the estimation of the fixed dispersion<br />
parameter”. Accident Analysis and Prevention, 38, 751-766.<br />
Lord, Dominique & L.F. Miranda-Moreno (2008). AEffects of low sample mean values and small sample<br />
size on the estimation of the fixed dispersion parameter of Poisson-gamma models for modeling motor<br />
vehicle crashes: A Bayesian Perspective@. Safety Science, 46 (5), 751-770.<br />
Lynch, Scott M. (2007). Introduction to Applied Bayesian Statistics and Estimation for Social Scientists.<br />
Springer: New York.<br />
McCullagh, P. & J. A. Nelder (1989). Generalized Linear Models (2 nd edition). Chapman & Hall/CRC:<br />
Boca Raton, FL.<br />
Metropolis, N., A. W. Rosenbluth, M. N. Rosenbluth, A. H. Teller, & E. Teller (1953). “Equations of<br />
state calculations by fast computing machines”, Journal of Chemical Physics, 21, 1087-91.<br />
Miaou, Shaw-pin (2006). “Coding instructions for the spatial regression models in <strong>CrimeStat</strong>”.<br />
Unpublished manuscript. College Station, TX.<br />
Miaou, Shaw-Pin, Joon Jin Song, & Bani K. Mallick (2003). “Roadway traffic crash mapping: a spacetime<br />
modeling approach”, Journal of Transportation and Statistics, 6 (1), 33-57.<br />
107
Miaou, Shaw-Pin (1996). Measuring the Goodness-of-Fit of Accident Prediction Models. FHWA-RD-<br />
96-040. Federal Highway Administration, U.S. Department of Transportation: Washington, DC.<br />
StatSoft (2010). “Tolerance”, StatSoft Electronic StatisticsTextbook, StatSoft:Tulsa, OK.<br />
http://www.statsoft.com/textbook/statistics-glossary/t/button/t/<br />
Microsoft (2003). “SKEW - skewness function”, Microsoft Office Excel 2003, Microsoft: Redmond, WA.<br />
Mitra, S. & S. Washington (2007). “On the nature of over-dispersion in motor vehicle crash prediction<br />
models”, Accident Analysis and Prevention, 39, 459-468.<br />
Myers, R. H. (1990) Classical and Modern Regression with Applications, 2 nd edition, Duxbury Press,<br />
Belmont, CA.<br />
Nannen, Volker (2003). The Paradox of Overfitting. Artificial Intelligence, Rijksuniversitat: Groningen,<br />
Netherlands. http://volker.nannen.com/pdf/the_paradox_of_overfitting.pdf. Accessed March 11, 2010.<br />
NIST (2004). “Gallery of distributions”. Engineering Statistics Handbook. National Institute of<br />
Standards and Technology: Washington, DC.<br />
http://www.itl.nist.gov/div898/handbook/eda/section3/eda366.htm.<br />
Ntzourfras, I. (2009). Bayesian Modeling using WinBugs. Wiley Series in Computation Statistics, Wiley:<br />
New York.<br />
Oh, J., Lyon, C., Washington, S., Persaud, B., & Bared , J. (2003). “Validation of FHWA crash models<br />
for rural intersections: lessons learned”. Transportation Research Record 1840, 41-49.<br />
Park, Byung-Jung (2009). “Note on the Bayesian analysis of count data”. From Park, Byung-Jung PhD<br />
thesis, Texas A & M University: College Station, TX.<br />
Park, E.S., and D. Lord (2007) Multivariate Poisson-Lognormal Models for Jointly Modeling<br />
Crash Frequency by Severity. In Transportation Research Record 2019: Journal of the<br />
Transportation Research Board, TRB, National Research Council, Washington, D.C., pp. 1-6.<br />
Radford, N. (2006). “The problem of overfitting with maximum likliehood” . CSC 411: Machine<br />
Learning and Data Mining, University of Toronto: Toronto, CA.<br />
http://www.cs.utoronto.ca/~radford/csc411.F06/10-nn-early-nup.pdf Accessed March 11, 2010.<br />
Radford, N. (2003). “Slice sampling”, Annals of Statistics, 31(3), 705-767.<br />
So, A. M., Ye, Y., & Zhang, J. (2007). “Greedy algorithms for metric facility location problems”. In<br />
Gonzalez, T. F. (Ed), Handbook of Approximation Algorithms and Metaheuristics, CRC Computer &<br />
Information Sciences Series, Chapman & Hall/CRC: Boca Raton, FL, Chapter 39.<br />
108
Springer (2001). “Polya distribution”, Encyclopedia of Mathematics, Springerlink: London,<br />
http://eom.springer.de/p/p073540.htm.<br />
Tabachnick, B. G. & L. S. Fidell (1996). Using Multivariate Statistics (3 rd ed). Harper Collins: New<br />
York.<br />
Train, K. (2009). Discrete Choice Methods with Simulation (2 nd edition). Cambridge University Press:<br />
Cambridge.<br />
Venables, W.N. and B.D. Ripley (1997). Modern Applied Statistics with S-Plus (second edition).<br />
Springer-Verlag: New York.<br />
Wikipedia (2010a). “Negative binomial distribution”, Wikipedia,<br />
http://en.wikipedia.org/wiki/Negative_binomial_distribution Accessed February 24, 2010.<br />
Wikipedia (2010b). “Maximum likelihood”, Wikipedia.<br />
http://en.wikipedia.org/wiki/Maximum_likelihood. Accessed March 12, 2010.<br />
Wikipedia (2010c). “Greedy algorithm”, Wikipedia. http://en.wikipedia.org/wiki/Greedy_algorithm.<br />
Accessed March 12, 2010.<br />
Wikipedia (2010d). “Condition number”. Wikipedia. http://en.wikipedia.org/wiki/Condition_number.<br />
Accessed March 19, 2010<br />
109