Nigeria Banking Sector Coverage - December 2011 'Bad ... - Imara
Nigeria Banking Sector Coverage - December 2011 'Bad ... - Imara
Nigeria Banking Sector Coverage - December 2011 'Bad ... - Imara

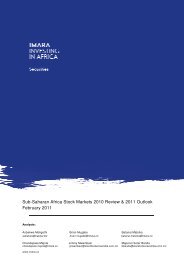
Create successful ePaper yourself
Turn your PDF publications into a flip-book with our unique Google optimized e-Paper software.
<strong>Nigeria</strong> <strong>Banking</strong> <strong>Sector</strong> <strong>Coverage</strong> - <strong>December</strong> <strong>2011</strong><br />
<strong>'Bad</strong> bank' leads to good entry points……<br />
Analyst:<br />
Brian K Mugabe<br />
+27 11 550 6005<br />
brian.mugabe@imara.co
Table of Contents<br />
<strong>Nigeria</strong>n <strong>Banking</strong> <strong>Sector</strong> Overview ................................................................. 1<br />
Access Bank ............................................................................................. 5<br />
Ecobank Transnational Inc ........................................................................... 9<br />
First City Monument Bank .......................................................................... 13<br />
First Bank <strong>Nigeria</strong> .................................................................................... 17<br />
Guaranty Trust Bank ................................................................................. 21<br />
StanbicIBTC Bank ..................................................................................... 25<br />
United Bank for Africa ............................................................................... 29<br />
Zenith Bank ............................................................................................ 33
<strong>Nigeria</strong> <strong>Banking</strong> <strong>Sector</strong> Overview<br />
Having undergone a major recapitalisation in 2005, where<br />
new minimum capital requirements of NGN 25bn led to the<br />
number of banks in <strong>Nigeria</strong> reduced to 25 from 89 through<br />
regulatory mergers and acquisition and later to 24 through<br />
market-induced merger and acquisition, <strong>Nigeria</strong>’s banking<br />
sector was supposed to be sound and well poised for the<br />
growth that its under banked retail market would provide<br />
with bank branches growing from 2,900 in 2005 to almost<br />
5,500 in mid-2009. Indeed, all seemed well, until the GFC<br />
hit in 2008, and the sector’s shiny coat began to unravel.<br />
As noted by the current CBN Governor in a public lecture in<br />
<strong>December</strong> 2010, the GFC affected <strong>Nigeria</strong> through both the<br />
financial and real (trade, remittances and aid) channels.<br />
The undiversified nature of the <strong>Nigeria</strong>n economy and the<br />
high dependence on exports of crude oil as well as foreign<br />
capital inflows compounded the impact of the external<br />
shock arising from the crisis, as <strong>Nigeria</strong> experienced low<br />
demand for its oil export due to recession in the economies<br />
of her major trading partners. This, coupled with the<br />
collapse in the international price of oil, led to severe<br />
decline in foreign exchange receipts and consequently,<br />
government revenue contraction. There was a substantial<br />
decline in foreign capital inflows just as foreign trade<br />
finance reduced significantly for some banks while for<br />
others credit lines literally dried-up.<br />
The greatest impact was, however, felt in the capital<br />
markets. The excess liquidity that had hitherto found its<br />
way into the stock market in the heydays of 2006/2007,<br />
which had also allowed banks to raise capital, had led to<br />
many of <strong>Nigeria</strong>’s bank’s being overcapitalised. The increase<br />
in capital supported banks’ balance sheet growth with<br />
banking sector assets as percentage of GDP increasing<br />
rapidly to 60% from about 30% in 2004. Struggling to<br />
profitably deploy all of this capital (most banks actually<br />
took in more capital than they had sought to raise as the<br />
NSE allowed this at the time in the event of<br />
oversubscriptions), banks were under pressure to create risk<br />
asset amidst limited product innovation and diversification.<br />
This, the CBN notes, coupled with poor risk management,<br />
led to a concentration of assets in certain areas, in<br />
particular margin lending and oil trading/marketing. As at<br />
end-<strong>December</strong> 2008, banks’ total exposure to the oil<br />
industry stood at over NGN 754bn, representing over 10% of<br />
the industry total and over 27% of shareholders’ funds.<br />
Thus, as foreign investors began to pull their funds out of<br />
the market, looking to reduce their exposure to “riskier”<br />
emerging and frontier markets, further exacerbating<br />
investor negativity due to the waning economy, panic selling<br />
by domestic investors followed. The capital market<br />
downturn had a negative impact on bank balance sheet<br />
through increased provisioning for bad debts and lower<br />
profitability. The result was a sharp deterioration in the<br />
quality of bank assets which then led to concerns over<br />
banking sector liquidity.<br />
Concerned about the state of some of the <strong>Nigeria</strong>n<br />
banks and the overall stability of the financial<br />
system, the Central Bank of <strong>Nigeria</strong> (CBN),<br />
commissioned special examinations on all 24 banks<br />
in <strong>Nigeria</strong>. These examinations highlighted<br />
significant deficiencies in capital adequacy and<br />
liquidity requirements, and illustrated major<br />
weaknesses in corporate governance and risk<br />
management practices. Ten banks were adjudged<br />
to be in grave states with deficiencies in capital<br />
adequacy i.e.: Oceanic Bank, Union Bank of<br />
<strong>Nigeria</strong>, Intercontinental Bank, Bank PHB, Afribank<br />
<strong>Nigeria</strong>, Finbank, Equitorial Trust Bank, Spring<br />
Bank and Wema Bank Plc. The tenth bank, Unity<br />
Bank, was not deemed to be in grave danger, but<br />
still adjudged to have insufficient capital and<br />
unacceptable levels of non-performing loans<br />
(NPLs). Of these, eight also had significant<br />
deficiencies in liquidity, risk management<br />
practices and corporate governance policies.<br />
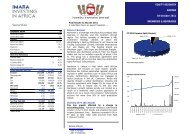
Dec 2010<br />
Negative NAV (NGN bn)<br />
Oceanic Bank International<br />
<strong>Nigeria</strong> Plc (94 261)<br />
Union Bank of <strong>Nigeria</strong> Plc (135 894)<br />
Intercontinental Bank Plc (330 709)<br />
Bank PHB Plc (242 309)<br />
Afribank <strong>Nigeria</strong> Plc (260 940)<br />
Finbank Plc (104 751)<br />
Equitorial Trust Bank Ltd (27 253)<br />
Spring Bank Plc (87 869)<br />
Source: CBN<br />
The CBN took proactive steps, including the<br />
injection of NGN 620bn as a convertible loan that<br />
amounts to Tier II capital into the banks, replacing<br />
the Chief Executives and Executive Directors of<br />
eight of the banks with competent managers with<br />
experience and integrity, introducing the<br />
guarantee of the local interbank market to ensure<br />
continued liquidity for all banks and guaranteeing<br />
foreign creditors and correspondent banks’ credit<br />
lines to ensure confidence and maintain important<br />
correspondent banking relationships. The CBN also<br />
moved to create a “bad bank”, the Asset<br />
Management Corporation of <strong>Nigeria</strong> (AMCON). By<br />
31 <strong>December</strong> 2010, AMCON had executed loan<br />
purchase and service agreements with 21<br />
participating banks to acquire NPLs with a face<br />
value of NGN 2.04tn for just under NGN 800bn.<br />
92.5% of the purchased NPLs were from the 10<br />
“intervened” banks with the balance of 7.25%<br />
coming from other banks. AMCON issued 3-year<br />
zero coupon bonds with a yield of 10.125% as<br />
consideration for the purchased NPLs. This helped<br />
to further stabilise the banking sector.<br />
1
Along with the advent of AMCON, the CBN also required<br />
that the rescued banks be recapitalised by 30<br />
September <strong>2011</strong>. Wema Bank and Unity Bank were<br />
successfully recapitalised, we saw five banks, namely<br />
Union Bank Plc, Oceanic Bank Plc, Finbank Plc,<br />
Intercontinental Bank Plc and Equatorial Trust Bank<br />
enter into different M&A deals. Union Bank shareholders<br />
approved a USD 750m injection by a group of private<br />
equity investors led by African Capital Alliance who will<br />
own 60% of its equity; Intercontinental Bank Plc will<br />
merge with Access Bank; Oceanic Bank will be<br />
recapitalised by Ecobank Transnational Inc (ETI) and<br />
merged with its <strong>Nigeria</strong>n subsidiary Ecobank Plc;<br />
FinBank will merge with FCMB and Equitorial Trust Bank<br />
will merge with Sterling Bank. In August <strong>2011</strong>, the CBN<br />
had revoked the licenses of three banks for failing to<br />
show ability to recapitalise ahead of the deadline, for<br />
all intents and purposes nationalising Bank PHB,<br />
Afribank and Spring Bank. The assets of these banks<br />
were transferred to three newly created, nationalised<br />
banks: Keystone Bank, Enterprise Bank and Mainstreet<br />
Bank.<br />
Aggregate banking system’s claims (net) on the Federal<br />
Government also rose by 19.0% to negative NGN<br />
908.75bn, reflecting, largely, the increase in the<br />
banking system’s holding of treasury securities,<br />
particularly FGN Bonds. The Federal Government,<br />
however, remained a net lender to the banking system<br />
at the end of the review month.<br />
Relative to the level at 31 <strong>December</strong> 2010, banking<br />
system’s credit to the private sector rose by 10.9%,<br />
owing largely to the increase in credit to the core<br />
private sector. Foreign assets (net) of the banking<br />
system, however, increased by 7.2%, reflecting,<br />
largely, the 9.0% rise in the CBN’s holding. Quasimoney,<br />
also rose by 11.5%. Other assets (net) of the<br />
banking system, however, increased by 22.0%.<br />
Selected DMBs Interest Rates (Average)<br />
Financial <strong>Sector</strong> Developments – <strong>2011</strong><br />
The latest available monthly review from the CBN for<br />
August <strong>2011</strong>, reflects that relative to the level at end-<br />
<strong>December</strong> 2010, M2 grew by 8.5%, owing, largely, to<br />
14.7% increase in domestic credit in the banking system.<br />
M1 grew by 5.4% over the level at end-<strong>December</strong> 2010,<br />
owing wholly to the 7.2% increase in its demand deposit<br />
component.<br />
Growth Rate of M1 and M2<br />
Source: CBN Aug 11 Economic Report<br />
Total assets and liabilities of the DMBs amounted to<br />
NGN 19,482.9bn at end August, showing an increase of<br />
4.3% above the level at end-July <strong>2011</strong>. Funds sourced<br />
mainly from increased capitalisation, draw-down on<br />
reserves and increased in unclassified liabilities were<br />
used, largely, to extend credit to private sector and<br />
purchase of Federal Government securities. At NGN<br />
12,140.4bn, DMBs’ credit to the domestic economy<br />
rose by 12.5% above the level in the preceding month.<br />
M-o-M Growth in Monetary and Credit Aggregates<br />
(%)<br />
Source: CBN Aug 11 Economic Report<br />
Foreign exchange inflows and outflows through the CBN<br />
in August were USD 4.32bn and USD 4.23bn,<br />
respectively, and resulted in a net inflow of USD 0.09bn.<br />
Foreign exchange sales by the CBN to the authorised<br />
dealers amounted to USD 3.68bn, showing an increase of<br />
11.6% and 53.2% over the level in the preceding month<br />
and the corresponding period of 2010, respectively.<br />
Over the level at end-<strong>December</strong> 2010, aggregate<br />
banking system credit (net) to the domestic economy,<br />
rose by 14.7%, due largely to the 19.0% and 10.9%<br />
increase in claims on Federal Government (net) and<br />
claims on the private sector, respectively, to NGN<br />
9,990.75bn.<br />
Source: CBN Aug 11 Economic Report<br />
2
The breakdown, on a month-on-month basis, showed<br />
that credit to states and local governments and credits<br />
to the core private sector rose by 11.5% and 9.8%,<br />
respectively, above their levels in July <strong>2011</strong>. Central<br />
Bank’s credit to the DMBs, largely, loans and advances,<br />
fell marginally by 0.04% to NGN 384.61bn at end-August,<br />
while specified liquid assets of the DMBs stood at NGN<br />
3116.62bn, representing 21.5% of their total current<br />
liabilities. This level of liquid assets was 12.9<br />
percentage points above the preceding month’s ratio,<br />
but 8.5 percentage points below the stipulated<br />
minimum ratio of 30.0% for fiscal <strong>2011</strong>. The loan-todeposit<br />
ratio was 43.6% and was 36.4 percentage points<br />
below the stipulated maximum target of 80.0%.<br />
The quality of risk assets in the banking sector improved<br />
significantly in H1 11. The industry NPL ratio declined to<br />
10.4%, from 20.1% and 37.1% at end-<strong>December</strong> 2010 and<br />
the corresponding period of 2010, respectively. The<br />
ratio was well below the acceptable contingency<br />
threshold of 20.0% for the industry. Also, the ratio of<br />
non-performing loans (net of provisions) to capital<br />
declined to 34.7% from 64.2% at end-<strong>December</strong> 2010.<br />
The development was attributed to the acquisition of<br />
NGN 2.73tn in eligible bank assets (EBAs) by AMCON and<br />
the improved risk management practices by banks. The<br />
corporation’s acquisition of NPLs significantly improved<br />
banks assets quality from the all-time high record of<br />
34.4% at end-November 2010 prior to the<br />
commencement of AMCON to 10.4% at end-June <strong>2011</strong>,<br />
compared with its current threshold of 25.0%.<br />
Source: CBN H1 11 Economic Report<br />
According to the CBN’s H1 11 Economic Report, the<br />
average CAR of the sixteen non-intervened banks was<br />
21.5% at end-June <strong>2011</strong>, while the CAR of the eight<br />
intervened banks was -53.5%. Overall, the average CAR<br />
of the industry stood at 5.0% at end-June <strong>2011</strong>,<br />
representing a decline of 2.0 percentage points from its<br />
levels at end-<strong>December</strong> 2010 and a shortfall of 3.0<br />
percentage points relative to the Basel II minimum<br />
requirement of 8.0%. Banks’ industry- wide average<br />
liquidity ratio, at 50.3%, was above the 30.0 and 47.5%<br />
minimum requirement and the level at end-<strong>December</strong><br />
2010, respectively. One bank, however, failed to meet<br />
the stipulated ratio, compared with the 100.0%<br />
compliance achieved at <strong>December</strong> 2010.<br />
Source: CBN H1 11 Economic Report<br />
Source: CBN H1 11 Economic Report<br />
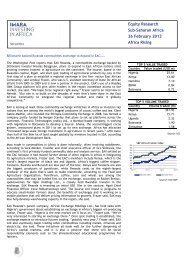
With the advent of AMCON, and the recapitalisation and<br />
consolidation of the sector largely completed, <strong>Nigeria</strong>’s<br />
banks are looking attractive once more. Valuations<br />
remain low, a result of foreign capital leaving the<br />
exchange in a bid to reduce exposure to riskier assets<br />
which always affects the liquid banking stocks more<br />
than the rest, while other investors adopt a wait and<br />
see attitude as they hope to get better earnings<br />
visibility once the AMCON sales and mergers and<br />
acquisitions have been completed. We think now is a<br />
good time for investors to once again look for entry<br />
points. Growth prospects remain compelling, with the<br />
majority of the population having limited access to<br />
financial services, as the sector remains largely geared<br />
towards the corporate and higher income segments.<br />
The Economist Intelligence Unit, EIU, estimates<br />
<strong>Nigeria</strong>’s financial access level at just 15%, compared<br />
with, for example, 46% in South Africa. It forecasts that<br />
<strong>Nigeria</strong>’s banking sector will nearly double its assets in<br />
the next decade, which we believe will translate to<br />
strong growth in earnings for the sector.<br />
3
NGN (m )<br />
NGN (m )<br />
NGN (m )<br />
NGN (m)<br />
NGN (m)<br />
NGN (m)<br />
The EIU does temper the outlook, however, noting that the sector’s growth will not be as strong as it could be, due<br />
to the fact that the economy will not grow at a pace that will see a more rapid increase in the number of bankable<br />
households, in the medium term. In the shorter term, the recent tightening in monetary policy by the CBN will<br />
likely lead to an improved net interest performance for the more liquid banks as they take up higher yielding<br />
government assets, but of course the other side will be a slowdown in loans and advances and potentially rising<br />
provisioning levels as borrowing costs rise for clients.<br />
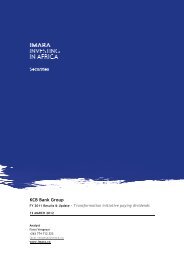
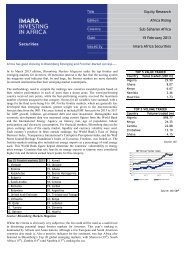
All the <strong>Nigeria</strong>n banks under coverage in this report yield buy recommendations, with the exception of StanbicIBTC,<br />
on which we issue as sell recommendation given its unjustifiable, in our view, relative and intrinsic valuations,<br />
while we issue a hold recommendation on UBA pending further clarification on the capital raise. Our favourites are<br />
GTB, Zenith and First Bank, while we think Access Bank could yield the most benefits from the M&A activity.<br />
1 400 000<br />
1 200 000<br />
Loans & Advances Pre M&A (9M 11)<br />
1 400 000<br />
1 200 000<br />
Loans & Advances Post M&A (9M 11)<br />
1 000 000<br />
1 000 000<br />
800 000<br />
800 000<br />
600 000<br />
600 000<br />
400 000<br />
200 000<br />
-<br />
FBN<br />
Zenith Bank<br />
UBA<br />
GTB<br />
Access Bank<br />
Skye Bank<br />
Diamond Bank<br />
FCMB<br />
Oceanic Bank (H1 11)<br />
Union Bank<br />
StanbicIBTC<br />
Ecobank <strong>Nigeria</strong><br />
Fidelity Bank<br />
Sterling Bank<br />
Unity Bank (Q1 11)<br />
Mainstreet (Q1 11)<br />
Intercontinental Bank<br />
Keystone (Q1 11)<br />
Wema Bank<br />
FinBank<br />
Enterprise (Q1 11)<br />
400 000<br />
200 000<br />
-<br />
FBN<br />
Zenith Bank<br />
UBA<br />
GTB<br />
Access/Intercon. (Proforma)<br />
Ecobank/Oceanic (est.)<br />
Skye Bank<br />
Diamond Bank<br />
FCMB/FinBank (Proforma)<br />
Union Bank<br />
StanbicIBTC<br />
Fidelity Bank<br />
Sterling Bank<br />
Unity Bank (Q1 11)<br />
Mainstreet (Q1 11)<br />
Keystone (Q1 11)<br />
Wema Bank<br />
Enterprise (Q1 11)<br />
Deposits Post M&A (9M 11)<br />
Deposits Pre M&A (9M 11)<br />
2 500 000<br />
2 500 000<br />
2 000 000<br />
1 500 000<br />
2 000 000<br />
1 500 000<br />
1 000 000<br />
1 000 000<br />
500 000<br />
500 000<br />
-<br />
FBN<br />
Zenith Bank<br />
UBA<br />
GTB<br />
Union Bank<br />
Access Bank<br />
Intercontinental Bank<br />
Oceanic Bank (H1 11)<br />
Skye Bank<br />
Diamond Bank<br />
Fidelity Bank<br />
FCMB<br />
Ecobank <strong>Nigeria</strong><br />
Keystone (Q1 11)<br />
Mainstreet (Q1 11)<br />
Unity Bank (Q1 11)<br />
StanbicIBTC<br />
Sterling Bank<br />
FinBank<br />
Wema Bank<br />
Enterprise (Q1 11)<br />
-<br />
FBN<br />
Zenith Bank<br />
UBA<br />
Access/Intercon. (Proforma)<br />
GTB<br />
Ecobank/Oceanic (est.)<br />
Union Bank<br />
Skye Bank<br />
FCMB/FinBank (Proforma)<br />
Diamond Bank<br />
Fidelity Bank<br />
Keystone (Q1 11)<br />
Mainstreet (Q1 11)<br />
Unity Bank (Q1 11)<br />
StanbicIBTC<br />
Sterling Bank<br />
Wema Bank<br />
Enterprise (Q1 11)<br />
3 500 000<br />
3 000 000<br />
2 500 000<br />
Total Assets Pre M&A (9M 11)<br />
3 500 000<br />
3 000 000<br />
2 500 000<br />
Total Assets Post M&A (9M 11)<br />
2 000 000<br />
1 500 000<br />
1 000 000<br />
500 000<br />
2 000 000<br />
1 500 000<br />
1 000 000<br />
-<br />
FBN<br />
Zenith Bank<br />
UBA<br />
GTB<br />
Union Bank (Q1 11)<br />
Access Bank<br />
Oceanic Bank (H1 11)<br />
Skye Bank<br />
Diamond Bank<br />
Fidelity Bank<br />
FCMB<br />
Intercontinental Bank<br />
Ecobank <strong>Nigeria</strong><br />
StanbicIBTC<br />
Keystone (Q1 11)<br />
Unity Bank (Q1 11)<br />
Sterling Bank<br />
Mainstreet (Q1 11)<br />
Wema Bank<br />
FinBank<br />
Enterprise (Q1 11)<br />
500 000<br />
-<br />
FBN<br />
Access/Intercon. (Proforma)<br />
Zenith Bank<br />
UBA<br />
Ecobank/Oceanic (est.)<br />
GTB<br />
Union Bank (Q1 11)<br />
FCMB/FinBank (Proforma)<br />
Skye Bank<br />
Diamond Bank<br />
Fidelity Bank<br />
StanbicIBTC<br />
Keystone (Q1 11)<br />
Unity Bank (Q1 11)<br />
Sterling Bank<br />
Mainstreet (Q1 11)<br />
Wema Bank<br />
Enterprise (Q1 11)<br />
700<br />
600<br />
500<br />
400<br />
Branch Network (Pre M&A)<br />
700<br />
600<br />
500<br />
400<br />
Branch Network (Post M&A)<br />
300<br />
300<br />
200<br />
200<br />
100<br />
100<br />
0<br />
FBN<br />
UBA<br />
Union Bank<br />
Oceanic Bank<br />
Intercontinental Bank<br />
Zenith Bank<br />
Skye Bank<br />
Unity Bank<br />
Ecobank <strong>Nigeria</strong><br />
Diamond Bank<br />
Mainstreet<br />
Keystone<br />
GTB<br />
FinBank<br />
Fidelity Bank<br />
StanbicIBTC<br />
Wema Bank<br />
FCMB<br />
Enterprise<br />
Access Bank<br />
Sterling Bank<br />
ETB<br />
0<br />
FBN<br />
Ecobank/Oceanic<br />
UBA<br />
Access/Intercon.<br />
Union Bank<br />
FCMB/FinBank<br />
Zenith Bank<br />
Skye Bank<br />
Unity Bank<br />
Diamond Bank<br />
Mainstreet<br />
Keystone<br />
Sterling/ETB<br />
GTB<br />
Fidelity Bank<br />
StanbicIBTC<br />
Wema Bank<br />
Enterprise<br />
4
EQUITY RESEARCH<br />
NIGERIA<br />
DECEMBER <strong>2011</strong><br />
BANKING<br />
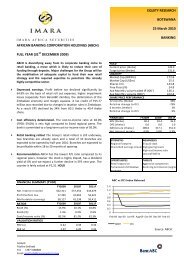
Incorporated in 1989 and subsequently listed in 1998,<br />
Access Bank Plc (Access) is a full scale commercial bank<br />
in <strong>Nigeria</strong>. It has also expanded its footprint beyond<br />
<strong>Nigeria</strong>’s borders, with subsidiaries in eight other<br />
African countries, namely Ghana, Sierra Leone, The<br />
Gambia, Cote d’Ivoire, Zambia, Burundi, Rwanda and<br />
the DRC, as well as having a presence in the United<br />
Kingdom. As at FY 2010, the group had over two million<br />
customers served from 148 branches by 2,255<br />
employees across all its jurisdictions. <strong>Nigeria</strong> remains<br />
the anchor though, with 110 branches and 1,317<br />
employees out of the total.<br />
• An attributable loss in the nine months to Dec 09 of<br />
NGN 4.2bn as the CBN’s strict provisioning came to<br />
the fore was turned around in FY 10, where the group<br />
recorded an attributable profit of NGN 11.2bn.<br />
• The increase in earnings was, however, driven more<br />
by a reduction in the impairment charge, as operating<br />
income actually fell by 4.75% to NGN 65.0bn, as both<br />
net funded income fell y-o-y while non-funded income<br />
reflected a marginal increase.<br />
• In its 9M 11 results to September, a strong recovery in<br />
net interest income as well as an improved CIR led to<br />
earnings increasing by 34.89% to NGN 12.9bn.<br />
• In a move to make the step up from ‘2nd’ to ‘1st’ tier<br />
bank, Access shareholders approved the merger<br />
(effective takeover) of the bank with that of one of<br />
the ‘rescued’ banks, Intercontinental Bank. This will<br />
make the combined entity a top 3-5 bank in <strong>Nigeria</strong>,<br />
depending on the metric, and we expect the benefits<br />
to Access of the wider branch network and lower cost<br />
of funds to be significant.<br />
• Using a DCF valuation, we value Access Bank at NGN<br />
11.65 per share, without taking into account the<br />
acquisition of Intercontinental. A coverage based PBV<br />
average based on the last published post merger proforma<br />
accounts suggests a valuation of NGN 10.21 per<br />
share. In our view, Access looks best placed to benefit<br />
from M&A activity relative to its peers. BUY.<br />
Recommendation<br />
BUY<br />
Bloomberg Code<br />
ACCESS:NL<br />
Current Price (NGN) 4.9<br />
Current Price (USc) 3.0<br />
Target Price (NGN) 11.6<br />
Target Price (USc) 7.2<br />
Upside (%) 140.2<br />
Liquidity<br />
Market Cap (NGN m) 86 758<br />
Shares (m) 17 888<br />
Free Float (est. %) 80.5<br />
Ave. daily vol ('000) - 1 yr. 16.9<br />
Price Performance<br />
Price, 12 months ago (NGN) 125.0<br />
Change (%) (96.1)<br />
Price, 6 months ago (NGN) 130.0<br />
Change (%) (96.3)<br />
Financials (NGN m) 31 Dec F2010 <strong>2011</strong>F 2012F<br />
Loans & Advances 455 552 670 879 838 051<br />
Net Interest Income (excl. Provisions) 44 166 53 647 69 911<br />
Non-Interest Income 25 355 32 253 43 277<br />
Attributable Earnings 11 245 17 326 25 607<br />
EPS (kobo) 64.8 97.3 143.9<br />
DPS (kobo) 50.0 58.4 86.3<br />
NAV/Share (kobo) 1 027.1 1 027.7 1 113.2<br />
Valuation Ratios Current <strong>2011</strong>F 2012F<br />
Earnings Yield* (%) 16.8 20.1 29.7<br />
Dividend Yield (%) 10.3 12.0 17.8<br />
PE* (x) 6.0 5.0 3.4<br />
PBV (x) 0.49 0.47 0.44<br />
RoaA (%) 1.5 1.8 2.0<br />
RoaE (%) 6.5 9.6 13.4<br />
Net Interest Margin (%) 7.3 7.1 7.0<br />
Cost to Income Ratio (%) 70.0 59.7 59.9<br />
* - trailing<br />
Access Bank vs NSE ASI (Rebased)<br />
1.5<br />
1.4<br />
1.3<br />
1.2<br />
1.1<br />
1<br />
0.9<br />
0.8<br />
0.7<br />
0.6<br />
0.5<br />
0.4<br />
0.3<br />
17-Nov-10<br />
17-Dec-10<br />
17-Jan-11<br />
17-Feb-11<br />
17-Mar-11<br />
17-Apr-11<br />
17-May-11<br />
17-Jun-11<br />
17-Jul-11<br />
17-Aug-11<br />
17-Sep-11<br />
17-Oct-11<br />
17-Nov-11<br />
Strengths<br />
Weaknesses<br />
IT focused<br />
Wholesale roots has meant traditionally higher cost of funds<br />
Solid CAR and liquidity ratios<br />
Large oil & gas exposure - should now be resolved via AMCON<br />
Targeting middle market where most peers focus on top end Relatively small branch network<br />
Opportunities<br />
Threats<br />
Intercon acquisition to give increased scale and<br />
<strong>Sector</strong> to become more competitive<br />
lower cost of funds<br />
Delays/ resistance to acquisition could lead to slower<br />
Combined branch network enhances customer base implementation and benefits thereof accruing<br />
Access Bank<br />
NSE ASI<br />
5
NGN (m)<br />
NGN (m)<br />
FY 10 & 9M 11 Financial & Operational Review<br />
Having recorded an attributable loss in the nine months<br />
to Dec 09 of NGN 4.2bn, driven by the stringent CBN<br />
provisioning requirements following the banking sector<br />
turmoil, FY 10 saw Access Bank return to profitability.<br />
Comparing FY 10 with the annualised 9M 09 numbers, net<br />
interest income for the year was down 8.56% to NGN<br />
44.2bn, with interest income falling 25.77% to NGN<br />
65.8bn and interest expense down 46.38% to NGN 21.6bn.<br />
Interest margins fell during the year as lower interest<br />
rates led to falling yields on earning assets while demand<br />
for credit remained sluggish given the slow economic<br />
environment.<br />
120 000<br />
100 000<br />
80 000<br />
60 000<br />
40 000<br />
20 000<br />
0<br />
2005 2007 2008 2009 2010 <strong>2011</strong> E 2012 E<br />
Attributable Earnings Total Operating Income<br />
Source: Access Bank<br />
25 000<br />
20 000<br />
15 000<br />
10 000<br />
5 000<br />
0<br />
-5 000<br />
-10 000<br />
Net non-interest income growth was positive, if<br />
marginally so, up 2.72% to NGN 25.4bn. This was driven<br />
mainly by fee and commission income, with fees related<br />
to credit, remittances, LCs, and facility management all<br />
having a strong showing, as did transaction related<br />
commissions. The shaky revenue performance led to<br />
operating income falling 4.75% to NGN 65.0bn. Positively,<br />
operating expenses were curtailed during the year, up<br />
just 1.97% to NGN 48.8bn, but the cost to income ratio<br />
still deteriorated notably to 70.23% from 65.61%. <strong>Nigeria</strong><br />
remained the most dominant contributor to operating<br />
income with 86%, the rest of Africa following with 12%<br />
while the UK contributed 2%.<br />
The provision charge came down substantially to NGN<br />
4.5bn from NGN 22.2bn in the comparative period, as the<br />
group focused on higher quality advances while benefiting<br />
from AMCON sales (NGN 13.2bn sold with a P&L impact of<br />
NGN 486m), write backs and recoveries.<br />
With no associate line item in FY 10 compared with a loss<br />
of NGN 7.5bn in FY 09, the group swung from an<br />
annualised attributable loss of NGN 5.6bn to attributable<br />
earnings of NGN 11.2bn. The earnings per share<br />
equivalent for the year came out at 62.9 kobo while<br />
dividend per share was 50 kobo, down from 70 kobo in<br />
the prior year. On a net basis, the ex-<strong>Nigeria</strong> operations<br />
recorded a loss.<br />
Total assets were up 16% to NGN 804.8bn, with<br />
investments in securities which were up 147.30% to NGN<br />
117.9bn and net loans and advances of NGN 455.6bn, up<br />
16.46%, being prominent. The oil and gas, manufacturing<br />
and telecoms sectors were a combined 54% of the loan<br />
book, oil and gas leading the way with 22%. The NPL ratio<br />
improved to 8.1% from 19.0% in FY 09 while the coverage<br />
ratio, following AMCON sales and recoveries, improved to<br />
94% (FY 09: 37%). Capital market related NPLs at year end<br />
were 26%, and made up the largest single chunk.<br />
With deposits growing ahead of the loan book at 22.05%<br />
to NGN 599.3bn, the LDR fell to 81.9% from 85.7%. While<br />
the contribution of low cost deposits to the total<br />
improved to 51% from 39%, there still remained plenty of<br />
room to further optimise the deposit mix and help reduce<br />
cost of funds. RoAE and RoAA closed at 6.5% and 1.5%<br />
respectively, and the CAR was 26% vs. 32% as at Dec 09.<br />
900 000<br />
800 000<br />
700 000<br />
600 000<br />
500 000<br />
400 000<br />
300 000<br />
200 000<br />
100 000<br />
0<br />
Source: Access Bank<br />
2005 2007 2008 2009 2010 <strong>2011</strong> E 2012 E<br />
Deposits<br />
Loans & Advances<br />
ACCESS Q3 11 Results Summary (m) 30-Sep-11 30-Sep-10<br />
Net interest income 41 457 32 724<br />
Other Income 20 522 20 408<br />
Operating income 61 978 53 133<br />
Non-interest expense (36 808) (33 824)<br />
Allowance for credit impairment (8 744) (5 201)<br />
Operating profit 16 426 14 066<br />
Attributable earnings 12 890 9 556<br />
30-Sep-11<br />
30-Jun-11<br />
Loans and advances to customers 548 121 512 419<br />
Deposits from customers 646 642 639 112<br />
Total equity 176 467 175 397<br />
Source: Access Bank<br />
6
In its 9M 11 results to September, Access Bank continued<br />
to see an increase in earnings momentum, with gross<br />
earnings increasing by 5.40% y-o-y to NGN 82.2bn. Funded<br />
income largely drove income growth, increasing by<br />
26.68% on a net basis as the bank benefited from a rising<br />
interest rate environment allied with an improved deposit<br />
mix, factors which saw interest income rise by 7.12% and<br />
interest expense fall by 18.67%. NIMs improved to 8.3%<br />
compared with 6.8% at Q3 10 and 7.5% at FY 10.<br />
Non-interest income growth was far less palatable,<br />
however, up just 0.56% to NGN 20.5bn, a scenario which<br />
was attributed to a sluggish market for government<br />
securities. The position was improved from H1 11,<br />
however, where that line item actually recorded negative<br />
growth of 15%. Operating income growth was thus<br />
somewhat diluted to 16.65%, ending the 9M period at<br />
NGN 62.0bn.<br />
Operating expenses continued to be well controlled by<br />
Access, rising by just 8.82% to NGN 36.8bn, leading to a<br />
notable improvement in the cost to income ratio from<br />
63.66% to 59.38%. Adjusting for the AMCON levy, which<br />
was accrued at NGN 1.8bn, management notes that<br />
operating cost growth would have been an even more<br />
impressive c3.5% y-o-y, as the group remains focused on<br />
cost management and operational efficiencies.<br />
Provisions registered an increase y-o-y of 68.11% to NGN<br />
8.7bn, as the impact of the mandatory 1% general<br />
provision (NGN 5bn) came through the numbers.<br />
Attributable earnings closed the period at NGN 12.9bn,<br />
representing an increase of 34.89%, or annualised EPS of<br />
96 kobo, from 62.9 kobo in FY 10.<br />
Balance sheet growth was 4.18% from the half year, with<br />
total assets at NGN 1.0tn. Net loans and advances to<br />
customers went up 6.97% to NGN 548.1bn, while<br />
investment securities rose by 25.01% to NGN 130.2bn with<br />
the group receiving AMCON bonds for NPL sales. Oil and<br />
gas remained the highest class of loan exposure at 25%,<br />
while also having the largest NPL contribution at 41%. A<br />
large oil and gas loan was mainly responsible for the<br />
skew, (more than likely to Zenon) and management<br />
stated that this position will have been sold to AMCON by<br />
the end of Q4. NPL’s were down to 8% q-o-q from 9% at<br />
H1 11. Customer deposits growth was flat at 1.18% to<br />
NGN 646.6bn, attributed to a reduction in high cost<br />
deposits in a bid to improve margins. The CAR ended the<br />
period at 23%, slightly higher than the 22% at H1 but<br />
below FY 10’s 26%.<br />
2.0%<br />
3.0%<br />
14.0%<br />
19.0%<br />
18.0%<br />
Loans and Advances <strong>Sector</strong>al Split (Q3 11)<br />
25.0%<br />
19.0%<br />
Oil & Gas<br />
Manufacturing<br />
General Commerce<br />
Information & Communication<br />
Government<br />
Finance and Insurance<br />
Other<br />
Outlook<br />
Access has been a reasonably well run operation<br />
historically, but its roots as more of a<br />
corporate/wholesale bank have perhaps kept it from<br />
achieving as much as it could have in terms of growth.<br />
In a bid to give it more scale and enable it to compete<br />
more favourably against the first tier banks, Access<br />
successfully submitted a plan to the CBN to take over<br />
one of the rescued banks, Intercontinental Bank, by<br />
way of a scheme of merger, which has subsequently<br />
been approved by both sets of shareholders. Under<br />
the terms of the merger, AMCON was to recapitalise<br />
Intercontinental Bank to a zero NAV, via an injection<br />
of NGN 548bn in financial accommodation. Access<br />
would then inject NGN 50bn as equity into the bank,<br />
via an SPV, giving it 75% ownership. AMCON would be<br />
a 15% shareholder with the original Intercontinental<br />
shareholders remaining with 10% of the reconstituted<br />
entity. Until the date of merger, (12 month execution<br />
plan), Intercontinental will continue to operate as a<br />
subsidiary of Access.<br />
We see the case for this transaction for Access, as this<br />
will effectively leapfrog it into the top 3-5 banks in<br />
<strong>Nigeria</strong>, giving it an additional 366 branches and a<br />
pool of cheap deposits that will reduce its relatively<br />
high dependence on the wholesale market and bring<br />
down its cost of funds. As management pointed out on<br />
an investor call, this acquisition for Access is primarily<br />
a “funding” strategy. The bigger scale should also<br />
allow Access to write bigger ticket business, while<br />
non-interest income will benefit from the increased<br />
transactional volumes that a wide retail network will<br />
bring. As with any takeover/merger, risks will remain<br />
regarding how long it would take for synergies to have<br />
an impact on the bottom line, and of course to<br />
integrate the different cultures, people and<br />
processes.<br />
The forecasts presented in the scheme IM suggest that<br />
the merger will be accretive for Access by FY 12,<br />
where Intercontinental is forecast to record<br />
attributable earnings of NGN 8.1bn.<br />
Valuation and Recommendation<br />
Using a DCF valuation, we value Access Bank at NGN<br />
11.65 per share, without taking into account the<br />
acquisition of Intercontinental. A coverage based PBV<br />
average based on the last published post merger proforma<br />
accounts suggests a valuation of NGN 10.21 per<br />
share. In our view, Access looks best placed to benefit<br />
from M&A activity relative to its peers. BUY.<br />
7
Financial Summary<br />
Income Statement Summary 2005 A 2006 A 2007 A 2008 A 2009 A 2010 A <strong>2011</strong> E 2012 E<br />
Net Interest Income Before Loss Provision 2 353 6 261 11 942 26 031 36 226 44 166 53 647 69 911<br />
Y-o-Y Growth 166.1% 90.7% 118.0% 39.2% 21.9% 21.5% 30.3%<br />
Non Interest Income 3 566 4 628 10 988 17 323 18 513 25 355 32 253 43 277<br />
Y-o-Y Growth 29.8% 137.4% 57.7% 6.9% 37.0% 27.2% 34.2%<br />
Total Operating Income (incl Prov) 4 934 9 503 21 154 39 456 38 089 64 997 74 485 102 158<br />
Y-o-Y Growth 92.6% 122.6% 86.5% (3.5%) 70.6% 14.6% 37.2%<br />
Operating Expense (4 183) (8 384) (13 111) (20 610) (35 914) (48 644) (51 267) (67 844)<br />
Y-o-Y Growth 100.4% 56.4% 57.2% 74.3% 35.4% 5.4% 32.3%<br />
Profit Before Tax 751 1 119 8 043 18 846 (3 482) 16 169 23 218 34 315<br />
Y-o-Y Growth 49.1% 618.5% 134.3% (118.5%) (564.4%) 43.6% 47.8%<br />
Attributable Net Income/Profit After Tax 502 737 6 083 15 825 (4 195) 11 245 17 326 25 607<br />
Y-o-Y Growth 47.0% 725.3% 160.1% (126.5%) (368.1%) 54.1% 47.8%<br />
Balance Sheet Summary 2005 A 2006 A 2007 A 2008 A 2009 A 2010 A <strong>2011</strong> E 2012 E<br />
Cash & Short term Funds 11 812 46 264 158 433 585 706 157 770 128 577 127 211 173 081<br />
Y-o-Y Growth 291.7% 242.5% 269.7% (73.1%) (18.5%) (1.1%) 36.1%<br />
Financial Assets held for Trading 33 497 53 976 42 193 104 831 44 605 37 661 48 610 58 174<br />
Y-o-Y Growth 61.1% (21.8%) 148.5% (57.5%) (15.6%) 29.1% 19.7%<br />
Loans & Advances,Net 16 334 56 042 112 031 253 430 391 160 455 552 670 879 838 051<br />
Y-o-Y Growth 243.1% 99.9% 126.2% 54.3% 16.5% 47.3% 24.9%<br />
Deposits 37 032 123 550 222 051 433 664 490 984 599 261 847 247 1 091 014<br />
Y-o-Y Growth 233.6% 79.7% 95.3% 13.2% 22.1% 41.4% 28.8%<br />
Borrowings - - 14 652 2 604 81 89 98<br />
Y-o-Y Growth NA NA NA (82.2%) (96.9%) 10.0% 10.0%<br />
Shareholder's Equity 14 072 28 894 28 385 171 861 168 346 175 370 183 840 199 128<br />
Y-o-Y Growth 105.3% (1.8%) 505.5% (2.0%) 4.2% 4.8% 8.3%<br />
Per Share Data 2005 A 2006 A 2007 A 2008 A 2009 A 2010 A <strong>2011</strong> E 2012 E<br />
Earning per Share (NGN) 11.5 6.6 87.2 171.0 (27.1) 64.8 97.3 143.9<br />
Y-o-Y Growth (42.7%) 1217.4% 96.2% (115.8%) (339.2%) 50.2% 47.8%<br />
Dividend Per Share (NGN) 0.00 0.00 40.00 65.00 70.00 50.00 58.41 86.32<br />
Y-o-Y Growth NA NA 62.5% 7.7% (28.6%) 16.8% 47.8%<br />
Book Value Per Share (NGN) 324.0 259.4 406.8 1 854.1 1 036.2 1 027.1 1 027.7 1 113.2<br />
Y-o-Y Growth (20.0%) 56.8% 355.8% (44.1%) (0.9%) 0.1% 8.3%<br />
Tangible Book Value per share (NGN) 324.0 185.4 406.8 1 854.1 1 025.5 1 016.9 1 018.0 1 103.5<br />
Y-o-Y Growth (42.8%) 119.4% 355.8% (44.7%) (0.8%) 0.1% 8.4%<br />
Key Ratios 2005 A 2006 A 2007 A 2008 A 2009 A 2010 A <strong>2011</strong> E 2012 E<br />
Gross Loan to Deposit Ratio 48.9% 50.9% 55.2% 61.1% 85.7% 81.9% 83.6% 80.9%<br />
Gross Loan to Fund Ratio 48.9% 50.9% 55.2% 57.6% 84.9% 81.8% 83.5% 80.9%<br />
Net Interest Income to total income 47.7% 65.9% 56.5% 66.0% 95.1% 68.0% 72.0% 68.4%<br />
Cost to Income Ratio 70.7% 77.0% 57.2% 47.5% 65.6% 70.0% 59.7% 59.9%<br />
Interest Income to average interest earning assets 6.2% 7.7% 6.9% 6.1% 7.9% 9.1% 8.6% 9.1%<br />
Interest expense to average interest bearing liabilities 4.3% 3.1% 2.9% 4.4% 6.4% 4.0% 3.5% 4.0%<br />
Net Interest Spread 1.9% 4.6% 4.1% 1.7% 1.5% 5.1% 5.1% 5.1%<br />
Net Income Margin 10.2% 7.8% 28.8% 40.1% (11.0%) 17.3% 23.3% 25.1%<br />
Accumulated Provision as a % of loans & Advances 9.6% 10.9% 8.6% 4.3% 9.9% 8.2% 5.3% 5.1%<br />
Return on Equity (average) 3.6% 3.4% 21.2% 15.8% -2.5% 6.5% 9.6% 13.4%<br />
Return on Assets (average) 0.7% 0.6% 2.4% 2.3% -0.5% 1.5% 1.8% 2.0%<br />
Non-interest income to total income 72.3% 48.7% 51.9% 43.9% 48.6% 39.0% 43.3% 42.4%<br />
Provision expense as a % of advances 5.4% 2.2% 1.4% 1.5% 6.8% 2.6% 2.4% 1.3%<br />
Advances to equity 116.1% 194.0% 394.7% 147.5% 232.4% 259.8% 364.9% 420.9%<br />
8
EQUITY RESEARCH<br />
PAN-AFRICAN<br />
DECEMBER <strong>2011</strong><br />
BANKING<br />
Headquartered in Togo, Ecobank Transnational<br />
Incorporated (ETI), a public limited liability company,<br />
was established as a bank holding company in 1985<br />
under a private sector initiative spearheaded by the<br />
Federation of West African Chambers of Commerce and<br />
Industry with the support of ECOWAS, in a bid to try<br />
and break the dominance of foreign and state owned<br />
banks in West Africa. ETI commenced operations with<br />
its first subsidiary in Togo in March 1988. Today, ETI is<br />
a full-service regional banking institution employing<br />
over 11,000 staff in 755 branches and offices in thirty<br />
SSA countries, namely Benin, Burkina Faso, Burundi,<br />
Cape Verde, Cameroon, Central African Republic, Chad,<br />
Congo Brazzaville, DRC, Côte d'Ivoire, Gabon, The<br />
Gambia, Ghana, Guinea, Guinea Bissau, Kenya, Liberia,<br />
Malawi, Mali, Niger, <strong>Nigeria</strong>, Rwanda, Sao Tome &<br />
Principe, Senegal, Sierra Leone, Tanzania, Togo,<br />
Uganda, Zambia and Zimbabwe.<br />
• A difficult year for Ecobank <strong>Nigeria</strong> in 2009, in line<br />
with the broader industry, which saw it record a loss<br />
before tax of USD 16.6m, as well as losses by the<br />
southern Africa cluster, led to attributable earnings<br />
declining by 45.78% to USD 51.1m for the group.<br />
• In its 9M 11 results to September, net interest income<br />
put on 16.16% as NIMs improved to USD 399.0m. Net<br />
fee and commission went up by 45.16%, while net<br />
trading income also recorded strong growth of<br />
64.79%. The CIR improved to 67.91% from 70.70%, and<br />
despite an increase in provision charges of 26.73% y-oy<br />
to USD 80.4m, attributable earnings closed the<br />
period at USD 106.6m, up 51.86%.<br />
• <strong>Nigeria</strong> has been an Achilles heel for ETI, where it has<br />
not really gained enough scale. To address this, ETI<br />
has taken over one of the rescued banks, Oceanic,<br />
which will substantially boost its market position.<br />
• Pre-Oceanic, we value ETI, based on a DCF valuation,<br />
at US 10.8c per share, representing upside of 68.2%<br />
against the US 6.42c it currently trades at on its most<br />
liquid listing in <strong>Nigeria</strong>. A coverage based PBV average<br />
based on the last published post merger pro-forma<br />
accounts suggests a valuation of US 10.3c per share.<br />
BUY.<br />
Recommendation<br />
BUY<br />
Bloomberg Code<br />
ETI:NL<br />
Current Price (USc) - BRVM 8.0<br />
Current Price (USc) - GSE 6.8<br />
Current Price (USc) - NSE 6.6<br />
Target Price (USc) 10.8<br />
Upside (%) - On most liquid listing (NSE) 64.6<br />
Liquidity (NSE)<br />
Market Cap (USD 000s) 636 596<br />
Shares (000) 9 913 368<br />
Free Float (est. %) 60.0<br />
Ave. daily vol ('000) - 1 yr. 2 155<br />
Price Performance (NSE)<br />
Price, 12 months ago (USD) 9.5<br />
Change (%) (30.8)<br />
Price, 6 months ago (USD) 9.4<br />
Change (%) (30.0)<br />
Financials (USD 000s) 31 Dec F2010 <strong>2011</strong>F 2012F<br />
Loans & Advances 5 264 184 5 987 738 6 761 634<br />
Net Interest Income (excl. Provisions) 474 771 548 990 728 058<br />
Non-Interest Income 424 872 539 036 670 772<br />
Attributable Earnings 112 716 154 313 209 343<br />
EPS (USD) 1.1 1.6 2.5<br />
DPS (USD) 0.4 0.5 0.9<br />
NAV/Share (USD) 13.0 13.9 15.2<br />
Valuation Ratios Current <strong>2011</strong>F 2012F<br />
Earnings Yield* (%) 23.4 19.4 30.7<br />
Dividend Yield (%) 6.8 10.8 12.8<br />
PE* (x) 4.3 4.1 3.0<br />
PBV (x) 0.47 0.46 0.42<br />
RoaA (%) 1.2 1.4 1.6<br />
RoaE (%) 8.9 11.6 14.5<br />
Net Interest Margin (%) 6.8 7.2 8.0<br />
Cost to Income Ratio (%) 69.9 68.6 67.2<br />
* - trailing<br />
1.5<br />
1.4<br />
1.3<br />
ETI vs NSE ASI (Rebased)<br />
Strengths<br />
Largest pan-African geographical reach<br />
Robust cross border IT system/network<br />
Weaknesses<br />
Rollout costs have kept CIR higher than targets<br />
<strong>Nigeria</strong> has historically been a challenge in terms of<br />
1.2<br />
1.1<br />
1<br />
Strategic alliances with Bank of China, Nedbank<br />
and Old M utual<br />
consolidating market position, that situation prevails in eg Kenya<br />
High NPL ratios in East Africa<br />
0.9<br />
0.8<br />
0.7<br />
0.6<br />
Oppo rtunities<br />
<strong>Nigeria</strong> and Ghana acquisitions should see an<br />
improved performance in those markets<br />
T hreats<br />
Any challenges around integrating Ecobank <strong>Nigeria</strong> and Oceanic<br />
could negatively impact the time to realise synergies<br />
0.5<br />
17-Nov-10<br />
17-Dec-10<br />
17-Jan-11<br />
17-Feb-11<br />
17-Mar-11<br />
17-Apr-11<br />
ETI<br />
17-May-11<br />
17-Jun-11<br />
NSE ASI<br />
17-Jul-11<br />
17-Aug-11<br />
17-Sep-11<br />
17-Oct-11<br />
17-Nov-11<br />
Consolidation of other African operations as<br />
Increased regulatory risk due to cross border expansion<br />
expansion slows down<br />
Skills acquisition and retention across such a wide<br />
Will benefit from drive for increased intra regional trade geographical spread<br />
9
USD 000's<br />
USD 000's<br />
FY 10 & 9M 11 Financial & Operational Review<br />
The turmoil in the <strong>Nigeria</strong>n banking sector in 2009 had a<br />
negative impact on the group’s results for that financial<br />
year, as Ecobank <strong>Nigeria</strong>, a material component of the<br />
group, recorded a USD 16.6m loss before taxation, a<br />
number which was exacerbated by the depreciation of<br />
the naira. The southern Africa cluster also recorded a<br />
loss, having consisted of mainly new operations. The net<br />
result was that the group recorded an attributable<br />
earnings decline of 45.78% to USD 51.1m. A turnaround<br />
was observed in FY 10, despite <strong>Nigeria</strong> continuing to<br />
struggle.<br />
Net interest income for FY 10 recorded a 3.43% increase<br />
to USD 474.8m, as gross interest income fell 8.75% against<br />
a fall of 27.09% in the interest expense as yields fell in<br />
some of its markets, notably <strong>Nigeria</strong>, but this was offset<br />
by an increase in low cost deposits.<br />
Net non-interest income growth while positive, was also<br />
muted at just 2.55% to USD 424.9m. Gains in net fees and<br />
commissions, cash management, credit and corporate<br />
finance fees were tempered by a fall in trading and lease<br />
income during the year. Operating profit thus increased<br />
by 3.01% to USD 899.6m. Operating expenses were kept<br />
flat in FY 10, actually falling marginally by 0.54% to USD<br />
629.2m. Staff costs were up just 2.63% to USD 265.4m, as<br />
headcount was reduced by 1,000. Depreciation costs<br />
increased 11.74% as other operating expenses shed 5.58%.<br />
The provision charge fell by almost a third to USD<br />
101.5m, improved credit conditions across all markets<br />
offsetting gross provision increases of 7% and 15% in the<br />
WAMZ and CEMAC clusters. <strong>Nigeria</strong> accounted for 71% of<br />
the provisions, ahead of the anticipated sale to AMCON of<br />
loans in <strong>2011</strong>. The decline in provision charges led to net<br />
operating income accelerating by 67.21% to USD 169.0m.<br />
1 200 000<br />
1 000 000<br />
800 000<br />
600 000<br />
400 000<br />
200 000<br />
0<br />
2005 2007 2008 2009 2010 <strong>2011</strong> E 2012 E<br />
Attributable Earnings<br />
Total Operating Income<br />
Source: ETI/IAS<br />
12 000 000<br />
10 000 000<br />
8 000 000<br />
6 000 000<br />
4 000 000<br />
2 000 000<br />
0<br />
2005 2007 2008 2009 2010 <strong>2011</strong> E 2012 E<br />
Deposits Loans & Advances<br />
Source: ETI/IAS<br />
180 000<br />
160 000<br />
140 000<br />
120 000<br />
100 000<br />
80 000<br />
60 000<br />
40 000<br />
20 000<br />
0<br />
Share of associate income was an immaterial USD 36,000,<br />
and PBT rose 67.24% to USD 169.0m. Without adverse<br />
currency movements, ETI estimates PBT would have been<br />
USD 177.0m. Attributable earnings, on the back of a<br />
decline in the effective tax rate, were up 120.7% to USD<br />
112.7m. <strong>Nigeria</strong> and East Africa recorded attributable<br />
losses for the period, while all others closed in the black.<br />
EPS was US 1.14c, up from US 0.52c in FY 09. DPS was US<br />
0.4c from US 0.3c.<br />
Total assets were up 16.21% to USD 10.5bn, dominated by<br />
the West African region with a combined 81%. Net loans<br />
and advances were up 10.45% to USD 5.3bn, while<br />
investment in securities was 76.38% higher at USD<br />
893.1m, being the notable movements on the asset side.<br />
The NPL ratio improved slightly to 15.2% by year end (FY<br />
09: 16.0%), attributed to improved book quality and<br />
recoveries. The <strong>Nigeria</strong> and East Africa clusters<br />
dominated NPLs, with 31.5% and 15.8% respectively. Total<br />
deposits were up 20.08% to USD 8.3bn, with savings and<br />
current accounts making up 75% of the total. The LDR fell<br />
y-o-y as deposits grew at a slower rate than advances to<br />
68.6% from 73.4%. RoAE and ROAA recovered to 8.9% (FY<br />
09: 4.3%) and 1.2% (FY 09: 0.6%), respectively.<br />
ETI 9M 11 Results Summary ('000s) 30-Sep-11 30-Sep-10<br />
Net interest income 398 905 343 410<br />
Net fee and comission income 263 349 181 425<br />
Other Income 142 039 94 426<br />
Operating income 804 293 619 261<br />
Non-interest expense (546 171) (437 790)<br />
Allowance for credit impairment (80 435) (63 471)<br />
Operating profit 177 687 118 000<br />
Attributable earnings 106 641 70 222<br />
30-Sep-11 30-Jun-11<br />
Loans and advances to customers 5 722 974 5 478 700<br />
Deposits from customers 8 910 796 8 995 399<br />
Total equity 1 332 921 1 351 113<br />
Source: ETI/IAS<br />
10
In its 9M 11 results to September, ETI continued to gain<br />
from margin improvements on interest income, as net<br />
interest income put on 16.16% to USD 399.0m, with NIMs<br />
up 60bp y-o-y but up by 30bp compared to H1 11, to<br />
6.2%. Fee and commission income gained 49.06% to USD<br />
278.9m, and net fee and commission went up by 45.16%<br />
to USD 263.3m, diluted by the 2.74x increase in fee and<br />
commission expense. While lease, dividend and other<br />
operating income were down y-o-y, their drop was more<br />
than compensated for by the 64.79% increase in net<br />
trading income to USD 131.6m. Operating income for the<br />
period was up 29.88% to USD 804.3m.<br />
Operating expenses saw a steep increase of 24.76% to USD<br />
546.2m, with staff costs going up by 22.77% to USD<br />
251.4m and other expenses rising by 31.66% to USD<br />
240.5m. Increased levels of compensation were said to be<br />
the main driver of the staff cost increase, while<br />
expansion and inflation drove other expenses growth.<br />
With revenues growing ahead of expenses growth,<br />
however, the cost to income ratio improved to 67.91%<br />
from 70.70%.<br />
Provision charges registered an increase y-o-y of 26.73%<br />
to USD 80.4m, a function of a growing loan book and<br />
management’s decision to be conservative with<br />
provisioning to boost reserves. All the regional clusters<br />
recorded a decrease in the charge with the exception of<br />
Francophone West Africa, which saw a 116% rise driven by<br />
high increases in Burkina Faso, Togo, Cote d’Ivoire and<br />
Mali. Management points out that the possibility of<br />
significant write backs come the year end exists due to a<br />
large proportion of “discretionary” provisions. PBT<br />
increased by 50.58% to USD 177.7m and attributable<br />
earnings closed the period at USD 106.6m, up 51.86%. EPS<br />
for the period was US 1.08c, up from US 0.71c. The retail<br />
banking arm, or ‘Domestic’ business was the worst<br />
performer, with a PBT contribution of USD 6.4m, while<br />
the Corporate banking business contributed USD 96.3m<br />
and Ecobank Capital contributed USD 72.1m.<br />
The balance sheet was flat quarter on quarter, up just<br />
0.97% to USD 11.9bn. Loans and advances to customers<br />
went up by 4.46% to USD 5.7bn, with holdings of treasury<br />
bills down 17.63% to USD 650.2m and trading assets down<br />
40.83% to USD 9.8m. The NPL ratio improved to 5.7% from<br />
13.6% at 9M 10 and 7.2% at H1 11. This was attributed to<br />
more NPL sales to AMCON, (customer loans in <strong>Nigeria</strong><br />
actually down y-o-y), and the aforementioned prudent<br />
approach to lending, as well as write offs.<br />
Customer deposits, like loans and advances, were largely<br />
unchanged q-to-q, shedding 0.94% to USD 8.9bn, with the<br />
focus remaining on growing the low cost current and<br />
savings accounts, which were marginally higher at 77.74%<br />
of deposits compared with 77.0% at half year. The LDR<br />
was 64% compared with 61% at H1 11, while the CAR<br />
ended the period at 19.5%, unchanged from the H1 11<br />
position.<br />
Outlook<br />
Having hitherto been on an aggressive growth drive,<br />
ETI notes that bar another 5-6 countries, its<br />
geographical expansion programme is reaching the tail<br />
end. We expect that as the group moves into a<br />
consolidation phase, it should begin to realise more<br />
benefits from its diversified earnings base, while the<br />
CIR should start to trend downwards. Opportunities<br />
for cross border trade activity should also increase,<br />
especially as the continent is encouraged to push for<br />
more intra-regional trading.<br />
ETI has always targeted being in the top 3 banks in<br />
countries where it is present. While achieving this in<br />
roughly half of its markets, this has not been the case<br />
in the key <strong>Nigeria</strong>n market. Extended talks to merge<br />
with First Bank collapsed, but following the banking<br />
crisis, ETI identified one of the wounded, Oceanic<br />
Bank, for acquisition. ETI on 24 October confirmed its<br />
100% acquisition of Oceanic. This was the first stage<br />
of the transaction, with the second set to be the<br />
merger of Oceanic with Ecobank <strong>Nigeria</strong> and the third<br />
the provision of additional capital by ETI to bring the<br />
minimum CAR of the new entity to 16%. The total<br />
transaction consideration saw: AMCON invest NGN<br />
290bn in Oceanic to bring its NAV to zero and ETI<br />
paying NGN 55bn to Oceanic shareholders. The NGN<br />
55bn was split 70% into c2.5m ETI ords and 30% as<br />
c1.1m participating cumulative prefs. This will<br />
achieve ETI’s goal of becoming a tier 1 bank in<br />
<strong>Nigeria</strong>, creating a bank with over 600 branches and<br />
1,450 ATMs. ETI recently announced that strategic<br />
partner Nedbank had provided it with a USD 285m 3yr<br />
convertible facility which Nedbank can choose to<br />
exercise between 24 and 36 months’ time to become<br />
a 20% shareholder in ETI (valuation implications are<br />
obvious). No further details of the facility were<br />
availed, although part of the funds will go towards the<br />
Oceanic acquisition. If the conversion does occur, this<br />
should prove positive for both parties.<br />
Aside from the <strong>Nigeria</strong> expansion, ETI also hoped to<br />
conclude the acquisition of Trust Bank in Ghana in Q4.<br />
However, it seems some local opposition to the<br />
transaction may delay the conclusion, with the BoG<br />
having set up a panel to look into the concerns.<br />
Valuation and Recommendation<br />
Pre-Oceanic, we value ETI, based on a DCF valuation,<br />
at US 10.8c per share, representing upside of 68.2%<br />
against the US 6.42c it currently trades at on its most<br />
liquid listing in <strong>Nigeria</strong>. (Upside is 34.46% on the BRVM<br />
and 58.95% on the GSE). A coverage based PBV<br />
average based on the last published post merger proforma<br />
accounts suggests a valuation of US 10.3c per<br />
share. While there do appear to be arbitrage<br />
opportunities across markets, the length of the<br />
process involved in moving shares across registers<br />
largely makes the trade unattractive as prices could<br />
move against one very quickly. BUY.<br />
11
Financial Summary<br />
Income Statement Summary 2005 A 2006 A 2007 A 2008 A 2009 A 2010 A <strong>2011</strong> E 2012 E<br />
Net Interest Income Before Loss Provision 109 284 181 403 278 077 390 401 459 027 474 771 548 990 728 058<br />
Y-o-Y Growth 66.0% 53.3% 40.4% 17.6% 3.4% 15.6% 32.6%<br />
Non Interest Income 127 067 167 061 265 910 435 723 414 291 424 872 539 036 670 772<br />
Y-o-Y Growth 31.5% 59.2% 63.9% (4.9%) 2.6% 26.9% 24.4%<br />
Total Operating Income (incl Prov) 221 453 335 373 524 839 713 053 733 660 798 170 1 004 314 1 289 543<br />
Y-o-Y Growth 51.4% 56.5% 35.9% 2.9% 8.8% 25.8% 28.4%<br />
Operating Expense (147 724) (206 074) (334 269) (550 812) (632 594) (629 180) (746 521) (939 808)<br />
Y-o-Y Growth 39.5% 62.2% 64.8% 14.8% (0.5%) 18.6% 25.9%<br />
Profit Before Tax 73 729 129 299 190 570 162 385 101 066 169 026 257 833 349 779<br />
Y-o-Y Growth 75.4% 47.4% (14.8%) (37.8%) 67.2% 52.5% 35.7%<br />
Attributable Net Income/Profit After Tax 41 502 69 350 107 373 94 195 51 075 112 716 154 313 209 343<br />
Y-o-Y Growth 67.1% 54.8% (12.3%) (45.8%) 120.7% 36.9% 35.7%<br />
Balance Sheet Summary 2005 A 2006 A 2007 A 2008 A 2009 A 2010 A <strong>2011</strong> E 2012 E<br />
Cash & Short term Funds 660 731 863 270 1 812 637 2 805 344 2 282 396 2 739 544 2 396 502 2 622 077<br />
Y-o-Y Growth 30.7% 110.0% 54.8% (18.6%) 20.0% (12.5%) 9.4%<br />
Financial Assets held for Trading 261 171 137 502 557 776 427 422 539 036 595 725 720 158 799 191<br />
Y-o-Y Growth (47.4%) 305.6% (23.4%) 26.1% 10.5% 20.9% 11.0%<br />
Loans & Advances,Net 1 022 140 1 919 366 3 117 036 3 754 206 4 766 197 5 264 184 5 987 738 6 761 634<br />
Y-o-Y Growth 87.8% 62.4% 20.4% 27.0% 10.4% 13.7% 12.9%<br />
Deposits 1 672 278 2 623 822 5 176 993 6 227 160 6 951 655 8 347 887 9 683 467 10 895 007<br />
Y-o-Y Growth 56.9% 97.3% 20.3% 11.6% 20.1% 16.0% 12.5%<br />
Borrowings 25 977 50 660 216 298 345 157 253 902 225 975 406 755 366 080<br />
Y-o-Y Growth 95.0% 327.0% 59.6% (26.4%) (11.0%) 80.0% (10.0%)<br />
Shareholder's Equity 303 879 482 315 651 760 1 157 622 1 235 565 1 292 610 1 374 413 1 511 296<br />
Y-o-Y Growth 58.7% 35.1% 77.6% 6.7% 4.6% 6.3% 10.0%<br />
Per Share Data 2005 A 2006 A 2007 A 2008 A 2009 A 2010 A <strong>2011</strong> E 2012 E<br />
Earning per Share (kobo) 10.3 11.4 1.6 1.1 0.5 1.1 1.6 2.5<br />
Y-o-Y Growth 9.7% (86.0%) (32.3%) (52.2%) 120.7% 36.9% 58.7%<br />
Dividend Per Share (kobo) 3.00 3.00 0.40 0.20 0.30 0.40 0.54 0.86<br />
Y-o-Y Growth 0.0% (86.7%) (50.0%) 50.0% 33.3% 36.2% 58.7%<br />
Book Value Per Share (kobo) 75.7 78.9 9.7 13.3 12.5 13.0 13.9 15.2<br />
Y-o-Y Growth 4.2% (87.7%) 37.0% (6.0%) 4.6% 6.3% 10.0%<br />
Tangible Book Value per share (kobo) 75.7 78.5 9.5 13.1 12.3 12.9 13.7 15.1<br />
Y-o-Y Growth 3.6% (87.9%) 37.8% (5.9%) 4.6% 6.4% 10.1%<br />
Key Ratios 2005 A 2006 A 2007 A 2008 A 2009 A 2010 A <strong>2011</strong> E 2012 E<br />
Gross Loan to Deposit Ratio 66.7% 76.8% 62.7% 63.6% 73.4% 68.6% 67.0% 67.2%<br />
Gross Loan to Fund Ratio 65.7% 75.4% 59.3% 60.2% 70.7% 66.7% 64.3% 65.0%<br />
Net Interest Income to total income 49.3% 54.1% 53.0% 54.8% 62.6% 59.5% 54.7% 56.5%<br />
Cost to Income Ratio 62.5% 59.1% 61.4% 66.7% 72.4% 69.9% 68.6% 67.2%<br />
Interest Income to average interest earning assets 7.2% 9.0% 9.0% 10.2% 9.4% 7.6% 8.1% 9.2%<br />
Interest expense to average interest bearing liabilities 2.7% 3.1% 3.7% 5.3% 4.4% 2.8% 3.4% 3.6%<br />
Net Interest Spread 4.5% 5.9% 5.3% 4.8% 5.0% 4.8% 4.7% 5.6%<br />
Net Income Margin 18.7% 20.7% 20.5% 13.2% 7.0% 14.1% 15.4% 16.2%<br />
Accumulated Provision as a % of loans & Advances 8.4% 4.8% 3.9% 5.2% 6.6% 8.1% 7.8% 7.7%<br />
Return on Equity (average) 13.7% 17.6% 18.9% 10.4% 4.3% 8.9% 11.6% 14.5%<br />
Return on Assets (average) 1.9% 2.4% 2.1% 1.3% 0.6% 1.2% 1.4% 1.6%<br />
Non-interest income to total income 57.4% 49.8% 50.7% 61.1% 56.5% 53.2% 53.7% 52.0%<br />
Provision expense as a % of advances 1.3% 0.6% 0.6% 2.9% 2.7% 1.8% 1.6% 1.8%<br />
Advances to equity 336.4% 397.9% 478.2% 324.3% 385.8% 407.3% 435.7% 447.4%<br />
12
EQUITY RESEARCH<br />
NIGERIA<br />
DECEMBER <strong>2011</strong><br />
BANKING<br />
First established as City Securities Ltd in 1977, First<br />
City Merchant Bank, was licensed in 1982, becoming<br />
the first local bank in <strong>Nigeria</strong> to be established without<br />
government support. In 2001, the bank changed its<br />
name from First City Merchant Bank to First City<br />
Monument Bank, FCMB, as it transformed into a<br />
universal bank. A private placement of shares raised<br />
over NGN 7bn, followed by the conversion to a public<br />
liability company in 2004, whereupon it listed on the<br />
NSE. In the bank consolidation phase in the mid-2000s,<br />
FCMB acquired Cooperative Development Bank, Midas<br />
Bank and <strong>Nigeria</strong>n American Bank (former <strong>Nigeria</strong>n<br />
subsidiary of Bank Boston), and went from 26 branches<br />
to 150 branches by 2007. FCMB currently has a<br />
network of 149 branches and cash centres and 150<br />
ATMs.<br />
• FY 10 recorded a strong rebound in earnings, with the<br />
bottom line rising to NGN 7.9bn from an annualised<br />
NGN 847m in FY 09. The result was driven by nonfunded<br />
income growth of 59.39% to NGN 18.1bn, as<br />
net interest income actually declined during the year<br />
by 10.39% to NGN 21.9bn, as well as an improved CIR<br />
and a net provision write back position.<br />
• Contrastingly, it was the funded income line that<br />
drove revenues in the 9M 11 results, up 40.58% on a<br />
net basis to NGN 22.2bn, while non-interest income<br />
recorded an increase of 28.94%. The CIR further<br />
improved to 64.89% and attributable earnings closed<br />
the period at NGN 7.9bn, up 72.81%.<br />
• With its retail unit only just having broken even in Q3<br />
11, FCMB has sought to strengthen its position in the<br />
sector via the acquisition of one of the rescued banks,<br />
FinBank.<br />
• Our DCF valuation for FCMB comes out at NGN 9.56<br />
per share, substantially above its current share price<br />
of NGN 3.78. This is a pre-M&A valuation, and a<br />
coverage based PBV average based on the last<br />
published post merger pro-forma accounts suggests a<br />
valuation of NGN 7.99 per share. BUY.<br />
Recommendation<br />
BUY<br />
Bloomberg Code<br />
FCMB:NL<br />
Current Price (NGN) 3.8<br />
Current Price (USc) 2.3<br />
Target Price (NGN) 9.6<br />
Target Price (USc) 5.9<br />
Upside (%) 152.9<br />
Liquidity<br />
Market Cap (NGN m) 61 505<br />
Shares (m) 16 271<br />
Free Float (est. %) 72.4<br />
Ave. daily vol ('000) - 1 yr. 4 880<br />
Price Performance<br />
Price, 12 months ago (NGN) 7.8<br />
Change (%) (51.5)<br />
Price, 6 months ago (NGN) 7.8<br />
Change (%) (51.5)<br />
Financials (NGN m) 31 Dec F2010 <strong>2011</strong>F 2012F<br />
Loans & Advances 330 421 367 156 409 402<br />
Net Interest Income (excl. Provisions) 21 934 31 116 39 575<br />
Non-Interest Income 18 080 19 404 23 553<br />
Attributable Earnings 7 935 11 099 17 442<br />
EPS (NGN) 48.8 68.2 107.2<br />
DPS (NGN) 35.0 40.9 64.3<br />
NAV/Share (NGN) 828.3 870.8 947.8<br />
Valuation Ratios Current <strong>2011</strong>F 2012F<br />
Earnings Yield* (%) 18.3 18.0 28.4<br />
Dividend Yield (%) 9.3 10.8 17.0<br />
PE* (x) 5.5 5.5 3.5<br />
PBV (x) 0.45 0.43 0.40<br />
RoaA (%) 1.6 1.9 2.5<br />
RoaE (%) 6.0 8.0 11.8<br />
Net Interest Margin (%) 5.3 5.2 5.8<br />
Cost to Income Ratio (%) 78.7 61.8 57.2<br />
* - trailing<br />
1.5<br />
1.4<br />
1.3<br />
1.2<br />
1.1<br />
1<br />
0.9<br />
0.8<br />
0.7<br />
0.6<br />
0.5<br />
0.4<br />
0.3<br />
FCMB vs NSE ASI (Rebased)<br />
Strengths<br />
Weaknesses<br />
Investment and corporate banking<br />
Wholesale roots have meant interest margins lagged some peers<br />
High CAR<br />
Retai bank was loss making<br />
Early foray into microlending<br />
Relatively small branch network<br />
Oppo rtunities<br />
T hreats<br />
Large market for microlending<br />
Operational issues if they arise could delay business combination<br />
Acquisition to give more scale and increase potential customer base completion<br />
Cross selling opportunities Continued slump on NSE to retard investment banking earnings<br />
17-Nov-11<br />
17-Oct-11<br />
17-Sep-11<br />
17-Aug-11<br />
17-Jul-11<br />
17-Jun-11<br />
17-May-11<br />
17-Apr-11<br />
17-Mar-11<br />
17-Feb-11<br />
17-Jan-11<br />
17-Dec-10<br />
17-Nov-10<br />
FCMB<br />
NSE ASI<br />
13
NGN (m)<br />
NGN (m)<br />
FY 10 & 9M 11 Financial & Operational Review<br />
A relatively marginal return in the 8 month period to Dec<br />
09 of NGN 564.3m was recorded, as non-interest income<br />
fell sharply, with transactional banking in particular hard<br />
hit, driven by a decline in loans and advances and<br />
deposits as the group sort to consolidate and restructure<br />
its balance sheet following 2009’s banking sector turmoil.<br />
50 000<br />
45 000<br />
40 000<br />
35 000<br />
30 000<br />
16 000<br />
14 000<br />
12 000<br />
10 000<br />
As with many of its peers, a strong rebound in earnings<br />
was witnessed in FY 10. Comparing the annualised 8M 09<br />
earnings to FY 10, net interest income for the latter was<br />
down 10.39% to NGN 21.9bn, with interest income up<br />
4.97% to NGN 43.6bn, strongly overshadowed by the<br />
26.98% increase in interest expense to NGN 21.7bn.<br />
Interest margins fell to a reported 5.3% from 6.0% y-o-y,<br />
attributed to market rates coming off, a focus on lower<br />
risk higher quality credit and treasury losses in Q1.<br />
Net non-interest income growth more than offset the<br />
negative funded income performance, putting on 59.39%<br />
to NGN 18.1bn. This was driven by higher transaction<br />
commissions as lending activity increased in earnest,<br />
while trading and dividend income in particular had a<br />
massive year although from a low base, generating NGN<br />
3.7bn from an annualised NGN 304.5m. Operating income<br />
increased accordingly by 11.71% to NGN 40.0bn.<br />
25 000<br />
20 000<br />
15 000<br />
10 000<br />
5 000<br />
0<br />
2005 2007 2008 2009 2010 <strong>2011</strong> E 2012 E<br />
Attributable Earnings Total Operating Income<br />
Source: FCMB/IAS<br />
400 000<br />
350 000<br />
300 000<br />
250 000<br />
8 000<br />
6 000<br />
4 000<br />
2 000<br />
0<br />
Costs were well contained, up just 2.96% y-o-y to NGN<br />
31.5bn, with staff expenses falling by 2.8% to NGN 14.3bn<br />
while directors’ emoluments were 30.7% lower at NGN<br />
627.9m. The focus on costs saw the cost to income ratio<br />
improving to a still high 78.67% compared with 85.35%.<br />
Provisions went from a charge of NGN 4.0bn to a net<br />
write back position of NGN 439.4m due to good recoveries<br />
combined with a higher quality book as well as AMCON<br />
sales. All the above factors led to net operating income<br />
going up seven-fold to NGN 9.0bn.<br />
After accounting for NGN 51.0m in associate income and<br />
a fall in the effective tax rate from 34.1% to 12.1%,<br />
attributable earnings rose to NGN 7.9bn from NGN 847m.<br />
This translated to EPS for the year of 48.8 kobo compared<br />
to an annualised 7.8 kobo while dividend per share was 35<br />
kobo, up from 7.5 kobo in the prior year.<br />
Total assets were up 16.17% to NGN 538.6bn, with net<br />
loans and advances surging northwards, up 37.73% to NGN<br />
330.4bn, while investment securities also reflected a<br />
large increase, up 53.43% to NGN 76.7bn. Having<br />
reassessed and consolidated its balance sheet in FY 09,<br />
FCMB in FY 10 grew the book aggressively in a bid to<br />
regain market share and increase the mix of higher risk<br />
assets to the portfolio, although still mainly targeted at<br />
the wholesale (and hence lower margin) market. The NPL<br />
ratio fell further to 5.5% from 8.7%, benefiting from<br />
margin loan sales to AMCON of NGN 9bn. Deposit growth<br />
was 19.92% to NGN 335.4bn, with a bias to more<br />
expensive term deposits (52.0% of total) at year end. The<br />
LDR was just shy of 100% from 85.3%. A CAR of 31% (FY<br />
09: 36%) suggested loan levels were sustainable. RoAE and<br />
RoAA closed at 5.8% and 1.6% respectively.<br />
200 000<br />
150 000<br />
100 000<br />
50 000<br />
0<br />
2005 2007 2008 2009 2010 <strong>2011</strong> E 2012 E<br />
Deposits Loans & Advances<br />
Source: FCMB/IAS<br />
FCMB Q3 11 Results Summary (m) 30-Sep-11 30-Sep-10<br />
Net interest income 22 161 15 764<br />
Other Income 15 603 12 101<br />
Operating income 37 763 27 865<br />
Non-interest expense (24 504) (23 535)<br />
Allowance for credit impairment (3 375) 1 771<br />
Operating profit 9 885 6 101<br />
Attributable earnings 7 908 4 576<br />
30-Sep-11 30-Jun-11<br />
Loans and advances to customers 318 912 304 837<br />
Deposits from customers 370 977 362 818<br />
Total equity 136 983 134 394<br />
Source: FCMB<br />
14
FCMB’s 9M 11 results to September reflected a slowdown<br />
in impetus from both the FY 10 rates of growth, which<br />
would be expected however given the higher base effect,<br />
as well as relative to H1 11. Gross earnings were up<br />
23.45% to NGN 55.0bn. Interest income drove revenue<br />
growth, increasing by 40.58% on a net basis to NGN<br />
22.2bn, as interest and discount income growth of 21.40%<br />
y-o-y well exceeded that of interest expense at 3.28%.<br />
NIMs were marginally down to 6.8% compared with 6.9%<br />
at 9M 10 and H1 11, as deposits grew ahead of advances<br />
in an environment of margin pressure.<br />
Non-interest income recorded an increase of 28.94% to<br />
NGN 15.6bn, hampered by a 15.86% fall in corporate<br />
finance fees as commissions went up by 95.56%, trading<br />
income by 10.93% and other income by 82.72%. Operating<br />
income increased by 35.52% to NGN 37.8bn y-o-y, and<br />
5.84% q-o-q.<br />
Operating expenses remained well shackled, up by just<br />
4.12% to NGN 24.5bn, leading to a massive improvement<br />
in the cost to income ratio from 84.46% to 64.89% on a y-<br />
o-y comparison, while the improvement from H1 11 was<br />
from 65.79%.<br />
Y-o-y provisions went from a net NGN 1.8bn written back<br />
to a charge of NGN 3.4bn. The NPL ratio still improved,<br />
however, following further AMCON sales, to 4.32% from<br />
5.52% at the year end. PBT went up by 62.01% y-o-y, with<br />
attributable earnings closing the period at NGN 7.9bn, an<br />
increase of 72.81%. Earnings at the half year stood at NGN<br />
5.3bn.<br />
Balance sheet growth was 3.84% from H1 11, with total<br />
assets at NGN 611.1bn. This was as a result of the AMCON<br />
sales diluted 4.62% increase in net loans and advances to<br />
NGN 318.9bn, as well as the 14.30% increase in<br />
investment securities to NGN 151.0bn. The advances book<br />
continued to be dominated by corporates, reflecting the<br />
bank’s wholesale roots, with just 19% of gross loans to<br />
retail customers, slightly up from 18% at the half year.<br />
While this makes the book lower risk, it obviously limits<br />
the extent to which loans can be repriced as the<br />
corporates would carry a lower risk profile while lending<br />
in that space is more competitive. The group also noted<br />
that there was a deliberate move to boost off balance<br />
sheet activities (up 94.24% from FY 10 to NGN 126.7bn) so<br />
as to limit the impact of the 0.3% AMCON levy which is<br />
based on total assets. As aforementioned, there was<br />
further improvement in the NPL ratio, while the coverage<br />
ratio declined to 104% from 114% at H1, a function of<br />
AMCON sales and attendant write-offs. The group had<br />
exposure to Zenon, which was expected to be resolved in<br />
Q4, with FCMB anticipating a 25% haircut on its AMCON<br />
sale.<br />
Customer deposits growth remained measured, up 2.25%<br />
to NGN 371.0bn, as the group maintained its strategy to<br />
realign the deposit mix towards lower cost current and<br />
savings accounts, the NIM effects of which would be fully<br />
felt in FY 12. The CAR ended the period at 30.48%,<br />
slightly lower than the 31% at FY 10 and H1 11.<br />
Outlook<br />
With its retail unit only just having broken even in Q3<br />
11, FCMB, like Access Bank and indeed ETI, has sought<br />
to strengthen its position in the sector via acquisition.<br />
The banking crisis led to an opportunity to acquire<br />
FinBank, a transaction which has now been approved<br />
by both sets of shareholders and regulators. Under the<br />
terms of the merger, AMCON was to recapitalise<br />
FinBank to a zero NAV, via an injection of NGN<br />
155.6bn in financial accommodation. FCMB would<br />
then inject NGN 6bn as equity into the bank, via an<br />
SPV, giving it 100% ownership. The consideration paid<br />
by FCMB of NGN 6bn would be split between existing<br />
FinBank shareholders (NGN 1.64bn by way of 10 kobo<br />
per share or 1 FCMB share for every 60 existing shares<br />
held) and AMCON (NGN 4.36bn by way of NGN 1.02<br />
per share or 1 FCMB share for every 6 scheme shares<br />
held). FCMB would also set aside NGN 16bn in capital<br />
to ensure FinBank’s CAR is sufficient until the merger,<br />
which management expects to be concluded by the<br />
latest, in Q3 2012.<br />
The positives arising from this merger for FCMB are<br />
clear. The most obvious will be the transformation of<br />
the bank’s funding profile from a wholesale slant to<br />
retail, and the impact on reducing cost of funds. The<br />
merger will immediately double FCMB’s retail and<br />
commercial customer pool to c1.2m, give FCMB access<br />
to a growing base of mobile payment customers,<br />
estimated at 300,000 presently, create cross selling<br />
opportunities and of course, give it access to an<br />
increased branch network, going from 149 branches to<br />
333.<br />
Other pluses arising from the merger will see the<br />
combined entity’s financial leverage increasing by<br />
about 50%, cost synergies leading to over 30% cost<br />
savings, a fall in the LDR to 64% from 85% at the time<br />
the 9M results were released, an improvement in the<br />
liquidity ratio to 86% from 54% as well as proceeds<br />
from any disposal of non-core subsidiaries of FinBank.<br />
With a maximum shareholder dilution of just 2% for<br />
FCMB expected to arise from the transaction, the deal<br />
is expected to be accretive very quickly for FCMB,<br />
with accelerated synergy benefits manifesting in Q4<br />
2012.<br />
Valuation and Recommendation<br />
Our DCF valuation for FCMB comes out at NGN 9.56<br />
per share, which is substantially above its current<br />
share price of NGN 3.78. This is a pre-M&A valuation,<br />
with a coverage based PBV average based on the last<br />
published post merger pro-forma accounts suggests a<br />
valuation of NGN 7.99 per share. BUY.<br />
15
Financial Summary<br />
Income Statement Summary 2005 A 2006 A 2007 A 2008 A 2009 A 2010 A <strong>2011</strong> E 2012 E<br />
Net Interest Income Before Loss Provision 1 732 2 763 9 576 20 954 24 478 21 934 31 116 39 575<br />
Y-o-Y Growth 59.6% 246.5% 118.8% 16.8% (10.4%) 41.9% 27.2%<br />
Non Interest Income 2 761 5 635 10 338 22 624 11 344 18 080 19 404 23 553<br />
Y-o-Y Growth 104.1% 83.5% 118.8% (49.9%) 59.4% 7.3% 21.4%<br />
Total Operating Income (incl Prov) 3 721 8 376 18 402 40 418 31 860 40 454 45 968 59 304<br />
Y-o-Y Growth 125.1% 119.7% 119.6% (21.2%) 27.0% 13.6% 29.0%<br />
Operating Expense (2 628) (4 735) (10 833) (19 900) (30 575) (31 479) (31 225) (36 110)<br />
Y-o-Y Growth 80.2% 128.8% 83.7% 53.6% 3.0% (0.8%) 15.6%<br />
Profit Before Tax 1 093 3 641 7 569 20 517 1 285 9 026 14 799 23 256<br />
Y-o-Y Growth 233.1% 107.9% 171.1% (93.7%) 602.4% 64.0% 57.1%<br />
Attributable Net Income/Profit After Tax 798 2 833 5 949 15 091 847 7 935 11 099 17 442<br />
Y-o-Y Growth 255.1% 110.0% 153.7% (94.4%) 837.4% 39.9% 57.1%<br />
Balance Sheet Summary 2005 A 2006 A 2007 A 2008 A 2009 A 2010 A <strong>2011</strong> E 2012 E<br />
Cash & Short term Funds 26 768 65 744 116 486 203 221 130 797 70 719 35 913 39 851<br />
Y-o-Y Growth 145.6% 77.2% 74.5% (35.6%) (45.9%) (49.2%) 11.0%<br />
Financial Assets held for Trading - 5 735 1 855 - 20 088 23 704 28 919<br />
Y-o-Y Growth NA NA (67.6%) (100.0%) NA 18.0% 22.0%<br />
Loans & Advances,Net 11 818 19 975 84 129 188 931 239 898 330 421 367 156 409 402<br />
Y-o-Y Growth 69.0% 321.2% 124.6% 27.0% 37.7% 11.1% 11.5%<br />
Deposits 27 123 72 093 203 308 277 454 279 694 335 402 392 351 451 154<br />
Y-o-Y Growth 165.8% 182.0% 36.5% 0.8% 19.9% 17.0% 15.0%<br />
Borrowings 250 - 13 144 24 539 30 179 25 116 28 884 33 216<br />
Y-o-Y Growth (100.0%) NA 86.7% 23.0% (16.8%) 15.0% 15.0%<br />
Shareholder's Equity 7 216 25 155 31 104 133 651 129 593 134 771 141 689 154 211<br />
Y-o-Y Growth 248.6% 23.6% 329.7% (3.0%) 4.0% 5.1% 8.8%<br />
Per Share Data 2005 A 2006 A 2007 A 2008 A 2009 A 2010 A <strong>2011</strong> E 2012 E<br />
Earning per Share (kobo) 25.2 35.9 62.6 135.0 5.2 48.8 68.2 107.2<br />
Y-o-Y Growth 42.8% 74.3% 115.6% (96.1%) 837.4% 39.9% 57.1%<br />
Dividend Per Share (kobo) 7.50 13.00 35.00 50.00 5.00 35.00 40.93 64.32<br />
Y-o-Y Growth 73.3% 169.2% 42.9% (90.0%) 600.0% 16.9% 57.1%<br />
Book Value Per Share (kobo) 227.5 318.8 327.3 1 193.9 796.5 828.3 870.8 947.8<br />
Y-o-Y Growth 40.1% 2.7% 264.7% (33.3%) 4.0% 5.1% 8.8%<br />
Tangible Book Value per share (kobo) 227.5 318.8 327.3 1 193.9 759.1 790.9 833.5 910.4<br />
Y-o-Y Growth 40.1% 2.7% 264.7% (36.4%) 4.2% 5.4% 9.2%<br />
Key Ratios 2005 A 2006 A 2007 A 2008 A 2009 A 2010 A <strong>2011</strong> E 2012 E<br />
Gross Loan to Deposit Ratio 47.7% 37.7% 43.0% 70.5% 92.5% 104.3% 98.9% 96.7%<br />
Gross Loan to Fund Ratio 47.3% 37.7% 40.4% 64.8% 83.5% 97.0% 92.1% 90.1%<br />
Net Interest Income to total income 46.5% 33.0% 52.0% 51.8% 76.8% 54.2% 67.7% 66.7%<br />
Cost to Income Ratio 58.5% 56.4% 54.4% 45.7% 85.4% 78.7% 61.8% 57.2%<br />
Interest Income to average interest earning assets 8.0% 7.7% 8.7% 9.1% 9.6% 9.1% 10.1% 10.4%<br />
Interest expense to average interest bearing liabilities 6.0% 5.6% 3.5% 3.6% 5.6% 6.5% 6.9% 6.9%<br />
Net Interest Spread 2.1% 2.1% 5.2% 5.6% 4.0% 2.6% 3.2% 3.5%<br />
Net Income Margin 21.4% 33.8% 32.3% 37.3% 2.7% 19.6% 24.1% 29.4%<br />
Accumulated Provision as a % of loans & Advances 8.6% 22.6% 4.8% 3.4% 9.2% 4.2% 5.4% 6.2%<br />
Return on Equity (average) 11.1% 17.5% 21.1% 18.3% 0.6% 6.0% 8.0% 11.8%<br />
Return on Assets (average) 1.6% 3.6% 3.2% 4.1% 0.2% 1.6% 1.9% 2.5%<br />
Non-interest income to total income 74.2% 67.3% 56.2% 56.0% 35.6% 44.7% 42.2% 39.7%<br />
Provision expense as a % of advances 4.5% 0.9% 1.9% 1.6% 0.8% (0.2%) 1.2% 1.0%<br />
Advances to equity 163.8% 79.4% 270.5% 141.4% 185.1% 245.2% 259.1% 265.5%<br />
16
EQUITY RESEARCH<br />
NIGERIA<br />
DECEMBER <strong>2011</strong><br />
BANKING<br />
Founded in 1894, First Bank of <strong>Nigeria</strong> Plc (FBN) is one<br />
of the largest banks in <strong>Nigeria</strong> and indeed in West<br />
Africa. With over 685 branches as at Q3 11, the group<br />
has one of the largest branch networks in <strong>Nigeria</strong>. In<br />
2002, FBN established a wholly owned banking<br />
subsidiary in the United Kingdom, FBN Bank (UK)<br />
Limited. In 2007, FBN Bank (UK) set up its Paris office<br />
to serve as a marketing base to service francophone<br />
West Africa. FBN also has a representative office in<br />
South Africa and has obtained a licence to open a<br />
representative office in China. The group comprises 10<br />
subsidiaries, spanning asset management, investment<br />
banking, capital markets, insurance, microfinance,<br />
private equity, mortgage and pension fund custodian<br />
services.<br />
• One of <strong>Nigeria</strong>’s original ‘top tier’ banks, FBN came<br />
through the CBN’s audits unscathed in 2009, but<br />
suffered with the rest of the sector as the central<br />
bank issued new prudential guidelines.<br />
• After a drop in earnings in FY 09 to NGN 4.9bn, 2010<br />
saw a recovery in performance, with attributable<br />
earnings closing at NGN 33.4bn.<br />
• The recovery has continued in <strong>2011</strong>, with 9M earnings<br />
increasing by 31.79% to NGN 42.9bn.<br />
• By year end, we should have seen the conclusion of<br />
AMCON’s NPL purchases from the market, which will<br />
also include FBN’s exposure to Sea Wolf of cNGN<br />
99bn. The group NPL ratio should thus continue to<br />
trend downwards going forward.<br />
• The group announced the acquisition of 75% of<br />
Banque International de Credit, a bank in the DRC, as<br />
part of its SSA expansion strategy.<br />
• Using a DCF valuation, we arrive at a target price for<br />
FBN of NGN 13.43, representing 49.0% upside on its<br />
current share price of NGN 9.01. As one of <strong>Nigeria</strong>’s<br />
traditional ‘top tier’ banks, we expect FBN to remain<br />
a major player in the sector. BUY.<br />
First Bank vs NSE ASI (Rebased)<br />
Recommendation<br />
BUY<br />
Bloomberg Code<br />
FIRSTBAN:NL<br />
Current Price (NGN) 9.0<br />
Current Price (USc) 5.6<br />
Target Price (NGN) 13.4<br />
Target Price (USc) 8.3<br />
Upside (%) 49.0<br />
Liquidity<br />
Market Cap (NGN m) 294 015<br />
Shares (m) 32 632<br />
Free Float (est. %) 79.6<br />
Ave. daily vol ('000) - 1 yr. 20 840<br />
Price Performance<br />
Price, 12 months ago (NGN) 12.9<br />
Change (%) (30.4)<br />
Price, 6 months ago (NGN) 13.5<br />
Change (%) (33.3)<br />
Financials (NGN m) 31 Dec F2010 <strong>2011</strong>F 2012F<br />
Loans & Advances 1 151 195 1 277 967 1 516 099<br />
Net Interest Income (excl. Provisions) 121 462 156 455 207 801<br />
Non-Interest Income 56 461 71 836 86 147<br />
Attributable Earnings 33 411 55 944 72 715<br />
EPS (kobo) 102.4 153.4 177.2<br />
DPS (kobo) 60.0 84.4 97.5<br />
NAV/Share (kobo) 1 043.8 1 028.9 1 018.0<br />
Valuation Ratios Current <strong>2011</strong>F 2012F<br />
Earnings Yield* (%) 14.9 17.0 19.7<br />
Dividend Yield (%) 6.7 9.4 10.8<br />
PE* (x) 6.7 5.3 4.0<br />
PBV (x) 0.91 0.78 0.70<br />
RoaA (%) 1.5 2.1 2.2<br />
RoaE (%) 10.3 15.6 18.2<br />
Net Interest Margin (%) 6.3 6.9 7.3<br />
Cost to Income Ratio (%) 65.5 61.0 60.4<br />
* - trailing<br />
1.5<br />
1.4<br />
1.3<br />
1.2<br />
Strengths<br />
Top tier bank<br />
Large branch network<br />
Weaknesses<br />
Poor asset optimisation<br />
Relatively low RoE vs some peers<br />
1.1<br />
Strong brand<br />
Sea Wolf loan concentration<br />
1<br />
0.9<br />
0.8<br />
0.7<br />
0.6<br />
0.5<br />
Low cost deposit base<br />
Opportunities<br />
Relatively low LDR means room to grow<br />
risk assets<br />
SSA expansion<br />
(AMCON should resolve)<br />
Threats<br />
Nimbler, smaller players targeting its<br />
market share<br />
DRC acquisition high risk<br />
17-Nov-10<br />
17-Dec-10<br />
17-Jan-11<br />
17-Feb-11<br />
17-Mar-11<br />
17-Apr-11<br />
17-May-11<br />
17-Jun-11<br />
17-Jul-11<br />
17-Aug-11<br />
17-Sep-11<br />
17-Oct-11<br />
17-Nov-11<br />
Centralised processing centre<br />
Behind its peers in terms of SSA expansion<br />
rollout ongoing will see it playing catch up<br />
First Bank<br />
NSE ASI<br />
17
FY 10 & 9M 11 Financial & Operational Review<br />
As with most of the <strong>Nigeria</strong>n banks, FBN experienced a<br />
much better performance in FY 10, following the tumult<br />
of 2009, where earnings had fallen to NGN 4.9bn, (9M to<br />
<strong>December</strong> reflecting change in year end from March),<br />
from NGN 12.6bn in FY March 09.<br />
300 000<br />
250 000<br />
200 000<br />
150 000<br />
80 000<br />
70 000<br />
60 000<br />
50 000<br />
40 000<br />
After annualising the 9M results to Dec 09, net interest<br />
income was down 5.3% y-o-y to NGN 121.5bn, as falling<br />
yields as a function of excess liquidity during the year, as<br />
well as slow credit growth, had a negative impact. Loans<br />
and advances continued to dominate the interest income<br />
contribution with a 64.4% contribution, although falling<br />
from 68.3% as at Dec 09. Non-interest income, however,<br />
surged 32.9% to NGN 56.5bn, buoyed by fees and<br />
commissions in particular which were up 20%, while<br />
foreign exchange income also showed solid growth.<br />
100 000<br />
50 000<br />
0<br />
Source: FBN<br />
2005<br />
2008<br />
2007<br />
2006<br />
Attributable Earnings<br />
<strong>2011</strong> E<br />
2010<br />
2009<br />
Total Operating Income<br />
2012 E<br />
30 000<br />
20 000<br />
10 000<br />
0<br />
Following the CBN directed jump in provisioning in 2009,<br />
FY 10 saw the charge declining by 60.1% to NGN 21.6bn,<br />
with the majority of the clean up having been addressed<br />
in the prior year. The charge was inclusive of the<br />
mandatory 1% general provision (NGN 11.4bn) under the<br />
revised guidelines of the CBN. Recoveries of NGN 9.6bn<br />
also helped in reducing the charge, with the NPL ratio<br />
improving to 7.7% from 8.2% y-o-y.<br />
3 000 000<br />
2 500 000<br />
2 000 000<br />
1 500 000<br />
Operating expenses growth, up 15.2% to NGN 116.6bn,<br />
saw the cost to income ratio deteriorate to 65.5% from<br />
59.2%. Staff costs were well controlled, down 3.7% y-o-y,<br />
but other expenses growth of 37.1% offset this, due to<br />
increases in maintenance costs and in the NDIC (<strong>Nigeria</strong><br />
Deposit Insurance Corporation) premium which was<br />
increased to 0.51% from 0.36% in 2009. Despite the<br />
deterioration in the CIR, the reduced provisions meant<br />
that net income increased by 158.2% to NGN 39.8bn.<br />
1 000 000<br />
500 000<br />
0<br />
Source: FBN<br />
2005<br />
2006<br />
2007<br />
Deposits<br />
2008<br />
2009<br />
Loans & Advances<br />
2010<br />
<strong>2011</strong> E<br />
2012 E<br />
Associate income fell 35.4% to NGN 43.2bn, but a large<br />
reduction in the effective tax rate from 63.1% to 22.6%<br />
saw attributable earnings up five-fold to NGN 33.4bn. A<br />
dividend of 60 kobo per share was proposed for the year,<br />
representing a payout ratio of 58.8%.<br />
The balance sheet saw total assets up 6.0% y-o-y to NGN<br />
2.3tn. Net loans and advances growth was limited both by<br />
the lower appetite of borrowers due to a downturn in<br />
economic activity, as well as tighter credit generation<br />
criteria by FBN following the 2009 crisis, to just 5.7%,<br />
closing the year at NGN 1.2tn. The largest chunk of the<br />
loan book was institutional at 45.7%, while the LDR was<br />
77.0% (FY 09: 75.8%). There was a strong increase in bond<br />
investments and treasury bill holdings, however,<br />
reflecting the risk aversion inherent in the market at the<br />
time.<br />
On the liabilities side, deposits grew by just 5.2% to NGN<br />
1.6tn, which was attributed by the group to a deliberate<br />
strategy to reduce expensive deposits and a focus on the<br />
lower cost current and savings accounts. These made up<br />
81% of deposits at FY 10. RoAE and RoAA closed the year<br />
at 10.3% and 1.5% respectively, with a CAR of 20.4%.<br />
5%<br />
Source: FBN<br />
3%<br />
2%<br />
7%<br />
7%<br />
10%<br />
Gross Loans & Advances <strong>Sector</strong>al Split (Bank)<br />
3% 2%<br />
4%<br />
17%<br />
14%<br />
7%<br />
12% 6%<br />
Oil & Gas Downstream<br />
Oil & Gas Upstream<br />
Oil & Gas Services<br />
Government<br />
Consumer<br />
General<br />
Manufacturing<br />
General Commerce<br />
Info and Comms<br />
Finance & Insurance<br />
Residential Mortgages<br />
Real Estate - Commercial<br />
18
The 9M results to 30 September <strong>2011</strong> have continued in<br />
the same vein as FY 10 in terms of improved earnings.<br />
Interest income was up 10.33% to NGN 150.4bn, while<br />
interest expense dropped by 32.63% to NGN 31.5bn,<br />
resulting in net interest income of NGN 118.9bn, an<br />
increase of 32.73%. The improvement came as higher<br />
interest rates filtered through on the asset side while the<br />
yield on deposits was kept relatively flat, offsetting the<br />
strong deposit growth. This scenario saw the cost of funds<br />
fall to 2.1% from 4.5% y-o-y, and slightly increase<br />
compared with H1’s 1.8%. The average yield on interest<br />
earning assets improved to 10.1% from 9.8% in the<br />
comparative period and 9.4% at H1 11. Consequently,<br />
margins went up to 8.1% (9M 10: 6.4% and H1 11: 7.8%).<br />
Included in interest income was a reclassification of NGN<br />
10.2bn from non-interest income, relating to the writing<br />
back of suspended interest following AMCON sales.<br />
Net fees and other income saw an even better<br />
performance, up 49.14% to NGN 60.8bn, as the<br />
contribution of non-interest to interest income shifted to<br />
33.83% from 31.27% at September 2010. This was driven<br />
by increased commission on turnover due to higher<br />
deposit volumes, increased transaction volumes and<br />
credit related fees, among other factors. Operating<br />
income thus increased by 37.86% to NGN 179.7bn.<br />
Operating expenses were up 27.63% to NGN 107.1bn and<br />
the cost to income ratio improved to 59.62% from 64.39%.<br />
The provisioning charge was 4x higher y-o-y at NGN<br />
23.5bn, (NGN 14.4bn at the half year). There was a<br />
notable increase in provisions for other assets, up to NGN<br />
4.9bn from NGN 600m at the half year, as the declining<br />
equity market led to large mark downs. PBT closed the<br />
period at NGN 49.0bn, an increase of NGN 20.43%, while<br />
attributable earnings were up 31.79% to NGN 42.9bn.<br />
The balance sheet shrank by 1.78% from the H1 position<br />
to NGN 2.9tn, with net loans and advances up 11.25% to<br />
NGN 1.3tn, while treasury bill holdings were up 5.7x to<br />
NGN 135.3bn and investments gained 44.87% to NGN<br />
510.8bn. On the liabilities side, deposits went up by<br />
38.63% to NGN 2.0tn, continuing to show strong growth.<br />
The reported NPL ratio improved to 4.74% from 5.82% y-oy,<br />
but reflected a deterioration from the 3.8% as at the<br />
H1 11.<br />
FBN Q3 11 Results Summary (m) 30-Sep-11 30-Sep-10<br />
Net interest income 118 905 89 584<br />
Net fees and other income 60 779 40 753<br />
Operating income 179 684 130 337<br />
Non-interest expense (107 123) (83 930)<br />
Allowance for credit impairment (23 544) (5 704)<br />
Operating profit 49 017 40 703<br />
Attributable earnings 42 915 32 562<br />
Outlook<br />
The focus for FBN going forward will remain on<br />
lowering the cost of funds to boost net interest<br />
margins, increasing the contribution of non-interest<br />
income by pushing fees and commissions, getting the<br />
cost to income ratio to stay below 60% and measured<br />
loan and advances growth.<br />
Based on the current performance and the conference<br />
call results update, we forecast earnings per share of<br />
153 kobo per share, an increase of 49.8% on FY 10,<br />
based on the assumption of improved net interest<br />
margins due to the increase in interest rates in Q4,<br />
lower cost of funds, cost to income ratio trending<br />
towards 60% and a provision to loan ratio of 5.1%. We<br />
forecast RoAE and RoAA ratios of 15.6% and 2.1%<br />
respectively for the full year.<br />
In the 9M results presentation, FBN indicated that<br />
negotiations were continuing for AMCON to buy the<br />
Sea Wolf loan, which was circa NGN 99bn, and that a<br />
haircut of approximately 10% was expected,<br />
(newspaper reports suggest this was concluded with<br />
AMCON buying the loan at between 85% to 95% of face<br />
value). While as indicated by FBN, the loan was<br />
performing, it was considered too large by AMCON and<br />
thus “systemically important”, while it also exceeded<br />
FBN’s single obligor limits.<br />
The group also announced the acquisition of 75% of<br />
Banque International de Credit, a bank in the DRC in<br />
line with its SSA expansion strategy. While the growth<br />
prospects in that market cannot be argued against,<br />
anecdotal evidence suggests that that is one of the<br />
more difficult markets to invest in, both from an<br />
infrastructure deficit and political risk perspective,<br />
and thus makes an interesting choice as a first foray<br />
into SSA. We are not sure it is the right one, but<br />
according to the numbers presented by FBN, it is<br />
buying into a profitable business, with a net income of<br />
USD 5m at FY Dec 2010, and total assets of USD 198m,<br />
net loans of USD 83m and deposits of USD 163m.<br />
Equity was at USD 21m, and management indicates it<br />
paid 2x book for the bank.<br />
Valuation and Recommendation<br />
Using a DCF valuation, we arrive at a target price for<br />
FBN of NGN 13.43, representing 49.0% upside on its<br />
current share price of NGN 9.01. As one of <strong>Nigeria</strong>’s<br />
traditional ‘top tier’ banks, we expect FBN to remain<br />
a major player in the sector. BUY.<br />
30-Sep-11 30-Jun-11<br />
Loans and advances to customers 1 272 224 1 226 020<br />
Deposits from customers 2 010 946 1 919 717<br />
Total equity 321 817 321 044<br />
19
Financial Summary<br />
Income Statement Summary 2005 A 2006 A 2007 A 2008 A 2009 A 2010 A <strong>2011</strong> E 2012 E<br />
Net Interest Income Before Loss Provision 27 900 30 703 44 222 82 930 96 157 121 462 156 455 207 801<br />
Y-o-Y Growth 10.0% 44.0% 87.5% 15.9% 26.3% 28.8% 32.8%<br />
Non Interest Income 20 800 26 697 28 584 38 576 31 869 56 461 71 836 86 147<br />
Y-o-Y Growth 28.4% 7.1% 35.0% (17.4%) 77.2% 27.2% 19.9%<br />
Total Operating Income (incl Prov) 46 269 53 415 70 785 115 401 87 402 156 333 209 920 269 792<br />
Y-o-Y Growth 15.4% 32.5% 63.0% (24.3%) 78.9% 34.3% 28.5%<br />
Operating Expense (29 461) (35 285) (46 915) (67 707) (75 841) (116 530) (139 194) (177 571)<br />
Y-o-Y Growth 19.8% 33.0% 44.3% 12.0% 53.7% 19.4% 27.6%<br />
Profit Before Tax 16 808 21 833 23 870 47 214 13 297 43 188 72 192 93 834<br />
Y-o-Y Growth 29.9% 9.3% 97.8% (71.8%) 224.8% 67.2% 30.0%<br />
Attributable Net Income/Profit After Tax 13 050 17 383 18 652 36 540 4 901 33 411 55 944 72 715<br />
Y-o-Y Growth 33.2% 7.3% 95.9% (86.6%) 581.7% 67.4% 30.0%<br />
Balance Sheet Summary 2005 A 2006 A 2007 A 2008 A 2009 A 2010 A <strong>2011</strong> E 2012 E<br />
Cash & Short term Funds 162 137 220 572 326 249 617 030 584 525 625 931 932 645 958 182<br />
Y-o-Y Growth 36.0% 47.9% 89.1% (5.3%) 7.1% 49.0% 2.7%<br />
Financial Assets held for Trading 116 955 157 412 231 309 241 076 29 269 32 611 164 225 211 547<br />
Y-o-Y Growth 34.6% 46.9% 4.2% (87.9%) 11.4% 403.6% 28.8%<br />
Loans & Advances,Net 125 022 179 004 221 038 469 670 1 089 287 1 151 195 1 277 967 1 516 099<br />
Y-o-Y Growth 43.2% 23.5% 112.5% 131.9% 5.7% 11.0% 18.6%<br />
Deposits 332 196 449 238 685 353 855 306 1 519 853 1 598 853 2 266 437 2 577 213<br />
Y-o-Y Growth 35.2% 52.6% 24.8% 77.7% 5.2% 41.8% 13.7%<br />
Borrowings - 22 101 29 414 35 473 124 617 118 386 112 467<br />
Y-o-Y Growth NA NA 33.1% 20.6% 251.3% (5.0%) (5.0%)<br />
Shareholder's Equity 49 805 62 293 83 627 355 634 311 270 340 626 377 723 420 419<br />
Y-o-Y Growth 25.1% 34.2% 325.3% (12.5%) 9.4% 10.9% 11.3%<br />
Per Share Data 2005 A 2006 A 2007 A 2008 A 2009 A 2010 A <strong>2011</strong> E 2012 E<br />
Earning per Share (kobo) 334.8 331.9 178.0 266.9 16.9 102.4 153.4 177.2<br />
Y-o-Y Growth (0.9%) (46.4%) 49.9% (93.7%) 506.0% 49.8% 15.5%<br />
Dividend Per Share (kobo) 100.00 100.00 120.00 0.00 10.00 60.00 84.36 97.47<br />
Y-o-Y Growth 0.0% 20.0% (100.0%) NA 500.0% 40.6% 15.5%<br />
Book Value Per Share (kobo) 1 259.8 1 189.3 798.2 2 597.6 1 073.0 1 043.8 1 028.9 1 018.0<br />
Y-o-Y Growth (5.6%) (32.9%) 225.4% (58.7%) (2.7%) (1.4%) (1.1%)<br />
Tangible Book Value per share (kobo) 1 259.8 1 189.3 798.2 2 597.6 1 073.0 1 043.8 1 028.9 1 018.0<br />
Y-o-Y Growth (5.6%) (32.9%) 225.4% (58.7%) (2.7%) (1.4%) (1.1%)<br />
Key Ratios 2005 A 2006 A 2007 A 2008 A 2009 A 2010 A <strong>2011</strong> E 2012 E<br />
Gross Loan to Deposit Ratio 49.1% 43.0% 33.3% 56.1% 75.8% 77.0% 60.3% 62.5%<br />
Gross Loan to Fund Ratio 49.1% 43.0% 32.3% 54.2% 74.1% 71.4% 57.3% 59.9%<br />
Net Interest Income to total income 60.3% 57.5% 62.5% 71.9% 110.0% 77.7% 74.5% 77.0%<br />
Cost to Income Ratio 60.5% 61.5% 64.4% 55.7% 59.2% 65.5% 61.0% 60.4%<br />
Interest Income to average interest earning assets 8.1% 7.9% 8.8% 10.4% 9.4% 8.2% 7.8% 8.4%<br />
Interest expense to average interest bearing liabilities 2.6% 2.6% 3.2% 4.2% 5.4% 3.2% 2.3% 2.6%<br />
Net Interest Spread 5.5% 5.3% 5.6% 6.2% 4.0% 5.0% 5.4% 5.8%<br />
Net Income Margin 28.2% 32.5% 26.4% 31.7% 5.6% 21.4% 26.7% 27.0%<br />
Accumulated Provision as a % of loans & Advances 22.2% 6.7% 2.1% 1.1% 5.5% 6.5% 5.1% 5.1%<br />
Return on Equity (average) 26.2% 31.0% 25.6% 16.6% 1.5% 10.3% 15.6% 18.2%<br />
Return on Assets (average) 2.8% 3.2% 2.4% 3.0% 0.3% 1.5% 2.1% 2.2%<br />
Non-interest income to total income 45.0% 50.0% 40.4% 33.4% 36.5% 36.1% 34.2% 31.9%<br />
Provision expense as a % of advances 0.6% 0.7% 0.9% 1.3% 3.5% 1.8% 1.6% 1.6%<br />
Advances to equity 251.0% 287.4% 264.3% 132.1% 349.9% 338.0% 338.3% 360.6%<br />
20
EQUITY RESEARCH<br />
NIGERIA<br />
DECEMBER <strong>2011</strong><br />
BANKING<br />
Guaranty Trust Bank plc (GTB) was incorporated as a<br />
limited liability company licensed to provide<br />
commercial and other banking services to the <strong>Nigeria</strong>n<br />
public in 1990. The bank commenced operations in<br />
February 1991, and in September 1996, became a<br />
publicly quoted company. GTB undertook its second<br />
share offering in 2004 and successfully raised over NGN<br />
11bn, ensuring it was satisfactorily poised to meet the<br />
NGN 25bn minimum capital base for banks introduced<br />
by the CBN in 2005. In 2007, the bank became the first<br />
<strong>Nigeria</strong>n financial institution to undertake a USD 350m<br />
regulation S Eurobond issue and a USD 750m London<br />
listed GDR Offer. In <strong>December</strong> 2009, GTB successfully<br />
completed the first tranche of its USD 200m corporate<br />
bond. Along with the <strong>Nigeria</strong>n operations, the bank has<br />
five offshore bank subsidiaries in the Gambia, Sierra<br />
Leone, Ghana, Liberia and in the UK. The group has a<br />
branch network of 186.<br />
• One of our preferred picks in the sector, GTB<br />
continues to perform well with consistent<br />
performance indicators.<br />
• After a relatively flat earnings growth performance in<br />
FY 09, attributable earnings for FY 10 were NGN<br />
38.9bn, up 36.02%. This was largely due to a fall in<br />
provisions, however, as a flat revenue performance<br />
and rising costs impeded operating income growth.<br />
• Earnings for 9M 11 closed the period at NGN 40.5bn,<br />
an increase of 33.30%, boosted by extraordinary<br />
income.<br />
• All Zenon related exposures were settled with AMCON<br />
by the H1 11 results to June.<br />
• Using a DCF valuation, we arrive at a target price for<br />
GTB of NGN 19.34, representing 36.2% upside on its<br />
current share price of NGN 14.20. GTB remains our<br />
number one pick in the sector. Forward earnings and<br />
dividend yields add weight to our recommendation,<br />
justifying its premium relative ratings. BUY.<br />
Recommendation<br />
BUY<br />
Bloomberg Code<br />
GUARANTY:NL<br />
Current Price (NGN) 14.2<br />
Current Price (USc) 8.8<br />
Target Price (NGN) 19.3<br />
Target Price (USc) 11.9<br />
Upside (%) 36.2<br />
Liquidity<br />
Market Cap (NGN m) 417 923<br />
Shares (m) 29 431<br />
Free Float (est. %) 82.3<br />
Ave. daily vol ('000) - 1 yr. 19 989<br />
Price Performance<br />
Price, 12 months ago (NGN) 13.2<br />
Change (%) 7.9<br />
Price, 6 months ago (NGN) 16.3<br />
Change (%) (13.1)<br />
Financials (NGN m) 31 Dec F2010 <strong>2011</strong>F 2012F<br />
Loans & Advances 604 093 675 943 769 672<br />
Net Interest Income (excl. Provisions) 83 853 96 872 134 825<br />
Non-Interest Income 39 566 52 857 61 931<br />
Attributable Earnings 38 890 52 630 69 300<br />
EPS (kobo) 166.8 202.9 213.7<br />
DPS (kobo) 100.0 121.7 128.2<br />
NAV/Share (kobo) 944.6 991.3 933.5<br />
Valuation Ratios Current <strong>2011</strong>F 2012F<br />
Earnings Yield* (%) 11.7 14.3 15.0<br />
Dividend Yield (%) 7.0 8.6 9.0<br />
PE* (x) 8.5 7.9 6.0<br />
PBV (x) 1.8 1.6 1.4<br />
RoaA (%) 3.5 3.9 4.1<br />
RoaE (%) 18.6 21.9 24.5<br />
Net Interest Margin (%) 7.2 6.9 7.9<br />
Cost to Income Ratio (%) 52.9 45.5 45.9<br />
* - trailing<br />
1.5<br />
GT Bank vs NSE ASI ( Rebased)<br />
Strengths<br />
Weaknesses<br />
1.4<br />
1.3<br />
1.2<br />
Top tier bank<br />
IT driven<br />
Relatively small branch network compared<br />
to other top tier players<br />
1.1<br />
1<br />
0.9<br />
Strong brand<br />
Consistenly solid performance ratios<br />
Zenon exposure<br />
(AMCON should resolve)<br />
0.8<br />
0.7<br />
0.6<br />
0.5<br />
17-Nov-10<br />
17-Dec-10<br />
17-Jan-11<br />
17-Feb-11<br />
17-Mar-11<br />
17-Apr-11<br />
17-May-11<br />
17-Jun-11<br />
17-Jul-11<br />
17-Aug-11<br />
17-Sep-11<br />
17-Oct-11<br />
17-Nov-11<br />
Opportunities<br />
Threats<br />
SSA expansion<br />
Large oil & gas exposure, so negative<br />
Focused on top end of the market, so movement in oil prices could have large<br />
remaining market segments potential area impact on loans and advances<br />
GT Bank<br />
NSE ASI<br />
21
FY 10 & 9M 11 Financial & Operational Review<br />
In spite of the fall in interest rates during FY 10, GTB just<br />
about managed to sustain its net interest margin from FY<br />
09, recording 7.22% against 7.80%, as the interest income<br />
decline of 11.35% to NGN 114.0bn was less than the<br />
31.82% fall in interest expense. The average yield on<br />
interest earning assets was 10.41% (FY 09: 12.80%) against<br />
an average cost of funds of 3.18% (FY 09: 6.20%). Net<br />
interest income thus came out virtually flat, down 0.62%<br />
to NGN 83.9bn, courtesy of aggressive liability repricing.<br />
200 000<br />
180 000<br />
160 000<br />
140 000<br />
120 000<br />
100 000<br />
80 000<br />
60 000<br />
40 000<br />
20 000<br />
80 000<br />
70 000<br />
60 000<br />
50 000<br />
40 000<br />
30 000<br />
20 000<br />
10 000<br />
Net non-interest income was also down during the year,<br />
shedding 2.87% to NGN 39.6bn. While net fee and<br />
commission income increased 18.01% to NGN 31.0bn and<br />
net trading income was virtually unchanged at NGN<br />
7.9bn, mark to market losses on trading investments of<br />
NGN 3.1bn meant other operating income was a negative<br />
NGN 2.3bn against a positive NGN 4.0bn in FY 09. The<br />
split of non-interest to interest income was 26:74,<br />
marginally changed from 27:73 in 2009.<br />
0<br />
2005<br />
Source: GTB/IAS<br />
2008<br />
2007<br />
2006<br />
Attributable Earnings<br />
<strong>2011</strong> E<br />
2010<br />
2009<br />
Total Operating Income<br />
2012 E<br />
0<br />
Operating expenses growth was 14.83% during the period<br />
to NGN 65.3bn, as increases of 21.40%, 33.10% and 89.31%<br />
in general administration, premises and equipment and<br />
insurance premium costs, respectively, led to a 26.59%<br />
rise in other operating expenses. This was attributed to<br />
rising infrastructure and general costs. Staff costs on the<br />
other hand were down 4.49% to NGN 17.7bn. The cost to<br />
income ratio headed north to 52.9% from 45.4% in FY 09.<br />
The provision charge was a third of that in 2009 at NGN<br />
10.6bn as specific provisions were largely accounted for<br />
in the previous period. That decline proved the key driver<br />
for net operating income/PBT, which put on 35.86% to<br />
NGN 47.6bn. There was minimal AMCON impact for GTB in<br />
2010, with just NGN 1.7bn sold to the ‘bad’ bank.<br />
3 000 000<br />
2 500 000<br />
2 000 000<br />
1 500 000<br />
1 000 000<br />
500 000<br />
0<br />
2005<br />
Source: GTB/IAS<br />
2006<br />
2007<br />
Deposits<br />
2008<br />
2009<br />
Loans & Advances<br />
2010<br />
<strong>2011</strong> E<br />
2012 E<br />
Attributable earnings for the year was NGN 38.9bn, up<br />
36.02% from NGN 28.6bn and equating to earnings per<br />
share of 167 kobo. Dividends of 100 kobo per share were<br />
declared, up from 75 kobo in FY 09. Sierra Leone, Gambia<br />
and Ghana operations were profit and loss positive.<br />
Loans & Advances <strong>Sector</strong>al Split (H1 11)<br />
Total assets grew 8.20% y-o-y to NGN 1.2tn, with a<br />
continued focus on the high end customer base meaning<br />
that loans and advances only went up by 5.11% to NGN<br />
604.1bn. On the other hand, investment in securities and<br />
financial assets held for trading put on 75.10% and 13.24%<br />
respectively. Deposits growth was more positive,<br />
supported by a continued ‘flight to quality’ as observed<br />
by the bank, as they gained 11.60% to NGN 779.1bn. The<br />
loan to deposit ratio deflated somewhat to 81.7% from<br />
85.5%. Oil and gas was the largest contributor to the loan<br />
book with 23% (including some Zenon exposure), followed<br />
by the manufacturing sector with 19%. The NPL ratio was<br />
notably better at 6.79% from 12.26% boosted by<br />
recoveries. Profitability ratios improved, with RoAE up to<br />
18.6% from 15.1% in FY 09, while RoAA improved to 3.5%<br />
from 2.8%. The CAR closed the year at 20.81%, down from<br />
25.99%. .<br />
2% 3%<br />
26%<br />
17%<br />
Source: GTB<br />
2% 3% 3% 4% 4%<br />
5%<br />
9%<br />
13%<br />
9%<br />
Government<br />
Capital Market<br />
Education<br />
Construction<br />
Transportation & Storage<br />
Real Estate<br />
General<br />
General Commerce<br />
Info and Comms<br />
Manufacturing<br />
Oil & Gas<br />
Finance & Insurance<br />
Other<br />
22
The 9M results to 30 September <strong>2011</strong> saw gross earnings<br />
for GTB up 15.50% to NGN 138.4bn. Interest income<br />
increased by 10.87% to NGN 94.1bn, while interest<br />
expense was 20.61% lower at NGN 19.6bn. This led to net<br />
interest income gaining 23.78% to NGN 74.5bn. Net fee<br />
and commission income growth was not far behind at<br />
22.97% to NGN 32.0bn. Net foreign exchange income was<br />
NGN 5.7bn vs NGN 3.5bn in 9M 10, while income from<br />
investments was a quarter of the NGN 4.1bn in the<br />
comparative period. After accounting for the NGN 916m<br />
in underwriting income, total operating income came out<br />
at NGN 114.2bn, an increase of 21.05%.<br />
Operating expenses growth was contained to below our<br />
expectations, up just 4.61% to NGN 53.7bn, yielding a<br />
cost to income ratio of 47.01% compared with 54.39%<br />
during the comparative period, and 47.37% at H1 11.<br />
Loan loss expenses more than doubled to NGN 11.0bn (9M<br />
10: NGN 4.0bn) y-o-y, and were 36.88% up from H1 11’s<br />
NGN 8.0bn. Management had indicated at the half year<br />
that all AMCON related transactions for the group had<br />
been concluded, including GTB’s Zenon exposure.<br />
Profit before tax went up by 26.39% to NGN 49.3bn, and<br />
attributable earnings closed the period at NGN 40.5bn.<br />
The latter’s 33.30% rise included an extraordinary income<br />
item of NGN 2.2bn related to the disposal of the bank’s<br />
holding in one of its Small and Medium Enterprises Equity<br />
Investment Scheme positions. EPS was 173 kobo while<br />
HEPS was 164 kobo.<br />
Total assets grew 6.00% from the half year to NGN 1.5tn.<br />
Net loans and advances increased at a greater pace<br />
during Q3, up 12.18% to NGN 703.7bn, while treasury bill<br />
holdings dropped by 17.98% and investment securities<br />
were 16.79% higher. The NPL ratio improved to 2.78%,<br />
this compared with 3.61% at 30 June. Deposit growth was<br />
4.60% to NGN 957.8bn, possibly reflecting limited<br />
appetite in a rising interest rate environment.<br />
Outlook<br />
GTB looks set to perform strongly in FY 11, driven by<br />
efficiencies on the income side, (low cost of funds and<br />
liquidity to take advantage of interest rate hikes), as<br />
well as on the expenses side, with the CIR target of<br />
below 50% likely to be attained. The NPL ratio is<br />
reflective of the much cleaner book, while the<br />
possibility of write backs thanks to aggressive H1<br />
provisioning remains.<br />
Following the publication of the 9M results, we have<br />
revised our forecasts higher for FY 11, also adjusting<br />
for the extraordinary item recorded in Q3. We<br />
estimate diluted EPS to increase to 203 kobo<br />
(adjusted for an assumed 1 for 5 bonus issue), and<br />
dividend per share to be declared of 122 kobo,<br />
representing a payout ratio of 60%. These assumptions<br />
yield RoAE and RoAA ratios of 21.9% and 3.9%<br />
respectively.<br />
Valuation and Recommendation<br />
Using a DCF valuation, we arrive at a target price for<br />
GTB of NGN 19.34, representing 36.2% upside on its<br />
current share price of NGN 14.20. With its consistent<br />
history of solid profitability, backed by impressive<br />
asset management and cost containment skills, GTB<br />
remains our number one pick in the sector. Forward<br />
earnings and dividend yields add weight to our<br />
recommendation, justifying its premium relative<br />
ratings. BUY.<br />
GTB Q3 11 Results Summary (m) 30-Sep-11 30-Sep-10<br />
Net interest income 74 485 60 176<br />
Net fee and commission income 31 993 26 016<br />
RevPar = Estimate<br />
Other Income 7 686 8 119<br />
Operating income 114 164 94 311<br />
Non-interest expense (53 664) (51 297)<br />
Allowance for credit impairment (10 983) (4 045)<br />
Operating profit 49 331 38 969<br />
Attributable earnings 40 525 30 402<br />
30-Sep-11 30-Jun-11<br />
Loans and advances to customers 703 732 627 334<br />
Deposits from customers 957 762 915 640<br />
Total equity 232 408 220 697<br />
23
Financial Summary<br />
Income Statement Summary 2005 A 2006 A 2007 A 2008 A 2009 A 2010 A <strong>2011</strong> E 2012 E<br />
Net Interest Income Before Loss Provision 8 776 13 557 18 744 49 376 84 378 83 853 96 872 134 825<br />
Y-o-Y Growth 54.5% 38.3% 163.4% 70.9% (0.6%) 15.5% 39.2%<br />
Non Interest Income 9 493 12 015 15 828 34 288 40 736 39 566 52 857 61 931<br />
Y-o-Y Growth 26.6% 31.7% 116.6% 18.8% (2.9%) 33.6% 17.2%<br />
Total Operating Income (incl Prov) 17 121 23 789 33 835 79 442 91 838 112 823 136 889 183 690<br />
Y-o-Y Growth 38.9% 42.2% 134.8% 15.6% 22.8% 21.3% 34.2%<br />
Operating Expense (10 340) (13 300) (19 325) (41 807) (56 826) (65 254) (68 163) (90 261)<br />
Y-o-Y Growth 28.6% 45.3% 116.3% 35.9% 14.8% 4.5% 32.4%<br />
Profit Before Tax 7 258 10 772 15 716 37 635 35 013 47 568 70 954 93 428<br />
Y-o-Y Growth 48.4% 45.9% 139.5% (7.0%) 35.9% 49.2% 31.7%<br />
Attributable Net Income/Profit After Tax 5 362 8 546 12 993 29 207 28 592 38 890 52 630 69 300<br />
Y-o-Y Growth 59.4% 52.0% 124.8% (2.1%) 36.0% 35.3% 31.7%<br />
Balance Sheet Summary 2005 A 2006 A 2007 A 2008 A 2009 A 2010 A <strong>2011</strong> E 2012 E<br />
Cash & Short term Funds 47 471 74 502 127 381 274 634 255 945 273 075 418 206 487 762<br />
Y-o-Y Growth 56.9% 71.0% 115.6% (6.8%) 6.7% 53.1% 16.6%<br />
Financial Assets held for Trading 28 934 102 646 135 171 73 011 156 242 176 934 247 866 305 593<br />
Y-o-Y Growth 254.8% 31.7% (46.0%) 114.0% 13.2% 40.1% 23.3%<br />
Loans & Advances,Net 65 516 84 201 115 746 421 808 574 733 604 093 675 943 769 672<br />
Y-o-Y Growth 28.5% 37.5% 264.4% 36.3% 5.1% 11.9% 13.9%<br />
Deposits 97 445 215 774 294 546 532 239 698 109 779 115 1 031 538 1 236 349<br />
Y-o-Y Growth 121.4% 36.5% 80.7% 31.2% 11.6% 32.4% 19.9%<br />
Borrowings 6 910 9 238 58 063 64 324 79 763 89 921 161 857 178 043<br />
Y-o-Y Growth 33.7% 528.6% 10.8% 24.0% 12.7% 80.0% 10.0%<br />
Shareholder's Equity 33 973 40 758 49 986 181 038 198 266 220 254 260 037 306 108<br />
Y-o-Y Growth 20.0% 22.6% 262.2% 9.5% 11.1% 18.1% 17.7%<br />
Per Share Data 2005 A 2006 A 2007 A 2008 A 2009 A 2010 A <strong>2011</strong> E 2012 E<br />
Earning per Share (kobo) 89.4 142.4 162.4 195.7 153.3 166.8 202.9 213.7<br />
Y-o-Y Growth 59.4% 14.0% 20.5% (21.7%) 8.8% 21.6% 5.3%<br />
Dividend Per Share (kobo) 77.00 95.00 75.00 100.00 75.00 100.00 121.72 128.22<br />
Y-o-Y Growth 23.4% (21.1%) 33.3% (25.0%) 33.3% 21.7% 5.3%<br />
Book Value Per Share (kobo) 566.2 679.3 624.8 1 213.2 1 062.9 944.6 991.3 933.5<br />
Y-o-Y Growth 20.0% (8.0%) 94.2% (12.4%) (11.1%) 4.9% (5.8%)<br />
Tangible Book Value per share (kobo) 564.0 677.1 623.1 1 210.8 1 061.0 943.1 990.0 932.5<br />
Y-o-Y Growth 20.0% (8.0%) 94.3% (12.4%) (11.1%) 5.0% (5.8%)<br />
Key Ratios 2005 A 2006 A 2007 A 2008 A 2009 A 2010 A <strong>2011</strong> E 2012 E<br />
Gross Loan to Deposit Ratio 69.5% 40.7% 40.3% 80.1% 85.5% 81.7% 70.7% 68.4%<br />
Gross Loan to Fund Ratio 64.9% 39.0% 33.7% 71.4% 76.8% 73.2% 61.1% 59.8%<br />
Net Interest Income to total income 51.3% 57.0% 55.4% 62.2% 91.9% 74.3% 70.8% 73.4%<br />
Cost to Income Ratio 56.6% 52.0% 55.9% 50.0% 45.4% 52.9% 45.5% 45.9%<br />
Interest Income to average interest earning assets 9.5% 9.8% 9.3% 11.0% 13.4% 10.6% 9.7% 10.6%<br />
Interest expense to average interest bearing liabilities 6.4% 4.9% 4.6% 4.7% 6.4% 3.7% 2.8% 2.8%<br />
Net Interest Spread 3.1% 4.9% 4.7% 6.3% 7.0% 6.9% 6.8% 7.8%<br />
Net Income Margin 31.3% 35.9% 38.4% 36.8% 31.1% 34.5% 38.4% 37.7%<br />
Accumulated Provision as a % of loans & Advances 3.3% 4.1% 2.2% 1.0% 4.0% 5.1% 7.3% 9.0%<br />
Return on Equity (average) 15.8% 22.9% 28.6% 25.3% 15.1% 18.6% 21.9% 24.5%<br />
Return on Assets (average) 2.9% 3.5% 3.3% 4.0% 2.8% 3.5% 3.9% 4.1%<br />
Non-interest income to total income 55.4% 50.5% 46.8% 43.2% 44.4% 35.1% 38.6% 33.7%<br />
Provision expense as a % of advances 1.7% 2.0% 0.6% 1.0% 5.6% 1.7% 2.9% 2.8%<br />
Advances to equity 192.8% 206.6% 231.6% 233.0% 289.9% 274.3% 259.9% 251.4%<br />
24
EQUITY RESEARCH<br />
NIGERIA<br />
DECEMBER <strong>2011</strong><br />
BANKING<br />
The Standard Bank Group of South Africa merged its<br />
<strong>Nigeria</strong>n operations, Stanbic Bank <strong>Nigeria</strong> with that of<br />
IBTC Chartered Bank PLC in 2007. The merger, by way<br />
of the first ever tender offer in <strong>Nigeria</strong> led to USD<br />
525m in FDI and gave birth to a new entity now known<br />
as Stanbic IBTC Bank PLC (StanbicIBTC) which became<br />
part of the Standard Bank Group (50.8% owned).<br />
StanbicIBTC through its wholly owned stock broking and<br />
asset management subsidiary, IBTC Asset Management<br />
Limited, manages several mutual funds, including the<br />
IBTC <strong>Nigeria</strong>n Equity Fund, which is <strong>Nigeria</strong>’s largest<br />
mutual fund. Traditionally strong as a corporate and<br />
investment bank, StanbicIBTC continues to look at<br />
strengthening its position in the sector. The group’s<br />
retail presence has grown since the merger, with 164<br />
branches as at 9M 11 from over 60 branches in 2007.<br />
Recommendation<br />
SELL<br />
Bloomberg Code<br />
IBTCCB:NL<br />
Current Price (NGN) 7.5<br />
Current Price (USc) 4.6<br />
Target Price (NGN) 5.3<br />
Target Price (USc) 3.3<br />
Upside (%) (29.4)<br />
Liquidity<br />
Market Cap (NGN m) 141 375<br />
Shares (m) 18 750<br />
Free Float (%) 41.8<br />
Ave. daily vol ('000) - 1 yr. 3 067<br />
Price Performance<br />
Price, 12 months ago (NGN) 9.1<br />
Change (%) (16.7)<br />
Price, 6 months ago (NGN) 10.3<br />
Change (%) (27.0)<br />
• A difficult year for the banking sector was<br />
compounded further for StanbicIBTC given its<br />
significant capital markets business as the NSE<br />
remained in the doldrums.<br />
• 2010 experienced a solid recovery as the group<br />
aggressively increased its risk assets while also<br />
working to improve its funding mix. Along with a<br />
notable decline in provision charges, this led to<br />
attributable earnings growth of 15.09% to NGN 8.8bn.<br />
• For 9M 11, bottom line earnings momentum declined<br />
compared with FY 10, up 6.47% to NGN 7.2bn, due to<br />
increased provisioning and the impact of the ongoing<br />
branch rollout on costs.<br />
• StanbicIBTC’s traditional corporate and investment<br />
banking bias will continue to weigh on its<br />
performance in the short to medium term, while it<br />
works to realign its funding mix. RoAE continues to<br />
lag many of its peers, while relative PER and PBV<br />
ratios are the highest in the sector. We value the<br />
group at NGN 5.32, indicating 29.4% downside on its<br />
current price of NGN 7.54. SELL.<br />
Financials (NGN m) 31 Dec F2010 <strong>2011</strong>F 2012F<br />
Loans & Advances 177 454 237 589 303 647<br />
Net Interest Income (excl. Provisions) 26 370 30 123 36 752<br />
Non-Interest Income 22 024 28 315 35 759<br />
Attributable Earnings 8 802 9 028 11 647<br />
EPS (kobo) 50.4 51.8 66.8<br />
DPS (kobo) 39.0 38.8 50.1<br />
NAV/Share (kobo) 454.0 473.9 510.2<br />
Valuation Ratios Current <strong>2011</strong>F 2012F<br />
Earnings Yield* (%) 6.5 6.9 8.9<br />
Dividend Yield (%) 5.2 5.1 6.6<br />
PE* (x) 15.3 15.7 12.1<br />
PBV (x) 1.7 1.6 1.5<br />
RoaA (%) 2.4 2.1 2.2<br />
RoaE (%) 10.6 10.4 12.6<br />
Net Interest Margin (%) 6.9 6.4 6.4<br />
Cost to Income Ratio (%) 70.8 75.4 74.4<br />
* - trailing<br />
Stanbic IBTC vs NSE ASI<br />
Strengths<br />
Weaknesses<br />
1.5<br />
1.4<br />
1.3<br />
1.2<br />
1.1<br />
1<br />
0.9<br />
0.8<br />
0.7<br />
0.6<br />
0.5<br />
Majority owned by Standard Bank<br />
Diversified business<br />
Asset management good source of annuity<br />
income, especially when the market recovers<br />
Opportunities<br />
<strong>Nigeria</strong>n acquisition/merger<br />
Funding mix remains relatively expensive<br />
reflecting corporate & investment bank roots<br />
Low RoAE<br />
Relatively small branch network vs top tier<br />
Threats<br />
Mergers/acqusitions by other 2nd tier peers<br />
Increased cross-selling opportunities<br />
will see them consolidate market position<br />
Stanbic IBTC<br />
NSE ASI<br />
Parent has strong emerging market ties<br />
Continued weakness of the NSE<br />
25
FY 10 & 9M 11 Financial & Operational Review<br />
With 2009 having been perhaps rather more challenging<br />
on some levels for StanbicIBTC given the material<br />
contribution of its capital markets franchise to the group<br />
which meant that the massive decline in the NSE was<br />
more keenly felt, 2010 experienced a solid recovery.<br />
An aggressive increase in loans and advances during the<br />
year relative to deposit growth was enough to offset the<br />
drop in interest rates as net interest income went up by<br />
5.03% to NGN 26.4bn. Gross interest income was down<br />
16.03% and interest expense down 49.48% as NIMs fell by<br />
50bp to 6.9%.<br />
80 000<br />
70 000<br />
60 000<br />
50 000<br />
40 000<br />
30 000<br />
20 000<br />
10 000<br />
0<br />
2005<br />
2008<br />
2007<br />
2006<br />
Attributable Earnings<br />
<strong>2011</strong> E<br />
2010<br />
2009<br />
Total Operating Income<br />
2012 E<br />
14 000<br />
12 000<br />
10 000<br />
8 000<br />
6 000<br />
4 000<br />
2 000<br />
0<br />
Net non-interest income, after having fallen 7.04% in<br />
2009, was up 17.67% in FY 10, driven by a 38.49% rise in<br />
net fee and commission income to NGN 19.0bn as the<br />
group won new advisory mandates, increased AUM and<br />
recorded higher transaction volumes. Trading income,<br />
mainly foreign exchange related, was however, 36.24%<br />
lower to NGN 2.7bn. Total income thus rose 10.43% to<br />
NGN 48.4bn.<br />
Source: StanbicIBTC<br />
400 000<br />
Operating expenses grew well ahead of income at 19.65%<br />
to NGN 34.2bn. This increase was driven by the bank’s<br />
ongoing branch expansion programme, as the branch<br />
network doubled from 70 in 2009 to 141 by end 2010. The<br />
increase in infrastructure investments meant part of the<br />
cost increase was depreciation related and hence noncash,<br />
as the charge surged 57.15% to NGN 4.0bn.<br />
Commendably, staff costs were relatively well contained,<br />
up 10% y-o-y despite a 12% increase in headcount to<br />
2,248. The cost to income ratio, expectedly, deteriorated<br />
to 70.8% from 65.3% in the prior year.<br />
350 000<br />
300 000<br />
250 000<br />
200 000<br />
150 000<br />
100 000<br />
50 000<br />
0<br />
2005<br />
2006<br />
2007<br />
Deposits<br />
2008<br />
2009<br />
2010<br />
Loans & Advances<br />
<strong>2011</strong> E<br />
2012 E<br />
Impairment charges were down 87.24% during the year to<br />
NGN 620.0m, courtesy of specific provision charges<br />
halving to NGN 3.0bn while recoveries to the tune of NGN<br />
3.6bn were booked. AMCON activities were said to have<br />
had an “insignificant impact on NPLs and impairment<br />
charges”, with only NGN 14m in margin facilities having<br />
been released.<br />
Source: StanbicIBTC<br />
Loans and Advances <strong>Sector</strong>al Split (Q3 11)<br />
A higher tax rate diluted the bottom line, and<br />
attributable earnings closed the year at NGN 8.8bn, an<br />
increase of 15.09% and EPS of 50.4 kobo. A dividend was<br />
declared of 39 kobo per share, a 77.38% payout ratio.<br />
Total assets grew 12.94% y-o-y to NGN 384.5bn, with net<br />
loans and advances up 48.02% to NGN 177.5bn as the<br />
group took advantage of a wider retail footprint to tap<br />
into the personal and business banking segments of the<br />
market which saw loans and advances up 105% to NGN<br />
53.6bn. With deposits up 16.91% to NGN 242.6bn, the<br />
loan to deposit ratio went to 77.1% from 64.1% in FY 09.<br />
As previously mentioned, recoveries performed well<br />
during the year, and as a result the NPL ratio improved to<br />
7.6% from 14.1%. RoAE improved to 10.6% from 9.4% in FY<br />
09, while RoAA improved to 2.4% from 2.2%. The CAR<br />
closed the year at 32.0%, down from 35.0% as the group<br />
increased its risk assets exposure.<br />
0%<br />
10%<br />
26%<br />
Source: StanbicIBTC<br />
2% 3% 1%<br />
9%<br />
19%<br />
15%<br />
11%<br />
5%<br />
Government<br />
Public Utilities<br />
Agriculture<br />
Transport & Comm.<br />
Real Estate & Construction<br />
Private Households<br />
General Commerce<br />
Manufacturing<br />
Oil & Gas<br />
Finance & Insurance<br />
Other<br />
26
StanbicIBTC’s 9M 11 results to 30 September recorded a<br />
gross earnings increase of 20.62% to NGN 49.6bn. Interest<br />
income increased by 11.90% to NGN 29.1bn, while interest<br />
expense gained 12.79% to NGN 6.4bn, leading to an 11.66%<br />
rise in net interest income to NGN 22.7bn. The increase<br />
came in the context of growth in the loan book, which<br />
was, however, offset by reduced income from interbank<br />
placements. With the CBN tightening its monetary policy<br />
and increased competition for lending, NIMs fell to 6.2%<br />
from 6.9% y-o-y (7.0% at the H1 11), as an increase in NIMs<br />
on the personal and business banking segment was<br />
negated by a drop in NIMs for corporate and investment<br />
banking. Net fee and commission income growth was a lot<br />
more positive at 21.61% to NGN 15.6bn while foreign<br />
exchange income was 127.04% higher at NGN 4.2bn. The<br />
former continued to benefit from scale increases and<br />
growth of the wealth business, while the latter benefited<br />
from exchange rate volatility and forex related corporate<br />
business. Total non-interest income was up 36.27% to NGN<br />
22.20, and operating income gained 22.04% to NGN<br />
43.0bn.<br />
Operating expenses remained under pressure as the<br />
branch expansion continued, (another 23 branches were<br />
added during the 9M period), the result of which was a<br />
cost increase of 24.43% to NGN 30.8bn. Depreciation also<br />
played a role, up 21.61% to NGN 3.8bn, as did the advent<br />
of the 0.3% of assets AMCON levy, which added NGN<br />
838.0m. The cost to income ratio deteriorated marginally<br />
to 71.77% compared with 70.39% y-o-y but was much<br />
improved from 75.18% at H1 11. Loan loss expenses were<br />
up 3x y-o-y to NGN 1.2bn from NGN 370.0m, as the group<br />
continued to grow its loan book, while the mandatory 1%<br />
general provision took effect.<br />
PBT growth was diluted from the top line because of the<br />
increases in provisions and expenses to 9.17%, closing at<br />
NGN 11.0bn, and attributable earnings ended the period<br />
6.47% higher at NGN 7.2bn.<br />
Total assets were up 15.01% y-o-y to NGN 488.8bn, driven<br />
by the increase in loans and advances, with the net<br />
number up 10.72% to NGN 215.5bn, while finance lease<br />
advances were 14.08% higher at NGN 22.5bn. Treasury bill<br />
holdings more than doubled, up 154.15% to NGN 27.2bn.<br />
The NPL ratio improved further to 6.2% from 7.6% at year<br />
end and 6.3% at H1 11. The top 4 group NPLs represented<br />
69% of the total, with the highest single contributor<br />
representing 56% of the total. The bank expected<br />
imminent resolution of that particular NPL.<br />
StanbicIBTC Q3 11 Results Summary (m) 30-Sep-11 30-Sep-10<br />
Net interest income 22 732 20 359<br />
Net fee and commission income 15 636 12 857<br />
Other Income 4 586 1 982<br />
Operating income 42 954 35 198<br />
Non-interest expense (30 828) (24 775)<br />
Allowance for credit impairment (1 151) (370)<br />
Operating profit 10 975 10 053<br />
Attributable earnings 7 175 6 739<br />
30-Sep-11<br />
30-Jun-11<br />
Loans and advances to customers 215 454 163 952<br />
Deposits from customers 228 147 186 466<br />
Total equity 488 751 384 541<br />
Source: StanbicIBTC<br />
Outlook<br />
We expect a relatively flat earnings performance for<br />
StanbicIBTC in FY 11, although ahead of the previous<br />
year courtesy of improved net interest margins given<br />
the monetary tightening and rise in MPR during H2 and<br />
a better deposit mix, steady growth in non-interest<br />
income as well as a declining CIR. We forecast earnings<br />
per share of 51.8 kobo per share, and a dividend per<br />
share of 38.8 kobo. Our +1 RoAE and RoAE numbers<br />
come out at 10.4% and 2.1% respectively. We see<br />
earnings momentum picking up in 2012 and beyond,<br />
however, as the benefits of increased scale begin to<br />
manifest. To truly position itself amongst the top<br />
banks, we think StanbicIBTC may have to look at<br />
merging with/acquiring another player in the sector.<br />
Valuation and Recommendation<br />
While aggressively pursuing its retail expansion<br />
strategy, which should bear dividends in the longer<br />
term, StanbicIBTC’s traditional corporate and<br />
investment banking and asset management bias will<br />
continue to weigh on its performance in the short to<br />
medium term. RoAE continues to lag many of its peers,<br />
while relative PER and PBV ratios are the highest in the<br />
sector. We value the group at NGN 5.32, indicating<br />
29.4% downside on its current price of NGN 7.54. SELL.<br />
Deposit growth was 2.51% to NGN 228.1bn, as the<br />
continued exit from more expensive deposit positions was<br />
offset by the growing branch network. This was reflected<br />
in the positive shift in the deposit mix, with the lower cost<br />
demand/savings/domiciliary deposits now 68% of total<br />
deposits compared with 55% at both FY 10 and H1 11. The<br />
CAR at the end of the 9M period was down to 23.2%, a<br />
result of the growth in risk assets, from 25.9% at the half<br />
year and 32.6% at FY.<br />
27
Financial Summary<br />
Income Statement Summary 2005 A 2006 A 2007 A 2008 A 2009 A 2010 A <strong>2011</strong> E 2012 E<br />
Net Interest Income Before Loss Provision 1 334 4 675 9 601 22 362 25 107 26 370 30 123 36 752<br />
Y-o-Y Growth 250.4% 105.4% 132.9% 12.3% 5.0% 14.2% 22.0%<br />
Non Interest Income 3 671 4 188 12 879 20 133 18 716 22 024 28 315 35 759<br />
Y-o-Y Growth 14.1% 207.5% 56.3% (7.0%) 17.7% 28.6% 26.3%<br />
Total Operating Income (incl Prov) 4 970 8 666 20 436 37 476 38 965 47 774 57 543 71 356<br />
Y-o-Y Growth 74.4% 135.8% 83.4% 4.0% 22.6% 20.4% 24.0%<br />
Operating Expense -1 649 (3 000) (9 444) (22 850) (28 623) (34 246) (44 061) (53 962)<br />
Y-o-Y Growth 82.0% 214.8% 141.9% 25.3% 19.6% 28.7% 22.5%<br />
Profit Before Tax 3 321 5 667 10 992 14 626 10 342 13 528 13 483 17 394<br />
Y-o-Y Growth 70.6% 94.0% 33.1% (29.3%) 30.8% (0.3%) 29.0%<br />
Attributable Net Income/Profit After Tax 2 445 4 061 7 585 11 563 7 648 8 802 9 028 11 647<br />
Y-o-Y Growth 66.1% 86.8% 52.4% (33.9%) 15.1% 2.6% 29.0%<br />
Balance Sheet Summary 2005 A 2006 A 2007 A 2008 A 2009 A 2010 A <strong>2011</strong> E 2012 E<br />
Cash & Short term Funds 10 240 18 474 92 616 123 180 84 726 98 707 68 195 48 394<br />
Y-o-Y Growth 80.4% 401.3% 33.0% (31.2%) 16.5% (30.9%) (29.0%)<br />
Financial Assets held for Trading 9 481 27 996 52 468 14 549 17 550 18 581 25 410 35 408<br />
Y-o-Y Growth 195.3% 87.4% (72.3%) 20.6% 5.9% 36.8% 39.3%<br />
Loans & Advances,Net 12 492 48 983 81 454 102 660 119 885 177 454 237 589 303 647<br />
Y-o-Y Growth 292.1% 66.3% 26.0% 16.8% 48.0% 33.9% 27.8%<br />
Deposits 10 163 55 492 138 689 177 464 207 534 242 618 321 940 386 132<br />
Y-o-Y Growth 446.0% 149.9% 28.0% 16.9% 16.9% 32.7% 19.9%<br />
Borrowings 2 657 3 338 27 533 12 201 12 647 18 272 23 754 27 317<br />
Y-o-Y Growth 25.6% 724.9% (55.7%) 3.7% 44.5% 30.0% 15.0%<br />
Shareholder's Equity 15 862 32 830 76 018 81 375 81 497 85 126 88 852 95 654<br />
Y-o-Y Growth 107.0% 131.6% 7.0% 0.1% 4.5% 4.4% 7.7%<br />
Per Share Data 2005 A 2006 A 2007 A 2008 A 2009 A 2010 A <strong>2011</strong> E 2012 E<br />
Earning per Share (NGN) 55.5 55.5 71.0 64.0 43.4 50.4 51.8 66.8<br />
Y-o-Y Growth 0.0% 28.0% (10.0%) (32.1%) 16.2% 2.7% 29.0%<br />
Dividend Per Share (NGN) 20.00 20.00 25.00 40.00 30.00 39.00 38.83 50.09<br />
Y-o-Y Growth 0.0% 25.0% 60.0% (25.0%) 30.0% (0.4%) 29.0%<br />
Book Value Per Share (NGN) 360.1 457.2 688.0 434.0 434.7 454.0 473.9 510.2<br />
Y-o-Y Growth 27.0% 50.5% (36.9%) 0.1% 4.5% 4.4% 7.7%<br />
Tangible Book Value per share (NGN) 360.1 457.2 688.0 434.0 434.7 454.0 473.9 510.2<br />
Y-o-Y Growth 27.0% 50.5% (36.9%) 0.1% 4.5% 4.4% 7.7%<br />
Key Ratios 2005 A 2006 A 2007 A 2008 A 2009 A 2010 A <strong>2011</strong> E 2012 E<br />
Gross Loan to Deposit Ratio 124.7% 102.8% 67.1% 63.7% 64.1% 77.1% 77.5% 82.0%<br />
Gross Loan to Fund Ratio 98.9% 97.0% 56.0% 59.6% 60.5% 71.7% 72.2% 76.6%<br />
Net Interest Income to total income 26.8% 53.9% 47.0% 59.7% 64.4% 55.2% 52.3% 51.5%<br />
Cost to Income Ratio 32.9% 33.8% 42.0% 53.8% 65.3% 70.8% 75.4% 74.4%<br />
Interest Income to average interest earning assets 7.9% 9.7% 7.6% 12.9% 13.0% 10.6% 11.9% 12.5%<br />
Interest expense to average interest bearing liabilities 11.5% 6.8% 5.5% 10.5% 7.7% 3.3% 5.4% 5.9%<br />
Net Interest Spread -3.7% 3.0% 2.1% 2.5% 5.3% 7.3% 6.5% 6.6%<br />
Net Income Margin 49.2% 46.9% 37.1% 30.9% 19.6% 18.4% 15.7% 16.3%<br />
Accumulated Provision as a % of loans & Advances 1.4% 14.3% 2.8% 9.6% 10.6% 5.3% 4.2% 3.5%<br />
Return on Equity (average) 15.4% 16.7% 13.9% 14.7% 9.4% 10.6% 10.4% 12.6%<br />
Return on Assets (average) 6.2% 5.3% 3.5% 3.5% 2.2% 2.4% 2.1% 2.2%<br />
Non-interest income to total income 73.9% 48.3% 63.0% 53.7% 48.0% 46.1% 49.2% 50.1%<br />
Provision expense as a % of advances 0.3% 0.3% 2.2% 4.4% 3.6% 0.3% 0.4% 0.4%<br />
Advances to equity 78.8% 149.2% 107.2% 126.2% 147.1% 208.5% 267.4% 317.4%<br />
28
EQUITY RESEARCH<br />
NIGERIA<br />
DECEMBER <strong>2011</strong><br />
BANKING<br />
United Bank for Africa Plc (UBA), is the product of the<br />
merger of what were at the time <strong>Nigeria</strong>’s third and<br />
fifth largest banks, the old UBA and the Standard Trust<br />
Bank Plc, respectively, and a subsequent acquisition of<br />
Continental Trust Bank Limited. Following <strong>Nigeria</strong>’s<br />
independence from Britain, UBA was originally<br />
incorporated in 1961. Today, UBA is one of Africa’s<br />
largest home grown financial institutions, offering<br />
universal banking to more than 7.2 million customers<br />
across 700 branches in 18 African countries, as well as<br />
having a presence in the USA, the UK and France. UBA<br />
has the largest branch network in <strong>Nigeria</strong> (600) and a<br />
total branch network of 726.<br />
• UBA’s recovery lagged many of its contemporaries in<br />
the sector in FY 10 following the challenges of FY 09,<br />
as falling net interest income and losses on AMCON<br />
sales led to attributable earnings decreasing to NGN<br />
668.0m from an annualised NGN 1.7bn in FY 09.<br />
• In 9M 11, the group continued to underperform, with<br />
profit before tax and exceptional items down 28.01%<br />
to NGN 12.1bn, while attributable earnings growth of<br />
91.29% was boosted by a much lower estimated<br />
effective tax rate.<br />
• The pan-African expansion has weighed down on<br />
performance over the years (ex-<strong>Nigeria</strong> African<br />
operations had a CIR of 88% as at the 9M period<br />
compared with 79% for the group), expectedly, but<br />
the tide seemed to have turned, with 9M 11 revealing<br />
a positive PBT number for the first time, of NGN 706m<br />
compared with a loss of NGN 2.9bn at FY 10.<br />
• UBA intends to raise NGN 500bn in additional capital<br />
as part of a strategic funding initiative, via a<br />
combination of debt and equity. This is likely to dilute<br />
earnings in the short to medium term.<br />
• Using a DCF valuation, we arrive at a target price for<br />
UBA of NGN 7.04, meaning the share is trading at a<br />
notable discount at its current price of NGN 2.50. We<br />
believe this reflects the market’s disappointment<br />
with recent results, as well as uncertainty around the<br />
structure (and indeed the need and timing) of the<br />
impending capital raise. HOLD<br />
1.4<br />
1.2<br />
1<br />
0.8<br />
0.6<br />
0.4<br />
0.2<br />
0<br />
17-Nov-10<br />
17-Dec-10<br />
17-Jan-11<br />
17-Feb-11<br />
17-Mar-11<br />
UBA vs NSE ASI<br />
17-Apr-11<br />
17-May-11<br />
17-Jun-11<br />
17-Jul-11<br />
17-Aug-11<br />
17-Sep-11<br />
17-Oct-11<br />
17-Nov-11<br />
Recommendation<br />
HOLD<br />
Bloomberg Code<br />
UBA:NL<br />
Current Price (NGN) 2.5<br />
Current Price (USc) 1.5<br />
Target Price (NGN) 7.0<br />
Target Price (USc) 4.3<br />
Upside (%) 181.5<br />
Liquidity<br />
Market Cap (NGN m) 80 837<br />
Shares (m) 32 335<br />
Free Float (est. %) 79.5<br />
Ave. daily vol ('000) - 1 yr. 20 451<br />
Price Performance<br />
Price, 12 months ago (NGN) 7.2<br />
Change (%) (65.5)<br />
Price, 6 months ago (NGN) 6.3<br />
Change (%) (60.2)<br />
Financials (NGN m) 31 Dec F2010 <strong>2011</strong>F 2012F<br />
Loans & Advances 628 811 724 149 862 406<br />
Net Interest Income (excl. Provisions) 70 776 71 333 92 591<br />
Non-Interest Income 67 441 69 135 84 589<br />
Attributable Earnings 668 13 575 24 668<br />
EPS (kobo) 2.6 46.6 76.3<br />
DPS (kobo) 5.0 8.4 19.1<br />
NAV/Share (kobo) 693.6 669.5 698.4<br />
Valuation Ratios Current <strong>2011</strong>F 2012F<br />
Earnings Yield* (%) 7.4 18.7 30.5<br />
Dividend Yield (%) 2.0 3.4 7.6<br />
PE* (x) 13.5 6.0 3.3<br />
PBV (x) 0.42 0.41 0.36<br />
RoaA (%) 0.0 0.7 1.1<br />
RoaE (%) 0.4 7.3 11.7<br />
Net Interest Margin (%) 6.0 5.7 6.1<br />
Cost to Income Ratio (%) 75.2 80.4 72.8<br />
* - trailing<br />
Strengths<br />
Weaknesses<br />
Top tier bank<br />
Inefficient asset mix despite largest branch<br />
<strong>Nigeria</strong>'s largest bank by distribution<br />
network<br />
channels<br />
RoAE currently lagging peers<br />
Brand<br />
Relatively small branch network vs top tier<br />
Opportunities<br />
Threats<br />
Consolidate SSA operations<br />
Longer gestation period for SSA expansion will<br />
Room for growth in LDR to improve margins keep CIR high and restrict earnings growth<br />
Growth in SSA inter-regional trade<br />
Increased regulatory risk due to cross border expansion<br />
UBA<br />
NSE ASI<br />
29
NGN (m)<br />
NGN (m)<br />
FY 10 & 9M 11 Financial & Operational Review<br />
Where many of its peers experienced an improved<br />
performance in FY 10 following the travails of FY 09, UBA<br />
had another relatively difficult year.<br />
Interest income was down 17.24% in FY 10 to NGN<br />
117.8bn compared to FY 09 (annualised), which was<br />
attributed to the declining yields on liquid assets for<br />
much of the year, of which UBA was a large holder. While<br />
the interest expense also declined, it was a relatively<br />
marginal fall of just 1.59% to NGN 47.0bn. Thus net<br />
interest income was down 25.15% y-o-y to NGN 70.8bn,<br />
while the net interest margin fell 1.40 percentage points<br />
to 6.0%. This was a function of the group’s asset mix,<br />
with loans and advances flat during the year while taking<br />
on higher holdings of lower yielding treasury bills.<br />
200 000<br />
180 000<br />
160 000<br />
140 000<br />
120 000<br />
100 000<br />
80 000<br />
60 000<br />
40 000<br />
20 000<br />
0<br />
2006 2007 2008 2009 2010 <strong>2011</strong> E 2012 E<br />
Attributable Earnings Total Operating Income<br />
Source: UBA/IAS<br />
45 000<br />
40 000<br />
35 000<br />
30 000<br />
25 000<br />
20 000<br />
15 000<br />
10 000<br />
5 000<br />
0<br />
Positively, non-interest income was up 29.60% y-o-y to<br />
NGN 67.4bn, driven by increases in fees and commissions<br />
income and gains on the sale of investments of NGN<br />
4.1bn. This brought operating income to NGN 138.2bn for<br />
the year, down 5.71%. <strong>Nigeria</strong> continued to dominate the<br />
revenue line, although the ex-<strong>Nigeria</strong> contribution did<br />
improve, from 10% in FY 09 to 12.9% in FY 10.<br />
Operating expenses growth was flat y-o-y, up just 1.22%<br />
to NGN 104.0bn. Staff costs increased by 21.28% to NGN<br />
37.9bn, but this was offset by the 9.53% decline in other<br />
expenses to NGN 55.1bn. Nevertheless, the cost to<br />
income ratio deteriorated to 75.23% compared with<br />
70.08%, propelled by ex-<strong>Nigeria</strong> expansion costs. The<br />
impairment charge was notably down from the FY 09<br />
figure of NGN 31.9bn to NGN 18.2bn as the group sought<br />
to adequately provide for all known losses in FY 10<br />
following the clean-up in FY 09. The reduction in<br />
provisions provided a fillip to net operating income which<br />
grew 33.60% to NGN 16.0bn.<br />
1 800 000<br />
1 600 000<br />
1 400 000<br />
1 200 000<br />
1 000 000<br />
800 000<br />
600 000<br />
400 000<br />
200 000<br />
0<br />
2006 2007 2008 2009 2010 <strong>2011</strong> E 2012 E<br />
Deposits Loans & Advances<br />
Source: UBA/IAS<br />
After accounting for share of losses from associates of<br />
NGN 138.0m and an NGN 12.7bn hit from losses on sale of<br />
assets to AMCON, attributable earnings of NGN 668.0m or<br />
2.6 kobo per share was recorded, (FY 09: NGN 1.7bn). A<br />
dividend of 5 kobo per share was declared for the year.<br />
Four of the ex-<strong>Nigeria</strong> operations were profitable, but<br />
overall the Africa operations remained loss making.<br />
Balance sheet growth was muted, with total assets<br />
growth of 4.45% y-o-y to NGN 1.6tn. Net loans and<br />
advances shrank by 1.25%, reflecting the sale of assets to<br />
AMCON and low risk appetite. The loan to deposit ratio<br />
was correspondingly slightly lower at 52.9% from 53.9%,<br />
with total deposits up just 1.04% to NGN 1.3tn, which was<br />
stated as a deliberate strategy to not chase deposits<br />
“beyond optimal levels” with rates expected to trend up<br />
in Q4 10. The contribution of ex-<strong>Nigeria</strong> operations to<br />
deposits increased to 14% from 11% in FY 09. Oil and gas<br />
was the largest contributor to the loan book with 16.4%,<br />
closely followed by the consumer sector at 13.6%, and the<br />
NPL ratio deteriorated to 8.8% from 7.9%. The poor<br />
bottom line return meant that RoAE and RoAA of just<br />
0.4% and 0.04% were recorded. CAR was 18.0%, a slight<br />
improvement from 16.3% at FY 09.<br />
10%<br />
10%<br />
10%<br />
Source: UBA/IAS<br />
Loans and Advances <strong>Sector</strong>al Split (Q3 11)<br />
Public <strong>Sector</strong><br />
9% 7%<br />
Transport & Comm.<br />
6%<br />
6%<br />
Agriculture<br />
5%<br />
Others<br />
Oil & Gas<br />
20%<br />
Personal & Professional<br />
17%<br />
Maufacturing<br />
Financial Institutions<br />
Telecoms<br />
General Commerce<br />
30
Interest income remained under pressure in UBA’s 9M 11<br />
results, down 5.77% gross, but with interest expense<br />
falling by a higher margin of 17.23%, net interest income<br />
gained 2.66% to NGN 56.1bn. Despite rising interest rates,<br />
the NIMs fell to 4.6% from 5.1% y-o-y, but were flat<br />
compared with H1 11. The disappointing performance was<br />
attributed to a “transmission lag effect” on earning assets<br />
yields. The group’s earning asset mix appears to still have<br />
some inefficiencies carried over from FY 10. The cost of<br />
funds did improve however, down to 2.60% from 4.00%.<br />
Non-interest income fared marginally better, up 4.61% to<br />
NGN 43.5bn. This was driven by increases in commissions<br />
and fees, transaction volumes and the performance of<br />
UBA’s remittance products. The combination of funded<br />
and non-funded income saw operating income increase by<br />
3.50% to NGN 99.6bn. The ex-<strong>Nigeria</strong> operations<br />
contributed 20% to operating income, up from 9.0% as at<br />
9M 10 and 19% at H1 11. Operating expenses reversed the<br />
interim results trend, increasing by 7.33% to NGN 78.9bn,<br />
resulting in a deterioration in the cost to income ratio to<br />
79.28% compared to 77.22% at H1 11 and 76.45% at 9M 10.<br />
Provision charges of NGN 8.7bn reflected a 53.11% rise y-<br />
o-y, as the mandatory 1% general provision came into<br />
effect, and seemingly high provisioning in the other<br />
African countries. Associate and JV share of profits was<br />
NGN 252.0m from a loss of NGN 75m in 9M 10. Without<br />
the non-recurring exceptional losses of NGN 5.3bn in the<br />
comparative period, PBT increased by 4.79% to NGN<br />
12.1bn. (Pre-exceptionals PBT was actually down 28.01%,<br />
however). Thanks to a lower effective tax rate,<br />
attributable earnings closed the 9M at NGN 11.1bn, up<br />
91.29%. Ex-<strong>Nigeria</strong> subsidiaries turned profitable,<br />
contributing NGN 706.0m to PBT on a net basis, against<br />
losses of NGN 2.9bn in FY 10.<br />
The balance sheet grew 11.42% from H1 11 to NGN 2.0tn.<br />
Net loans and advances shrunk by 1.47% during the<br />
quarter to end the 9M at NGN 705.3bn. Loan growth<br />
would have been higher (+23%), were it not for NGN<br />
88.0bn in sales to AMCON. The group NPL ratio improved<br />
to 6.0% (<strong>Nigeria</strong> 3.8%) from 10.8% at H1 11. Contrastingly,<br />
deposits and managed funds were 5.96% higher to NGN<br />
1.5tn. Gross LDR ended the period at 49.3% against<br />
53.62% at H1, while the CAR increased in sympathy to<br />
20.0% (H1 11: 17.0%). 13.7% (H1 11: 14.3%) of net loans<br />
and 16.0% (H1 11: 15.0%) of deposits were from Africa<br />
outside <strong>Nigeria</strong>. RevPar = Estimate<br />
UBA Q3 11 Results Summary (m) 30-Sep-11 30-Sep-10<br />
Net interest income 56 064 54 612<br />
Other Income 43 505 41 587<br />
Operating income 99 569 96 199<br />
Non-interest expense (78 934) (73 545)<br />
Allowance for credit impairment (8 744) (5 711)<br />
Operating profit 12 143 16 868<br />
Attributable earnings 11 133 5 820<br />
Outlook<br />
UBA will continue to focus on consolidating its<br />
position as one of the premier banks in <strong>Nigeria</strong>, while<br />
still looking for opportunities to expand further into<br />
the rest of the continent, with Angola and Mali in the<br />
pipeline. While we expect the group to improve on its<br />
H1 performance, with net interest margin and income<br />
improvements expected as loan growth mainly came<br />
through towards the end of the half, we think the<br />
pan-African expansion and cost implications thereof<br />
will continue to put a drag on profitability in the short<br />
to medium term.<br />
Post balance sheet, the group also announced its<br />
intention to raise NGN 500bn in additional capital as<br />
part of a strategic funding initiative, with proceeds to<br />
go into “infrastructure funding, opportunistic<br />
acquisitions and the consolidation of the bank’s<br />
channel and IT infrastructure across Africa.”<br />
Shareholders of UBA have ratified the capital raising<br />
exercise. The fund raising, according to a press<br />
release, is proposed to be a combination of debt and<br />
equity. The debt, to be issued in tranches, will be at a<br />
fixed or floating rate and is callable at the end of five<br />
years. The equity fund will be a combination of<br />
private placement and/or a GDR program to be listed<br />
on the London Stock Exchange. Further details are yet<br />
to be published.<br />
Valuation and Recommendation<br />
Using a DCF valuation, we arrive at a target price for<br />
UBA of NGN 7.04, with earnings recovering based on<br />
improved interest margins as risk assets increase,<br />
growing non-interest income and a falling CIR as the<br />
ex-<strong>Nigeria</strong> African operations continue to contribute<br />
positively. This suggests the share is trading at a<br />
notable discount at its current price of NGN 2.50.<br />
This, we believe, reflects the market’s<br />
disappointment with recent results, where it has<br />
failed to match the performance of its peers,<br />
particularly on the net interest line, while the African<br />
expansion has thus far not brought the returns<br />
investors may have hoped. A PBV of 0.42x reflects the<br />
apathy towards the stock. The capital raise will likely<br />
lead to further dilution in the short to medium term,<br />
and we await more details on the need, timing and<br />
intended use of funds. HOLD.<br />
30-Sep-11<br />
30-Jun-11<br />
Loans and advances to customers 705 289 715 844<br />
Deposits from customers 1 537 885 1 451 368<br />
Total equity 2 025 379 1 817 831<br />
Source: UBA<br />
31
Financial Summary<br />
Income Statement Summary 2006 A 2007 A 2008 A 2009 A 2010 A <strong>2011</strong> E 2012 E<br />
Net Interest Income Before Loss Provision 30 739 45 075 75 093 118 189 70 776 71 333 92 591<br />
Y-o-Y Growth 46.6% 66.6% 57.4% (40.1%) 0.8% 29.8%<br />
Non Interest Income 32 754 35 733 53 058 65 046 67 441 69 135 84 589<br />
Y-o-Y Growth 9.1% 48.5% 22.6% 3.7% 2.5% 22.4%<br />
Total Operating Income (incl Prov) 57 922 77 106 125 535 143 396 120 004 132 937 165 297<br />
Y-o-Y Growth 33.1% 62.8% 14.2% (16.3%) 10.8% 24.3%<br />
Operating Expense (45 111) (47 581) (68 713) (128 404) (103 981) (112 964) (128 910)<br />
Y-o-Y Growth 5.5% 44.4% 86.9% (19.0%) 8.6% 14%<br />
Profit Before Tax 12 811 25 364 48 029 6 637 3 219 20 111 36 545<br />
Y-o-Y Growth 98.0% 89.4% (86.2%) (51.5%) 524.8% 81.7%<br />
Attributable Net Income/Profit After Tax 11 550 21 540 41 239 2 113 668 13 575 24 668<br />
Y-o-Y Growth 86.5% 91.5% (94.9%) (68.4%) 1932.2% 81.7%<br />
Balance Sheet Summary 2006 A 2007 A 2008 A 2009 A 2010 A <strong>2011</strong> A 2012 E<br />
Cash & Short term Funds 471 494 570 315 774 957 538 420 370 328 469 231 475 444<br />
Y-o-Y Growth 21.0% 35.9% (30.5%) (31.2%) 26.7% 1.3%<br />
Financial Assets held for Trading 207 341 157 519 174 005 42 035 123 455 234 565 304 934<br />
Y-o-Y Growth (24.0%) 10.5% (75.8%) 193.7% 90.0% 30.0%<br />
Loans & Advances,Net 109 896 320 406 431 410 636 793 628 811 724 149 862 406<br />
Y-o-Y Growth 191.6% 34.6% 47.6% (1.3%) 15.2% 19.1%<br />
Deposits 762 574 905 806 1 365 289 1 261 457 1 274 627 1 603 356 1 822 717<br />
Y-o-Y Growth 18.8% 50.7% (7.6%) 1.0% 25.8% 13.7%<br />
Borrowings 1 135 1 135 - 14 760 82 144 193 038 183 386<br />
Y-o-Y Growth 0.0% (100.0%) NA 456.5% 135.0% (5.0%)<br />
Shareholder's Equity 48 835 168 078 195 281 186 829 179 426 194 822 225 817<br />
Y-o-Y Growth 244.2% 16.2% (4.3%) (4.0%) 8.6% 15.9%<br />
Per Share Data 2006 A 2007 A 2008 A 2009 A 2010 A <strong>2011</strong> A 2012 E<br />
Earning per Share (kobo) 187.2 261.9 314.0 9.8 2.6 46.6 76.3<br />
Y-o-Y Growth 39.9% 19.9% (96.9%) (73.7%) 1706.4% 63.5%<br />
Dividend Per Share (kobo) 100.00 120.00 100.00 10.00 5.00 8.40 19.07<br />
Y-o-Y Growth 20.0% (16.7%) (90.0%) (50.0%) 67.9% 127.1%<br />
Book Value Per Share (kobo) 791.6 2 043.3 1 486.8 866.7 693.6 669.5 698.4<br />
Y-o-Y Growth 158.1% (27.2%) (41.7%) (20.0%) (3.5%) 4.3%<br />
Tangible Book Value per share (kobo) 791.6 2 043.3 1 486.8 850.6 680.2 657.5 687.6<br />
Y-o-Y Growth 158.1% (27.2%) (42.8%) (20.0%) (3.3%) 4.6%<br />
Key Ratios 2006 A 2007 A 2008 A 2009 A 2010 A <strong>2011</strong> E 2012 E<br />
Gross Loan to Deposit Ratio 15.7% 37.0% 32.6% 53.9% 52.9% 50.9% 52.8%<br />
Gross Loan to Fund Ratio 15.7% 37.0% 32.6% 53.3% 49.7% 45.4% 48.0%<br />
Net Interest Income to total income 53.1% 58.5% 59.8% 82.4% 59.0% 53.7% 56.0%<br />
Cost to Income Ratio 71.0% 58.9% 53.6% 70.1% 75.2% 80.4% 72.8%<br />
Interest Income to average interest earning assets 7.0% 7.6% 8.8% 12.0% 7.8% 7.4% 8.1%<br />
Interest expense to average interest bearing liabilities 3.5% 3.4% 3.6% 4.5% 3.6% 4.0% 4.5%<br />
Net Interest Spread 3.5% 4.2% 5.2% 7.5% 4.3% 3.4% 3.7%<br />
Net Income Margin 19.9% 27.9% 32.9% 1.5% 0.6% 10.2% 14.9%<br />
Accumulated Provision as a % of loans & Advances 9.5% 4.9% 3.3% 7.2% 9.8% 9.6% 9.3%<br />
Return on Equity (average) 23.7% 19.9% 22.7% 1.1% 0.4% 7.3% 11.7%<br />
Return on Assets (average) 1.3% 2.1% 2.9% 0.1% 0.0% 0.7% 1.1%<br />
Return on risk weighted assets 1.1% 2.3% 3.0% 0.1% 0.0% 0.5% 1.5%<br />
Non-interest income to total income 56.5% 46.3% 42.3% 45.4% 56.2% 52.0% 51.2%<br />
Provision expense as a % of advances 4.7% 1.1% 0.6% 5.9% 2.7% 1.5% 1.7%<br />
Advances to equity 225.0% 190.6% 220.9% 340.8% 350.5% 371.7% 381.9%<br />
32
EQUITY RESEARCH<br />
NIGERIA<br />
DECEMBER <strong>2011</strong><br />
BANKING<br />
The bank was incorporated on 30 May 1990 as Zenith<br />
International Bank Limited, as a private limited<br />
company, and was licensed to carry on the business of<br />
banking in June 1990. The bank changed name to<br />
Zenith Bank Plc on 20 May 2004, and its shares were<br />
listed on the NSE on 21 October 2004. The group now<br />
has operations not only in <strong>Nigeria</strong>, but also in Ghana,<br />
the UK, Sierra Leone, the Gambia and a rep office in<br />
South Africa. The group has a network of 315 branches.<br />
• Driven by a reduction in the net provision charge and<br />
a lower tax rate, Zenith saw attributable earnings<br />
more than double in FY 10 to NGN 37.4bn compared<br />
with the annualised FY 09 results.<br />
• That earnings momentum was not sustained through<br />
9M 11, however, as this time higher provisions as well<br />
as cost pressures led to attributable earnings growth<br />
of a still impressive 37.91% to NGN 42.5bn.<br />
• The ‘rest of Africa’ operations continued to be a<br />
positive contributor to the bottom line on a net basis.<br />
• Zenith should have concluded any sales to AMCON by<br />
31 st October <strong>2011</strong> in line with the target set by the<br />
‘bad bank’. Its main exposure requiring to be purged<br />
was to Zenon. Zenith participated in the NPL sale to<br />
AMCON in H1 to the tune of NGN 37bn, for which the<br />
bank received NGN 17bn in AMCON bonds, while NGN<br />
35bn in write backs/recoveries was recorded. The<br />
NPL ratio remained below 4% and is expected to<br />
remain at current levels going forward.<br />
• The group remains very liquid, with a relatively low<br />
LDR. With the MPR rate having risen in in H2, we<br />
expect Zenith to benefit through improved NIMs. The<br />
LDR at 56.60% also provides a lot of room for risk<br />
asset growth going forward.<br />
• Using a DCF valuation, we arrive at a target price for<br />
Zenith Bank of NGN 16.68, representing 45.7% upside<br />
on its current share price of NGN 11.45. After GTB,<br />
this is our second favourite pick in the sector. BUY.<br />
Recommendation<br />
BUY<br />
Bloomberg Code<br />
ZENITHBA:NL<br />
Current Price (NGN) 11.5<br />
Current Price (USc) 7.1<br />
Target Price (NGN) 16.7<br />
Target Price (USc) 10.3<br />
Upside (%) 45.7<br />
Liquidity<br />
Market Cap (NGN m) 359 490<br />
Shares (m) 31 396<br />
Free Float (est. %) 85.5<br />
Ave. daily vol ('000) - 1 yr. 32 304<br />
Price Performance<br />
Price, 12 months ago (NGN) 15.1<br />
Change (%) (24.4)<br />
Price, 6 months ago (NGN) 15.1<br />
Change (%) (24.2)<br />
Financials (NGN m) 31 Dec F2010 <strong>2011</strong>F 2012F<br />
Loans & Advances 749 009 916 313 1 087 716<br />
Net Interest Income (excl. Provisions) 91 546 120 006 146 916<br />
Non-Interest Income 60 602 87 821 107 839<br />
Attributable Earnings 37 330 55 776 69 238<br />
EPS (kobo) 119.2 178.5 221.6<br />
DPS (kobo) 85.0 89.3 110.8<br />
NAV/Share (kobo) 1 158.0 1 283.8 1 450.2<br />
Valuation Ratios Current <strong>2011</strong>F 2012F<br />
Earnings Yield* (%) 13.6 15.6 19.4<br />
Dividend Yield (%) 7.4 7.8 9.7<br />
PE* (x) 7.3 6.4 5.2<br />
PBV (x) 0.9 0.9 0.8<br />
RoaA (%) 2.1 2.6 2.8<br />
RoaE (%) 10.6 14.6 16.1<br />
Net Interest Margin (%) 5.9 6.0 6.3<br />
Cost to Income Ratio (%) 64.3 64.2 62.3<br />
* - trailing<br />
Zenith Bank vs NSE ASI<br />
1.5<br />
1.4<br />
1.3<br />
1.2<br />
1.1<br />
1<br />
0.9<br />
0.8<br />
0.7<br />
0.6<br />
0.5<br />
17-Nov-10<br />
17-Dec-10<br />
17-Jan-11<br />
17-Feb-11<br />
17-Mar-11<br />
17-Apr-11<br />
17-May-11<br />
17-Jun-11<br />
17-Jul-11<br />
17-Aug-11<br />
17-Sep-11<br />
17-Oct-11<br />
17-Nov-11<br />
Strengths<br />
Weaknesses<br />
Top tier bank<br />
Somewhat conservative as shown by low LDR and high<br />
Branch network<br />
CAR, could sweat assets harder<br />
IT focused<br />
Zenon loan - should now be resolved via AM CON<br />
Strong, liquid balance sheet<br />
Focus on increasingly competitive top-end corporate space<br />
Oppo rtunities<br />
T hreats<br />
M id to lower end of the market<br />
M id-tier M &A activity to lead to increased competition<br />
Room for growth in LDR to improve margins<br />
with e.g. Zenith branch network falling in pecking order<br />
Increase contribution from SSA businesses Increased regulatory risk due to cross border expansion<br />
Zenith Bank<br />
NSE ASI<br />
33
NGN (m)<br />
NGN (m)<br />
FY 10 & 9M 11 Financial & Operational Review<br />
The 15M Dec 09 results, again a function of the<br />
harmonisation of bank year ends to <strong>December</strong> by the<br />
CBN, saw Zenith produce a performance that given the<br />
state of affairs, was relatively impressive, with earnings<br />
of NGN 20.6bn being attained.<br />
On an annualised basis in comparison with FY 10, the<br />
latter recorded net interest income growth of 4.42% to<br />
NGN 91.5bn, as a 17.81% fall in interest income to NGN<br />
127.3bn was offset by the even bigger interest expense<br />
decline of 46.82% to NGN 35.7bn, as market interest rates<br />
declined. The increase in lower cost demand and savings<br />
deposits to 71% of the total from 63% at the prior period<br />
reflected the change in deposit structure to facilitate<br />
better yields.<br />
250 000<br />
200 000<br />
150 000<br />
100 000<br />
50 000<br />
0<br />
2005 2007 2008 2009 2010 <strong>2011</strong> E 2012 E<br />
Attributable Earnings Total Operating Income<br />
Source: Zenith Bank<br />
60 000<br />
50 000<br />
40 000<br />
30 000<br />
20 000<br />
10 000<br />
0<br />
Conversely, non-interest income was down 3.68% y-o-y to<br />
NGN 60.6bn, hamstrung by a 31.28% decline in foreign<br />
exchange traded income to NGN 10.8bn which offset the<br />
4.93% increase in fees and commissions to NGN 46.2bn.<br />
Operating expenses growth, although growing ahead of<br />
revenue, was well contained to a sub-inflation 7.88%,<br />
closing the year at NGN 97.8bn (FY 09: NGN 90.6bn). The<br />
cost to income ratio thus worsened to 64.26% from to<br />
60.18%. FY 09 had seen provisions jump to NGN 31.9bn,<br />
driven by CBN policy, and the number came down<br />
substantially in FY 10 to NGN 4.4bn, with large capital<br />
market positions in particular having been provided for in<br />
the prior year. As a result, net operating income surged<br />
(in this case also PBT) by 78.23% to NGN 50.0bn.<br />
Attributable earnings more than doubled to NGN 37.4bn<br />
(FY 09: 16.5bn), benefiting from a lower tax rate of<br />
25.21% compared with 41.28% on the annualised<br />
comparatives. The dividend proposed for the year was 85<br />
kobo per share, an 88.89% increase and payout ratio of<br />
71.43%. <strong>Nigeria</strong> remained the dominant contributor to the<br />
group with a 93.49% contribution to revenues.<br />
1 800 000<br />
1 600 000<br />
1 400 000<br />
1 200 000<br />
1 000 000<br />
800 000<br />
600 000<br />
400 000<br />
200 000<br />
0<br />
2005 2007 2008 2009 2010 <strong>2011</strong> E 2012 E<br />
Deposits Loans & Advances<br />
Source: Zenith Bank<br />
The balance sheet recorded total assets growth of 14.18%<br />
y-o-y to NGN 1.9tn. Net loans and advances growth was<br />
cautious, growing by 6.42% to NGN 749.0bn, as the loan<br />
to deposit ratio decreased to 58.2% from 64.1%. The loan<br />
book as at FY 10 was well diversified, with no single<br />
sector comprising more than 10% of the total. The NPL<br />
ratio improved to 5.9% from 6.5%. As a result of the<br />
conservative loan book growth, the group invested in<br />
more liquid assets, with financial assets held for trading<br />
and investments in securities up 26.84% and 33.61%<br />
respectively.<br />
Deposits growth was well ahead of the growth in loans<br />
and advances at 14.50% to NGN 1.3tn. As previously<br />
mentioned, the lower cost deposit mix improved during<br />
the year helping to boost net interest income, and<br />
customer deposits at 69.6% (FY 09: 70.7%) continued to<br />
dominate the funding mix. RoAE and RoAA closed the year<br />
at 10.6% and 2.1% respectively, with the reported CAR at<br />
33%.<br />
6.9%<br />
1.8%<br />
6.4%<br />
4.6%<br />
1.0%<br />
7.3%<br />
9.3%<br />
Source: Zenith Bank<br />
5.6%<br />
Loans and Advances <strong>Sector</strong>al Split (H1 11)<br />
2.4%<br />
6.4%<br />
5.7%<br />
2.3%<br />
6.7%<br />
5.3%<br />
9.7%<br />
5.8%<br />
8.0%<br />
4.9%<br />
Power<br />
Flour Mills<br />
Cement Manufacturing<br />
Food & Processing<br />
Beverages & Tobacco<br />
Other Manufacturing<br />
Upstream Oil & Gas<br />
Downstream Oil &Gas<br />
Transportation<br />
Communication<br />
General Commerce<br />
Capital market<br />
Other<br />
Consumer Credit<br />
Real Estate & Construction<br />
Government<br />
Agriculture<br />
Finance and Insurance<br />
34
For the 9M results to 30 September <strong>2011</strong>, gross earnings<br />
were up 31.06% to NGN 183.0bn. Both net interest income<br />
(up 48.85% to NGN 94.0bn) and non-interest income (up<br />
33.64% to NGN 63.2bn) showed an impressive growth<br />
trajectory. The growth in net interest income was<br />
particularly impressive as income went up 29.73% against<br />
a decline in the interest expense of 11.73%. This led to an<br />
improvement in NIMs to 10.50% from 7.52% at H1 11 and<br />
5.95% at year end. Fees and commissions income made up<br />
the bulk of the non-funded income at 78.4% and were<br />
mainly responsible for the increase in that line item.<br />
Operating income increased by 42.58% to NGN 157.3bn,<br />
but that notable growth rate was overshadowed by the<br />
44.19% increase in operating expenses to NGN 99.9bn.<br />
This led to the cost to income ratio declining to 63.52%<br />
against 62.71% in the comparative period, continuing the<br />
trend from the half year, where inflation and mandatory<br />
provisions were cited as the main contributors to the<br />
deterioration of the ratio.<br />
The provisioning charge was 3.5x higher y-o-y at NGN<br />
7.2bn, (NGN 5.4bn at the half year). The higher costs<br />
diluted PBT growth to 28.03%, but a lower effective tax<br />
rate reversed that impact with attributable earnings up<br />
37.91% to NGN 42.5bn.<br />
The bulk of the group’s earnings, 95.45%, came from the<br />
<strong>Nigeria</strong> operation, with the ‘Rest of Africa’ contributing<br />
NGN 1.24bn (9M 10: NGN 1.2bn) and Europe NGN 712.0m<br />
against NGN 426.0m in 9M 10.<br />
The balance sheet grew 7.30% from the H1 11 position to<br />
NGN 2.2tn. Net loans and advances were up 5.79% to NGN<br />
839.9bn, while deposits were up at a slightly higher pace<br />
of 6.89% to NGN 1.5tn. The published NPL ratio showed a<br />
30bp deterioration to 3.6% compared with 3.3% at the<br />
interim stage, but was almost half the 6.4% ratio at FY<br />
10. The loan to deposit ratio increased slightly to 56.60%<br />
from 55.97% at H1 11. Rising yields on treasury bills were<br />
reflected in the 23.11% increase in treasury bill holdings<br />
to NGN 442.9bn. The CAR remained well above regulatory<br />
requirements at 28.5% (H1 11: 28%).<br />
ZENITH Q3 11 Results Summary (m) 30-Sep-11 30-Sep-10<br />
Net interest income 94 015 63 161<br />
Other Income 63 235 47 318<br />
Operating income 157 250 110 479<br />
Non-interest expense (99 891) (69 279)<br />
Allowance for credit impairment (7 225) (2 041)<br />
Operating profit 50 134 39 159<br />
Attributable earnings 42 516 30 828<br />
30-Sep-11<br />
30-Jun-11<br />
Loans and advances to customers 839 863 793 874<br />
Deposits from customers 1 545 114 1 445 508<br />
Total equity 380 604 367 754<br />
Source: Zenith Bank<br />
Outlook<br />
Zenith will continue to focus on competing for market<br />
share, but focused on the very competitive top end of<br />
the corporate market, the strategy being to fund high<br />
quality assets with cheap retail deposits. It will also<br />
maintain its technologically driven bias, as well as<br />
look for more opportunities for entering new markets<br />
and further diversifying its product and geographical<br />
mix. Cost containment is another facet the group will<br />
focus on as it aims to keep driving down its CIR. The<br />
bank is also expected to have completed its AMCON<br />
sales as per the deadline set by AMCON of 31 October,<br />
largely related to its exposure to Zenon.<br />
We expect Zenith to more or less maintain the same<br />
momentum in earnings as shown at the 9M results,<br />
with an improved performance into 2012 buoyed by<br />
improved margins, an increase in risk assets,<br />
continued low NPL ratios and an improving CIR.<br />
Valuation and Recommendation<br />
Using a DCF valuation, we arrive at a target price for<br />
Zenith Bank of NGN 16.68, representing 45.7% upside<br />
on its current share price of NGN 11.45. After GTB,<br />
this is our second favourite pick in the sector. BUY.<br />
35
Financial Summary<br />
Income Statement Summary 2005 A 2006 A 2007 A 2008 A 2009 A 2010 A <strong>2011</strong> E 2012 E<br />
Net Interest Income Before Loss Provision 17 265 26 832 44 586 88 792 109 588 91 546 120 006 146 916<br />
Y-o-Y Growth 55.4% 66.2% 99.1% 23.4% (16.5%) 31.1% 22.4%<br />
Non Interest Income 12 028 20 927 31 255 65 904 78 650 60 602 87 821 107 839<br />
Y-o-Y Growth 74.0% 49.4% 110.9% 19.3% (22.9%) 44.9% 22.8%<br />
Total Operating Income (incl Prov) 27 318 46 452 74 009 148 369 148 373 147 795 197 559 240 467<br />
Y-o-Y Growth 70.0% 59.3% 100.5% 0.0% (0.4%) 33.7% 21.7%<br />
Operating Expense (18 154) (31 298) (39 117) (65 936) (113 288) (97 769) (133 495) (158 600)<br />
Y-o-Y Growth 72.4% 25.0% 68.6% 71.8% (13.7%) 36.5% 18.8%<br />
Profit Before Tax 9 165 15 154 34 892 82 433 35 085 50 026 64 064 81 866<br />
Y-o-Y Growth 65.4% 130.2% 136.3% (57.4%) 42.6% 28.1% 27.8%<br />
Attributable Net Income/Profit After Tax 5 362 8 546 18 677 51 609 20 497 37 330 55 776 69 238<br />
Y-o-Y Growth 59.4% 118.5% 176.3% (60.3%) 82.1% 49.4% 24.1%<br />
Balance Sheet Summary 2005 A 2006 A 2007 A 2008 A 2009 A 2010 A <strong>2011</strong> E 2012 E<br />
Cash & Short term Funds 88 177 151 380 238 819 552 186 468 609 541 227 659 293 647 861<br />
Y-o-Y Growth 71.7% 57.8% 131.2% (15.1%) 15.5% 21.8% (1.7%)<br />
Financial Assets held for Trading 92 230 208 911 336 138 624 117 236 096 299 456 374 197 460 146<br />
Y-o-Y Growth 126.5% 60.9% 85.7% (62.2%) 26.8% 25.0% 23.0%<br />
Loans & Advances,Net 123 336 201 424 295 258 456 316 703 832 749 009 916 313 1 087 716<br />
Y-o-Y Growth 63.3% 46.6% 54.5% 54.2% 6.4% 22.3% 18.7%<br />
Deposits 233 413 392 864 639 242 1 191 752 1 173 917 1 344 121 1 654 936 1 889 440<br />
Y-o-Y Growth 68.3% 62.7% 86.4% (1.5%) 14.5% 23.1% 14.2%<br />
Borrowings 12 750 21 948 34 570 35 984 27 975 23 779 20 212<br />
Y-o-Y Growth NA 72.1% 57.5% 4.1% (22.3%) (15.0%) (15.0%)<br />
Shareholder's Equity 37 790 93 801 116 455 346 619 337 793 363 561 403 064 455 316<br />
Y-o-Y Growth 148.2% 24.2% 197.6% (2.5%) 7.6% 10.9% 13.0%<br />
Per Share Data 2005 A 2006 A 2007 A 2008 A 2009 A 2010 A <strong>2011</strong> E 2012 E<br />
Earning per Share (kobo) 135.7 190.9 302.9 580.6 82.0 119.2 178.5 221.6<br />
Y-o-Y Growth 40.7% 58.6% 91.7% (85.9%) 45.3% 49.8% 24.1%<br />
Dividend Per Share (kobo) 70.00 110.00 100.00 170.00 45.00 85.00 89.27 110.82<br />
Y-o-Y Growth 57.1% (9.1%) 70.0% (73.5%) 88.9% 5.0% 24.1%<br />
Book Value Per Share (kobo) 716.5 1 558.8 1 260.0 2 570.0 1 344.9 1 158.0 1 283.8 1 450.2<br />
Y-o-Y Growth 117.6% (19.2%) 104.0% (47.7%) (13.9%) 10.9% 13.0%<br />
Tangible Book Value per share (kobo) 716.5 1 558.8 1 260.0 2 570.0 1 344.9 1 158.0 1 283.8 1 450.2<br />
Y-o-Y Growth 117.6% (19.2%) 104.0% (47.7%) (13.9%) 10.9% 13.0%<br />
Key Ratios 2005 A 2006 A 2007 A 2008 A 2009 A 2010 A <strong>2011</strong> E 2012 E<br />
Gross Loan to Deposit Ratio 54.1% 52.4% 47.2% 39.5% 64.1% 58.2% 57.5% 59.7%<br />
Gross Loan to Fund Ratio 54.1% 50.7% 45.6% 38.3% 62.2% 57.0% 56.7% 59.0%<br />
Net Interest Income to total income 63.2% 57.8% 60.2% 59.8% 73.9% 61.9% 60.7% 61.1%<br />
Cost to Income Ratio 62.0% 65.5% 51.6% 42.6% 60.2% 64.3% 64.2% 62.3%<br />
Interest Income to average interest earning assets 7.3% 8.4% 8.5% 10.8% 11.6% 7.4% 8.9% 8.8%<br />
Interest expense to average interest bearing liabilities 2.4% 3.3% 3.6% 5.7% 6.9% 2.8% 4.0% 3.7%<br />
Net Interest Spread 4.9% 5.1% 4.9% 5.2% 4.7% 4.6% 4.8% 5.2%<br />
Net Income Margin 19.6% 18.4% 25.2% 34.8% 13.8% 25.3% 28.2% 28.8%<br />
Accumulated Provision as a % of loans & Advances 2.5% 2.2% 0.9% 3.0% 7.4% 4.1% 3.5% 3.2%<br />
Return on Equity (average) 14.2% 13.0% 17.8% 22.3% 6.0% 10.6% 14.6% 16.1%<br />
Return on Assets (average) 1.6% 1.8% 2.4% 3.7% 1.2% 2.1% 2.6% 2.8%<br />
Non-interest income to total income 44.0% 45.1% 42.2% 44.4% 53.0% 41.0% 44.5% 44.8%<br />
Provision expense as a % of advances 1.6% 0.6% 0.6% 1.3% 5.3% 0.6% 1.2% 1.3%<br />
Advances to equity 326.4% 214.7% 253.5% 131.6% 208.4% 206.0% 227.3% 238.9%<br />
36
<strong>Imara</strong> Africa<br />
Securities (A<br />
division of<br />
<strong>Imara</strong> SP Reid)<br />
<strong>Imara</strong> House<br />
Block 3, 257<br />
Oxford Road,<br />
Illovo<br />
Johannesburg<br />
2146<br />
South Africa<br />
Tel: +27 11<br />
550 6200<br />
Fax: +27 11<br />
550 6295<br />
<strong>Imara</strong><br />
Securities<br />
Angola SCVM<br />
Limitada<br />
Rua Rainha<br />
Ginga 74, 13 th<br />
Floor,<br />
Luanda<br />
Angola<br />
Tel: +244 222<br />
372 029/36<br />
Fax: +244 222<br />
332 340<br />
Capital Securities<br />
Ground Floor<br />
Plot 64511<br />
Showgrounds<br />
Gaborone<br />
Botswana<br />
Tel: +267 3188886<br />
Fax +267 3188887<br />
Members of the<br />
Botswana Stock<br />
Exchange<br />
<strong>Imara</strong> Edwards<br />
Securities (Pvt.) Ltd.<br />
Tendeseka Office Park<br />
1 st Floor Block 2<br />
Samora Machel Avenue<br />
Harare<br />
Zimbabwe<br />
Tel: +263 4 790590<br />
Fax: +263 4 791435<br />
4 Fanum House<br />
Cnr. Leopold<br />
Takawira/Josiah<br />
Tongogara Street<br />
Bulawayo<br />
Zimbabwe<br />
Tel: +263 9 74554<br />
Fax: +263 9 66024<br />
<strong>Imara</strong> S.P. Reid<br />
(Pty) Ltd<br />
<strong>Imara</strong> House<br />
257 Oxford Road<br />
Illovo 2146<br />
P.O. Box 969<br />
Johannesburg 2000<br />
South Africa<br />
Tel: +27 11 550<br />
6200<br />
Fax: +27 11 550<br />
6295<br />
Members of the<br />
JSE Limited<br />
Stockbrokers<br />
Malawi Ltd<br />
Able House<br />
Cnr. Hanover<br />
Avenue/<br />
Chilembwe Road<br />
Blantyre<br />
Malawi<br />
Tel: +265<br />
1822803<br />
Members of the<br />
Malawi Stock<br />
Exchange<br />
Namibia Equity<br />
Brokers (Pty)<br />
Ltd<br />
1st Floor City<br />
Centre<br />
Building, West<br />
Wing<br />
Levinson Arcade<br />
Windhoek<br />
Namibia<br />
Tel: +264 61<br />
246666<br />
Fax: +264<br />
61256789<br />
Members of the<br />
Namibia Stock<br />
Exchange<br />
Stockbrokers<br />
Zambia Ltd<br />
2nd Floor,<br />
Design<br />
House<br />
P O Box 38956<br />
Lusaka<br />
Zambia<br />
Tel: +260<br />
1227303<br />
Fax:<br />
+2601221055<br />
Members of<br />
the Lusaka<br />
Stock<br />
Exchange<br />
Members of the<br />
Zimbabwe Stock<br />
Exchange<br />
This research report is not an offer to sell or the solicitation of an offer to buy or subscribe for any securities. The securities referred to in this report may not be eligible for sale in some jurisdictions. The<br />
information contained in this report has been compiled by <strong>Imara</strong> S.P. Reid (Pty) Ltd, (“<strong>Imara</strong>”) from sources that it believes to be reliable, but no representation or warranty is made or guarantee given by<br />
<strong>Imara</strong> or any other person as to its accuracy or completeness. All opinions and estimates expressed in this report are (unless otherwise indicated) entirely those of <strong>Imara</strong> as of the date of this report only<br />
and are subject to change without notice. Neither <strong>Imara</strong> nor any other member of the <strong>Imara</strong> group of companies including their respective associated companies (together “Group Companies”), nor any<br />
other person, accepts any liability whatsoever for any loss howsoever arising from any use of this report or its contents or otherwise arising in connection therewith. Each recipient of this report shall be<br />
solely responsible for making its own independent investigation of the business, financial condition and prospects of companies referred to in this report. Group Companies and their respective affiliates,<br />
officers, directors and employees, including persons involved in the preparation or issuance of this report may, from time to time (i) have positions in, and buy or sell, the securities of companies referred<br />
to in this report (or in related investments); (ii) have a consulting, investment banking or broking relationship with a company referred to in this report; and (iii) to the extent permitted under applicable<br />
law, have acted upon or used the information contained or referred to in this report including effecting transactions for their own account in an investment (or related investment) in respect of any<br />
company referred to in this report, prior to or immediately following its publication. This report may not have been distributed to all recipients at the same time. This report is issued only for the<br />
information of and may only be distributed to professional investors (or, in the case of the United States, major US institutional investors as defined in Rule 15a-6 of the US Securities Exchange Act of 1934)<br />
and dealers in securities and must not be copied, published or reproduced or redistributed (in whole or in part) by any recipient for any purpose. © <strong>Imara</strong> S.P. Reid (Pty) Ltd.