'STAMENOID PETALS' IN A NATURAL HOMEOTIC VARIANT OF
'STAMENOID PETALS' IN A NATURAL HOMEOTIC VARIANT OF
'STAMENOID PETALS' IN A NATURAL HOMEOTIC VARIANT OF

You also want an ePaper? Increase the reach of your titles
YUMPU automatically turns print PDFs into web optimized ePapers that Google loves.
Chapter 2 Genetic differentiation of a natural homeotic variant<br />
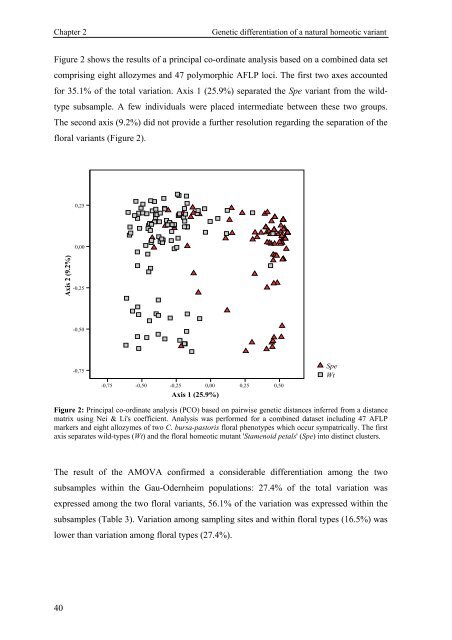
Figure 2 shows the results of a principal co-ordinate analysis based on a combined data set<br />
comprising eight allozymes and 47 polymorphic AFLP loci. The first two axes accounted<br />
for 35.1% of the total variation. Axis 1 (25.9%) separated the Spe variant from the wild-<br />
type subsample. A few individuals were placed intermediate between these two groups.<br />
The second axis (9.2%) did not provide a further resolution regarding the separation of the<br />
floral variants (Figure 2).<br />
40<br />
Axis 2 (9.2%)<br />
0,25<br />
0,00<br />
-0,25<br />
-0,50<br />
-0,75<br />
-0,75<br />
-0,50<br />
-0,25<br />
0,00<br />
Axis 1 (25.9%)<br />
Figure 2: Principal co-ordinate analysis (PCO) based on pairwise genetic distances inferred from a distance<br />
matrix using Nei & Li's coefficient. Analysis was performed for a combined dataset including 47 AFLP<br />
markers and eight allozymes of two C. bursa-pastoris floral phenotypes which occur sympatrically. The first<br />
axis separates wild-types (Wt) and the floral homeotic mutant 'Stamenoid petals' (Spe) into distinct clusters.<br />
The result of the AMOVA confirmed a considerable differentiation among the two<br />
subsamples within the Gau-Odernheim populations: 27.4% of the total variation was<br />
expressed among the two floral variants, 56.1% of the variation was expressed within the<br />
subsamples (Table 3). Variation among sampling sites and within floral types (16.5%) was<br />
lower than variation among floral types (27.4%).<br />
0,25<br />
0,50<br />
Spe<br />
Wt