Patterns of Late Glacial vegetation in The Netherlands - VU-DARE ...
Patterns of Late Glacial vegetation in The Netherlands - VU-DARE ...
Patterns of Late Glacial vegetation in The Netherlands - VU-DARE ...

Create successful ePaper yourself
Turn your PDF publications into a flip-book with our unique Google optimized e-Paper software.
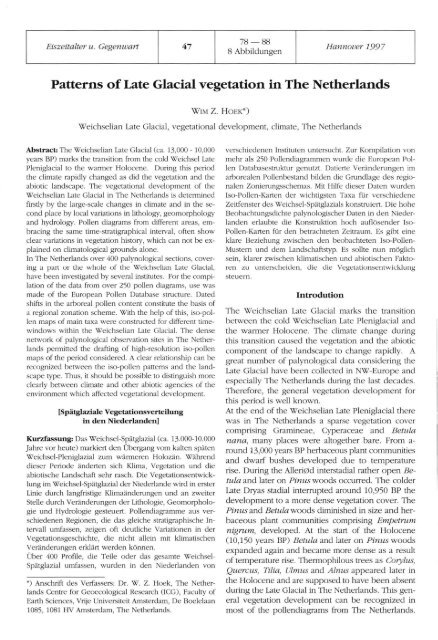
Eiszeitalter u. Gegenwart 47<br />
78 — 88<br />
8 Abbildungen<br />
Hannover 1997<br />
<strong>Patterns</strong> <strong>of</strong> <strong>Late</strong> <strong>Glacial</strong> <strong>vegetation</strong> <strong>in</strong> <strong>The</strong> <strong>Netherlands</strong><br />
WIM Z. HOEK*)<br />
Weichselian <strong>Late</strong> <strong>Glacial</strong>, <strong>vegetation</strong>al development, climate, <strong>The</strong> <strong>Netherlands</strong><br />
Abstract: <strong>The</strong> Weichselian <strong>Late</strong> <strong>Glacial</strong> (ca. 13,000 -10,000<br />
years BP) marks the transition from the cold Weichsel <strong>Late</strong><br />
Pleniglacial to the warmer Holocene. Dur<strong>in</strong>g this period<br />
the climate rapidly changed as did the <strong>vegetation</strong> and the<br />
abiotic landscape. <strong>The</strong> <strong>vegetation</strong>al development <strong>of</strong> the<br />
Weichselian <strong>Late</strong> <strong>Glacial</strong> <strong>in</strong> <strong>The</strong> <strong>Netherlands</strong> is determ<strong>in</strong>ed<br />
firstly by the large-scale changes <strong>in</strong> climate and <strong>in</strong> the second<br />
place by local variations <strong>in</strong> lithology, geomorphology<br />
and hydrology. Pollen diagrams from different areas, embrac<strong>in</strong>g<br />
the same time-stratigraphical <strong>in</strong>terval, <strong>of</strong>ten show<br />
clear variations <strong>in</strong> <strong>vegetation</strong> history, which can not be expla<strong>in</strong>ed<br />
on climatological grounds alone.<br />
In <strong>The</strong> <strong>Netherlands</strong> over 400 palynological sections, cover<strong>in</strong>g<br />
a part or the whole <strong>of</strong> the Weichselian <strong>Late</strong> <strong>Glacial</strong>,<br />
have been <strong>in</strong>vestigated by several <strong>in</strong>stitutes. For the compilation<br />
<strong>of</strong> the data from over 250 pollen diagrams, use was<br />
made <strong>of</strong> the European Pollen Database structure. Dated<br />
shifts <strong>in</strong> the arboreal pollen content constitute the basis <strong>of</strong><br />
a regional zonation scheme. With the help <strong>of</strong> this, iso-pollen<br />
maps <strong>of</strong> ma<strong>in</strong> taxa were constructed for different timew<strong>in</strong>dows<br />
with<strong>in</strong> the Weichselian <strong>Late</strong> <strong>Glacial</strong>. <strong>The</strong> dense<br />
network <strong>of</strong> palynological observation sites <strong>in</strong> <strong>The</strong> <strong>Netherlands</strong><br />
permitted the draft<strong>in</strong>g <strong>of</strong> high-resolution iso-pollen<br />
maps <strong>of</strong> the period considered. A clear relationship can be<br />
recognized between the iso-pollen patterns and the landscape<br />
type. Thus, it should be possible to dist<strong>in</strong>guish more<br />
clearly between climate and other abiotic agencies <strong>of</strong> the<br />
environment which affected <strong>vegetation</strong>al development,<br />
[Spätglaziale Vegetationsverteilung<br />
<strong>in</strong> den Niederlanden]<br />
Kurzfassung: Das Weichsel-Spätglazial (ca. 13.000-10.000<br />
Jahre vor heute) markiert den Übergang vom kalten späten<br />
Weichsel-Pleniglazial zum wärmeren Holozän. Während<br />
dieser Periode änderten sich Klima, Vegetation und die<br />
abiotische Landschaft sehr rasch. Die Vegetationsentwicklung<br />
im Weichsel-Spätglazial der Niederlande wird <strong>in</strong> erster<br />
L<strong>in</strong>ie durch langfristige Klimaänderungen und an zweiter<br />
Stelle durch Veränderungen der Lithologie, Geomorphologie<br />
und Hydrologie gesteuert. Pollendiagramme aus verschiedenen<br />
Regionen, die das gleiche stratigraphische Intervall<br />
umfassen, zeigen <strong>of</strong>t deutliche Variationen <strong>in</strong> der<br />
Vegetationsgeschichte, die nicht alle<strong>in</strong> mit klimatischen<br />
Veränderungen erklärt werden können.<br />
Über 400 Pr<strong>of</strong>ile, die Teile oder das gesamte Weichsel-<br />
Spätglazial umfassen, wurden <strong>in</strong> den Niederlanden von<br />
*) Anschrift des Verfassers: Dr. W. Z. Hoek, <strong>The</strong> <strong>Netherlands</strong><br />
Centre for Geoecological Research (ICG), Faculty <strong>of</strong><br />
Earth Sciences, Vrije Universiteit Amsterdam, De Boelelaan<br />
1085, 1081 HV Amsterdam, <strong>The</strong> <strong>Netherlands</strong>.<br />
verschiedenen Instituten untersucht. Zur Kompilation von<br />
mehr als 250 Pollendiagrammen wurde die Etiropean Pollen<br />
Databasestruktur genutzt. Datierte Veränderungen im<br />
arborealen Pollenbestand bilden die Grundlage des regionalen<br />
Zonien<strong>in</strong>gsschemas. Mit Hilfe dieser Daten wurden<br />
Iso-Pollen-Karten der wichtigsten Taxa für verschiedene<br />
Zeitfenster des Weichsel-Spätglazials konstruiert. Die hohe<br />
Beobachtungsdichte palynologischer Daten <strong>in</strong> den Niederlanden<br />
erlaubte die Konstntktion hoch auflösender Iso<br />
Pollen-Karten für den betrachteten Zeitraum. Es gibt e<strong>in</strong>e<br />
klare Beziehung zwischen den beobachteten Iso-Pollen-<br />
Mustern und dem Landschaftstyp. Es sollte nun möglich<br />
se<strong>in</strong>, klarer zwischen klimatischen und abiotischen Faktoren<br />
zu unterscheiden, die die Vegetationsentwicklung<br />
steuern.<br />
Introdution<br />
<strong>The</strong> Weichselian <strong>Late</strong> <strong>Glacial</strong> marks the transition<br />
between the cold Weichselian <strong>Late</strong> Pleniglacial and<br />
the warmer Holocene. <strong>The</strong> climate change dur<strong>in</strong>g<br />
this transition caused the <strong>vegetation</strong> and the abiotic<br />
component <strong>of</strong> the landscape to change rapidly. A<br />
great number <strong>of</strong> palynological data consider<strong>in</strong>g the<br />
<strong>Late</strong> <strong>Glacial</strong> have been collected <strong>in</strong> NW-Europe and<br />
especially <strong>The</strong> <strong>Netherlands</strong> dur<strong>in</strong>g the last decades.<br />
<strong>The</strong>refore, the general <strong>vegetation</strong> development for<br />
this period is well known.<br />
At the end <strong>of</strong> the Weichselian <strong>Late</strong> Pleniglacial there<br />
was <strong>in</strong> <strong>The</strong> <strong>Netherlands</strong> a sparse <strong>vegetation</strong> cover<br />
compris<strong>in</strong>g Gram<strong>in</strong>eae, Cyperaceae and Betula<br />
nana, many places were altogether bare. From a-<br />
round 13,000 years BP herbaceous plant communities<br />
and dwarf bushes developed due to temperature<br />
rise. Dur<strong>in</strong>g the Alleri0d <strong>in</strong>terstadial rather open Betula<br />
and later on P<strong>in</strong>us woods occurred. <strong>The</strong> colder<br />
<strong>Late</strong> Dryas stadial <strong>in</strong>terrupted around 10,950 BP the<br />
development to a more dense <strong>vegetation</strong> cover. <strong>The</strong><br />
P<strong>in</strong>us and Betula woods dim<strong>in</strong>ished <strong>in</strong> size and herbaceous<br />
plant communities compris<strong>in</strong>g Empetrum<br />
nigrum, developed. At the start <strong>of</strong> the Holocene<br />
(10,150 years BP) Betula and later on P<strong>in</strong>us woods<br />
expanded aga<strong>in</strong> and became more dense as a result<br />
<strong>of</strong> temperature rise. <strong>The</strong>rmophilous trees as Corylus,<br />
Quercus, Tilia, Ulmus and Alnus appeared later <strong>in</strong><br />
the Holocene and are supposed to have been absent<br />
dur<strong>in</strong>g the <strong>Late</strong> <strong>Glacial</strong> <strong>in</strong> <strong>The</strong> <strong>Netherlands</strong>. This general<br />
<strong>vegetation</strong> development can be recognized <strong>in</strong><br />
most <strong>of</strong> the pollendiagrams from <strong>The</strong> <strong>Netherlands</strong>.
<strong>Patterns</strong> <strong>of</strong> <strong>Late</strong> <strong>Glacial</strong> <strong>vegetation</strong> <strong>in</strong> <strong>The</strong> <strong>Netherlands</strong> 79<br />
figure 1. I lie cont<strong>in</strong>ental position <strong>of</strong> <strong>The</strong> <strong>Netherlands</strong> dur<strong>in</strong>g die Weichselian <strong>Late</strong> <strong>Glacial</strong> (modified after JELGERSMA, 1979<br />
and LANG, 1994).<br />
Abb. 1: Die kont<strong>in</strong>entale Lage der Niederlande während des Weichsel Spätglazials (modifiziert nach JELGERSMA 1979 und LANG 1994)<br />
However, pollen diagrams from different areas <strong>in</strong><br />
<strong>The</strong><br />
<strong>Netherlands</strong> show clear variations <strong>in</strong> pollen<br />
composition dur<strong>in</strong>g the <strong>Late</strong> <strong>Glacial</strong>.<br />
Palaeogeographical approach<br />
For <strong>The</strong> <strong>Netherlands</strong> it is to be expected that there<br />
were only small spatial differences <strong>in</strong> climate dur<strong>in</strong>g<br />
the Weichselian <strong>Late</strong> <strong>Glacial</strong> due to the small area<br />
and relatively large distance to the former coastl<strong>in</strong>e.<br />
As sealevel was between 90 and 65 meters below the<br />
present date level (JELGERSMA, 1979), the coastl<strong>in</strong>e<br />
was more than 200 kilometers away and any climate<br />
gradient <strong>in</strong>duced by the sea can be neglected for <strong>The</strong><br />
<strong>Netherlands</strong> dur<strong>in</strong>g the time under <strong>in</strong>vestigation. Figure<br />
1 shows the relative cont<strong>in</strong>ental position <strong>of</strong> <strong>The</strong><br />
<strong>Netherlands</strong> dur<strong>in</strong>g the Weichselian <strong>Late</strong> <strong>Glacial</strong><br />
(modified after JELGERSMA, 1979 and LANG, 1994).<br />
In the classical approach, s<strong>in</strong>gle locations are the<br />
ma<strong>in</strong> basis for palaeoclimate reconstructions. It is<br />
obvious that climate parameters derived from s<strong>in</strong>gle<br />
pollen diagrams will represent certa<strong>in</strong> local <strong>in</strong>fluences.<br />
<strong>The</strong> ma<strong>in</strong> reason for this is the fact that not only<br />
the large scale changes <strong>in</strong> climate determ<strong>in</strong>ed the <strong>vegetation</strong><br />
development <strong>in</strong> for <strong>in</strong>stance the Weichselian<br />
<strong>Late</strong> <strong>Glacial</strong>. Also more local variations <strong>in</strong> lithology,<br />
geomorphology and geo-hydrological conditions<br />
have <strong>in</strong>fluenced the <strong>vegetation</strong> development<br />
and patterns. Palaeoclimate reconstructions based<br />
on s<strong>in</strong>gle pollen diagrams will therefore give a<br />
wrong picture <strong>of</strong> the regional climate.<br />
With a palaeogeographical approach the <strong>vegetation</strong><br />
patterns and changes <strong>in</strong> the patterns can be compared<br />
with geological/geomorphological maps. As<br />
soon as the relations between the palaeo<strong>vegetation</strong><br />
and the abiotic components <strong>of</strong> the landscape are<br />
known, the relations between <strong>vegetation</strong> and climate<br />
will be more clear. This approach requires a<br />
dense network <strong>of</strong> palynological sections <strong>in</strong> an area<br />
with a well known geology and geomorphology.<br />
<strong>The</strong><br />
<strong>Late</strong> <strong>Glacial</strong> abiotic landscape <strong>of</strong><br />
<strong>The</strong><br />
<strong>Netherlands</strong><br />
<strong>The</strong> <strong>Late</strong> <strong>Glacial</strong> landscape is a landscape with chang<strong>in</strong>g<br />
geomorphology and <strong>vegetation</strong>. Dur<strong>in</strong>g the<br />
Weichselian <strong>Late</strong> <strong>Glacial</strong> geomorphological processes<br />
were active, but the abiotic changes where not as<br />
large as dur<strong>in</strong>g the preced<strong>in</strong>g Pleniglacial. Morphological<br />
features related to permafrost that had existed<br />
at the end <strong>of</strong> the Pleniglacial disappeared due to the<br />
changes <strong>in</strong> climate towards the Holocene. Permafrost<br />
disappeared, although deep seasonal frost<br />
may have occurred dur<strong>in</strong>g the <strong>Late</strong> <strong>Glacial</strong> (VANDEN-<br />
BERGHE, 1992). <strong>The</strong> <strong>vegetation</strong> development <strong>in</strong>itiated<br />
soil formation and stabilized the substratum. <strong>The</strong>
80 WIM Z. HOEK<br />
Figure 2. Reconstruction <strong>of</strong> the landscape types <strong>in</strong> <strong>The</strong> <strong>Netherlands</strong> dur<strong>in</strong>g the Weichselian <strong>Late</strong> <strong>Glacial</strong> (modified after<br />
Zagwijn, 1986).<br />
Abb. 2: Rekonstruktion der Landschaftstypen <strong>in</strong> den Niederlanden während des Weichsel Spätglazials (modifiziert nach ZAGWIJN 1986)<br />
ma<strong>in</strong> landscape types that existed dur<strong>in</strong>g the <strong>Late</strong><br />
<strong>Glacial</strong> <strong>in</strong> <strong>The</strong> <strong>Netherlands</strong> are formed by glacial, fluvial<br />
and aeolian processes. For <strong>The</strong> <strong>Netherlands</strong> <strong>in</strong><br />
general five larger landscape regions existed dur<strong>in</strong>g<br />
the <strong>Late</strong> <strong>Glacial</strong>.<br />
1 <strong>The</strong> till region <strong>in</strong> the northern <strong>Netherlands</strong> was formed<br />
as a result <strong>of</strong> the Saalian glaciation. <strong>Glacial</strong> tills<br />
form the substratum <strong>in</strong> a gently undulat<strong>in</strong>g landscape.<br />
In this region hundreds <strong>of</strong> Pleniglacial p<strong>in</strong>go<br />
remnants occur (DE GANS, 1981). From these p<strong>in</strong>go<br />
remnants, formed after melt<strong>in</strong>g <strong>of</strong> the p<strong>in</strong>gos at the<br />
end <strong>of</strong> the Pleniglacial, many pollendiagrams have<br />
been obta<strong>in</strong>ed.<br />
2 <strong>The</strong> ice-pushed region <strong>in</strong> the central <strong>Netherlands</strong>
<strong>Patterns</strong> <strong>of</strong> <strong>Late</strong> <strong>Glacial</strong> <strong>vegetation</strong> <strong>in</strong> <strong>The</strong> <strong>Netherlands</strong><br />
HI<br />
<strong>in</strong>cludes the end mora<strong>in</strong>es <strong>of</strong> the Saalian ice-sheets. older river deposits. Between the ice-pushed ridges<br />
<strong>The</strong> hills rise up to a hundred meters above deposition <strong>of</strong> coversands took place dur<strong>in</strong>g the<br />
the surround<strong>in</strong>g river deposits and are built <strong>of</strong> Weichselian Pleniglacial and <strong>Late</strong> <strong>Glacial</strong> (MAARLE-
82 WIM Z. HOEK<br />
Dur<strong>in</strong>g the <strong>Late</strong> Dryas stadial a layer <strong>of</strong> coversand<br />
was deposited over soils and peats, <strong>in</strong>dicat<strong>in</strong>g the<br />
landscape was more open than <strong>in</strong> the preced<strong>in</strong>g<br />
Aller0d <strong>in</strong>terstadial. <strong>The</strong> organic deposits <strong>in</strong> this area<br />
consist <strong>of</strong> peats and shallow lacustr<strong>in</strong>e deposits formed<br />
<strong>in</strong> the depressions between coversand ridges.<br />
5 'Ehe coversand region <strong>in</strong> the southern <strong>Netherlands</strong><br />
is characterized by a gently undulat<strong>in</strong>g topography.<br />
<strong>The</strong> coversands are ma<strong>in</strong>ly deposited dur<strong>in</strong>g the<br />
Weichselian Pleniglacial (SCHWAN, 1988). In the western<br />
part, Early Pleistocene clayey deposits occur at<br />
shallow depth. Like <strong>in</strong> the eastern coversand region,<br />
organic deposits <strong>in</strong> this area consist <strong>of</strong> peats and<br />
shallow lacustr<strong>in</strong>e deposits formed <strong>in</strong> the depressions<br />
between coversand ridges. Some smaller p<strong>in</strong>go<br />
remnants occur (KASSE & BOHNCKE, 1992).<br />
In figure 2a reconstruction <strong>of</strong> the landscape <strong>in</strong> <strong>The</strong><br />
<strong>Netherlands</strong> dur<strong>in</strong>g the Weichselian <strong>Late</strong> <strong>Glacial</strong> is<br />
given (modified after ZAGWIJN, 1986).<br />
Available palynological data<br />
Figure 4: Regional <strong>Late</strong> <strong>Glacial</strong> pollen diagram <strong>of</strong> the ma<strong>in</strong><br />
taxa for <strong>The</strong> <strong>Netherlands</strong>.<br />
Abb. 4: Regionale spätglaziale Pollendiagramme der wichtigsten<br />
Taxa für die Niederlande.<br />
VHi.D & VAN DER SCHANS,<br />
1961). As the ice-pushed<br />
ridges consist ma<strong>in</strong>ly <strong>of</strong> well-dra<strong>in</strong>ed gravels and<br />
sands, only a few wet bas<strong>in</strong>s occur where organic<br />
deposits could be preserved.<br />
3 <strong>The</strong> river region <strong>in</strong> the central <strong>Netherlands</strong> is ma<strong>in</strong>ly<br />
formed by the rivers Rh<strong>in</strong>e and Meuse. As the rivers<br />
changed their patterns and morphology between<br />
braid<strong>in</strong>g and meander<strong>in</strong>g due to climate<br />
change, the abandoned river channels form the<br />
bas<strong>in</strong>s where organic deposits could be preserved.<br />
Under dry conditions dur<strong>in</strong>g the second phase <strong>of</strong> the<br />
<strong>Late</strong> Dryas stadial, sand was blown out <strong>of</strong> the braided<br />
river beds, form<strong>in</strong>g riverdunes <strong>in</strong> the surround<strong>in</strong>g<br />
<strong>vegetation</strong> cover (BOHNCKE et al. 1993). <strong>The</strong> river<br />
landscape dur<strong>in</strong>g the <strong>Late</strong> <strong>Glacial</strong> has been described<br />
by KASSE et al. (1995) and<br />
(1995).<br />
BERENDSEN et al.<br />
4 <strong>The</strong> coversand region <strong>in</strong> the eastern <strong>Netherlands</strong> is<br />
characterized by thick layers <strong>of</strong> coversand formed<br />
dur<strong>in</strong>g the Weichselian Pleniglacial (SCHWAN, 1988).<br />
In this region Saalian ice-pushed ridges occur also.<br />
In <strong>The</strong> <strong>Netherlands</strong> over 400 palynological sections<br />
have been <strong>in</strong>vestigated by several <strong>in</strong>stitutes dur<strong>in</strong>g<br />
the last decades, cover<strong>in</strong>g part or whole <strong>of</strong> the<br />
Weichselian <strong>Late</strong> <strong>Glacial</strong>. Most <strong>of</strong> the <strong>in</strong>vestigated<br />
sections are unpublished and the orig<strong>in</strong>al data are<br />
stored as count<strong>in</strong>g sheets <strong>in</strong> archives <strong>of</strong> the Geological<br />
Survey, Soil Survey and different universities. As<br />
a first step <strong>in</strong> this study, the pollen count<strong>in</strong>gs were<br />
gathered and <strong>in</strong>serted <strong>in</strong>to a computer. By now 250<br />
<strong>of</strong> these sections are available <strong>in</strong> digital format. <strong>The</strong><br />
data are stored <strong>in</strong> a relational database, us<strong>in</strong>g the European<br />
Pollen Database structure. <strong>The</strong> spatial density<br />
<strong>of</strong> available pollen data decreases <strong>in</strong> westery direction,<br />
directly related to the depth <strong>of</strong> the <strong>Late</strong> <strong>Glacial</strong><br />
deposits below the present day surface. In the<br />
most western part <strong>of</strong> <strong>The</strong> <strong>Netherlands</strong> the <strong>Late</strong> <strong>Glacial</strong><br />
deposits are covered with up to 15 meters <strong>of</strong><br />
Holocene fluvial sediments, mar<strong>in</strong>e sediments and<br />
peat. <strong>The</strong>refore, <strong>Late</strong> <strong>Glacial</strong> deposits are difficult to<br />
collect. Nevertheless, the spatial resolution is high,<br />
as can be seen <strong>in</strong> figure 3. <strong>The</strong> locations <strong>of</strong> the pollen<br />
diagrams which are stored <strong>in</strong> the database are<br />
presented as black dots, while the other locations<br />
are presented as open circles. With this dense pattern<br />
<strong>of</strong> palynological <strong>in</strong>vestigated locations a reconstruction<br />
<strong>of</strong> the <strong>vegetation</strong> patterns <strong>in</strong> different time<br />
w<strong>in</strong>dows dur<strong>in</strong>g the Weichselian <strong>Late</strong> <strong>Glacial</strong> can be<br />
made.<br />
Preparation <strong>of</strong> the palynological data<br />
For the construction <strong>of</strong> the pollen diagrams from the<br />
pollen count<strong>in</strong>gs a uniformous pollen sum was used<br />
to calculate percentages, so the diagrams can be<br />
compared. In the pollen sum only non-thermo-
<strong>Patterns</strong> <strong>of</strong> <strong>Late</strong> <strong>Glacial</strong> <strong>vegetation</strong> <strong>in</strong> <strong>The</strong> <strong>Netherlands</strong> 83<br />
A) Mekelermeer E Uddelermeer C) Daarle D) Middelbeers<br />
2b<br />
1c<br />
lb<br />
20 40 60 80 100 20 40 60 80 100 20 40 60 80 100 20 40 60 80 100<br />
Figure 5: Pollen diagrams with selected taxa from 4 small bas<strong>in</strong>s <strong>in</strong> different regions.<br />
a Mekelermeer (BOHNCKE et al., 1988); b Uddelenneer (BOHNCKE et al., 1988); c Daarle (BIJLSMA & DE LANGE, 1983);<br />
d Middelbeers (KOELBLOED, 1969).<br />
Abb. 5: Pollendiagramme ausgewählter Taxa aus vier kle<strong>in</strong>en Becken <strong>in</strong> verschiedenen Regionen.<br />
a Mekelermeer (BOHNCKE et al., 1988); b Uddelermeer (BOHNCKF et al, 1988); c Daarle (BIILSMA & DE LANGE, 1983);<br />
d Middelbeers (KOELBLOEO. 1969).<br />
philous trees, shaibs and dry herbs are <strong>in</strong>cluded, regional<br />
taxa sensus JANSSEN (1973). <strong>The</strong> local pollen<br />
taxa, aquatics and riparian herbs <strong>in</strong>clud<strong>in</strong>g Cyperaceae,<br />
as well as thermophilous tree pollen and<br />
spores were excluded from the pollen sum. <strong>The</strong> major<br />
shifts <strong>in</strong> the ma<strong>in</strong> pollen taxa, radiocarbon dated<br />
<strong>in</strong> several pollen diagrams distributed over <strong>The</strong><br />
<strong>Netherlands</strong>, are used to construct a regional zonation<br />
(HOEK, <strong>in</strong> prep.). In figure 4 the zonation is present-ed<br />
as a generalized <strong>Late</strong> <strong>Glacial</strong> pollen diagram<br />
for <strong>The</strong> <strong>Netherlands</strong> on an uncalibrated radiocarbon<br />
timescale. Based on the zonation, a zone code has<br />
been assigned to the analyzed levels from the pollen<br />
diagrams <strong>in</strong> the database. If any uncerta<strong>in</strong>ties appeared,<br />
for <strong>in</strong>stance <strong>in</strong> the case <strong>of</strong> a pollen sum less<br />
than 100, <strong>in</strong>dications for rework<strong>in</strong>g or contam<strong>in</strong>ation,<br />
no zone code was assigned to that level. In figure<br />
5a-d four pollendiagrams with selected taxa are<br />
presented. <strong>The</strong> pollendiagrams are derived from<br />
small (former) lakes, p<strong>in</strong>go remnants from the northern<br />
<strong>Netherlands</strong> till region (a), the central <strong>Netherlands</strong><br />
ice - pushed region (b) and the eastern (c) and<br />
southern (d) coversand region. In these diagrams<br />
the differences between the percentages <strong>of</strong> Juniperus,<br />
P<strong>in</strong>us and Ericales can be seen. <strong>The</strong> higher percentages<br />
<strong>of</strong> P<strong>in</strong>us and Ericales at the, m<strong>in</strong>erogenic,<br />
lower part <strong>of</strong> some <strong>of</strong> the diagrams are caused by<br />
rework<strong>in</strong>g from older deposits.<br />
Juniperus <strong>in</strong> zone Ic reaches the highest values up to<br />
30% <strong>in</strong> the diagram from the eastern coversand region<br />
(c) and 15% <strong>in</strong> that from the central <strong>Netherlands</strong> (b).<br />
Dur<strong>in</strong>g the follow<strong>in</strong>g zone 2a, the highest values for<br />
Juniperus, up to 30% are recorded <strong>in</strong> the diagrams<br />
from the central <strong>Netherlands</strong> and 10% <strong>in</strong> the southern<br />
coversand region (d).<br />
Dur<strong>in</strong>g zone 2b P<strong>in</strong>us has the highest value round<br />
50% <strong>in</strong> the diagrams from the till region, the central<br />
<strong>Netherlands</strong> and the eastern coversand region. <strong>The</strong><br />
values for P<strong>in</strong>us <strong>in</strong> the diagram from the southern<br />
coversand region rema<strong>in</strong> below 20%.<br />
<strong>The</strong> percentages <strong>of</strong> Ericales, <strong>in</strong>clud<strong>in</strong>g Empetrum nigrum,<br />
dur<strong>in</strong>g zone 3 are the highest <strong>in</strong> the diagram<br />
from the northern <strong>Netherlands</strong> till region with values<br />
up to 25%. <strong>The</strong> diagrams from the central <strong>Netherlands</strong><br />
and the eastern coversand region show values<br />
up to 10% and 7% respectively. For each pollen diagram<br />
<strong>in</strong> the database the mean and maximum values<br />
<strong>of</strong> the ma<strong>in</strong> taxa have been computed for the dist<strong>in</strong>guished<br />
zones.<br />
Construction <strong>of</strong> the iso-pollen maps<br />
For three zones with<strong>in</strong> the <strong>Late</strong> <strong>Glacial</strong> iso-pollen<br />
maps were constructed show<strong>in</strong>g the highest percentages<br />
<strong>of</strong> the dist<strong>in</strong>ctive taxa <strong>in</strong> that zone. Zone Ic and<br />
the base <strong>of</strong> zone 2a are characterized by high values<br />
<strong>of</strong> Juniperus communis (Juniper), a species spread
84 WIM Z. HOEK<br />
50 100 150 200 250 km<br />
_| __] ! I<br />
Figure 6: Iso-pollen map for the maximum values <strong>of</strong> Juniperus between 12,100-11,500 BP (zone Ic/2al).<br />
Abb. 6: Iso-Pollen-Kaite für Maximalwerte von Juniperus zwischen 12.100 und 11.500 BP (Zone Ic/2al).<br />
by birds and favoured by the presence <strong>of</strong> a bare<br />
ed around 11,250 BP from the south-east, presumsandy<br />
substratum. Zone 2b is characterized by high ably distributed along the river Rh<strong>in</strong>e course. Zone 3<br />
values <strong>of</strong> P<strong>in</strong>us sylvestris (Scots p<strong>in</strong>e) which migrat- is characterized by high values <strong>of</strong> Ericales, especial-
Pattems <strong>of</strong> <strong>Late</strong> <strong>Glacial</strong> <strong>vegetation</strong> <strong>in</strong> <strong>The</strong> <strong>Netherlands</strong> 85<br />
50 100 150 200 250 km<br />
: ! i I I<br />
Figure 7: Iso-pollen map for the maximum values <strong>of</strong> P<strong>in</strong>us between 11,250-10.950 BP (zone 2b).<br />
Abb. 7: Iso-Pollen-Karte für Maximalwerte von P<strong>in</strong>us zwischen 11.250 und 10.950 BP (zone 2b).<br />
ly <strong>in</strong> the second part <strong>of</strong> this zone. Empetrum nigrum onstrated that the percentages <strong>of</strong> the characteristic<br />
(Crowberrry), the ma<strong>in</strong> constituent <strong>of</strong> the Ericales pollen taxa <strong>of</strong> each zone vary with the landscape type,<br />
dur<strong>in</strong>g this zone is spread by birds. It can be dem- HUNTLEY & BIRKS (1983) presented iso-pollen maps
86 WIM Z. HOEK<br />
ESS O-<br />
50 100 150 200 250 km<br />
_j i i i i<br />
Figure 8: Iso-pollen map for the maximum values <strong>of</strong> Ericales between 10,950-10,150 BP (zone 3).<br />
Abb. 8: Iso-Pollen-Karte für Maximalwerte von Ericales zwischen 10.950 und 10.150 BP (zone 3).<br />
which show large scale patterns <strong>in</strong> pollen these maps can not be used for regional analyses,<br />
percentage over Europe. <strong>The</strong> spatial resolution<br />
<strong>of</strong> these maps <strong>of</strong> Europe is unavoidably low and<br />
For the construction <strong>of</strong> the iso-pollen maps <strong>in</strong> this<br />
study, the locations with their maximum value for
<strong>Patterns</strong> <strong>of</strong> <strong>Late</strong> <strong>Glacial</strong> <strong>vegetation</strong> <strong>in</strong> <strong>The</strong> <strong>Netherlands</strong> 8-<br />
the specific taxa with<strong>in</strong> their dist<strong>in</strong>ct zone were retrieved<br />
from the database. Iso-pollen maps were<br />
constructed us<strong>in</strong>g a squared <strong>in</strong>verse distance <strong>in</strong>terpolation<br />
with a search radius <strong>of</strong> 20 kilometers. <strong>The</strong><br />
search radius is <strong>in</strong> accordance with the possible<br />
source area <strong>of</strong> the regional pollen record. In areas<br />
where no data were available with<strong>in</strong> the search radius<br />
the outcome has automatically been blanked.<br />
Thus no extrapolations towards areas without data<br />
have been made. <strong>The</strong> data po<strong>in</strong>ts used <strong>in</strong> the <strong>in</strong>terpolation<br />
are displayed as black dots.<br />
For zone Ic and the base <strong>of</strong> zone 2a, the time-w<strong>in</strong>dow<br />
from 12,100 - 11,500 BP, the highest percentages<br />
<strong>of</strong> Juniperus are plotted <strong>in</strong> figure 6. <strong>The</strong><br />
presence <strong>of</strong> Juniperus pollen dur<strong>in</strong>g these zones<br />
is recorded <strong>in</strong> 82 pollen diagrams <strong>in</strong> the database.<br />
For zone 2b, the time-w<strong>in</strong>dow from 11,250 - 10,950 BP,<br />
the ltighest percentages <strong>of</strong> P<strong>in</strong>us are plotted <strong>in</strong> figure 7.<br />
<strong>The</strong> presence <strong>of</strong> P<strong>in</strong>us pollen dur<strong>in</strong>g pollen zone 2b is<br />
recorded <strong>in</strong> 113 pollen diagrams <strong>in</strong> the database.<br />
For zone 3, the time-w<strong>in</strong>dow from 10,950 - 10,150<br />
BP, the highest percentages <strong>of</strong> Ericaes (ma<strong>in</strong>ly Empet<br />
rum nigrum) are plotted <strong>in</strong> figure 8. <strong>The</strong> presence<br />
<strong>of</strong> Ericales pollen dur<strong>in</strong>g pollen zone 3 is<br />
recorded <strong>in</strong> 114 pollen diagrams <strong>in</strong> the database.<br />
Relationship between the iso-pollen patterns<br />
and the abiotic landscape<br />
<strong>The</strong> highest percentages Juniperus dur<strong>in</strong>g zone Ic<br />
and 2a with values up to 30 percent are related to the<br />
ice-pushed ridges <strong>in</strong> the central and eastern <strong>Netherlands</strong><br />
and the southern <strong>Netherlands</strong> coversand region.<br />
<strong>The</strong>se areas consist <strong>of</strong> the more sandy welldra<strong>in</strong>ed<br />
sediments. <strong>The</strong> growth oi Juniperus communis<br />
is favoured by a bare sandy substratum and is<br />
therefore likely to have been grow<strong>in</strong>g <strong>in</strong> the coversand<br />
areas. Lower percentages are recorded <strong>in</strong> the river valleys<br />
and the northern Nedterlands till region, areas with<br />
higher groundwater levels and a less sandy substratum.<br />
<strong>The</strong> highest values <strong>of</strong> P<strong>in</strong>us dur<strong>in</strong>g zone 2b are recorded<br />
<strong>in</strong> the central <strong>Netherlands</strong> river region. <strong>The</strong><br />
lowest values are recorded <strong>in</strong> the eastern part <strong>of</strong> the<br />
southern <strong>Netherlands</strong> coversand region. <strong>The</strong>re<br />
seems to be no south-north gradient <strong>in</strong> the percentage<br />
<strong>of</strong> P<strong>in</strong>us as suggested by several authors. As P<strong>in</strong>us<br />
sylvestris is at present grow<strong>in</strong>g on drier locations,<br />
it is supposed that P<strong>in</strong>us was not <strong>in</strong>habit<strong>in</strong>g<br />
the river valleys but grew on the higher parts <strong>of</strong> the<br />
terraces along the river valleys. <strong>The</strong> high percentages<br />
<strong>of</strong> P<strong>in</strong>us<strong>in</strong> the central <strong>Netherlands</strong> river region<br />
may also be a result <strong>of</strong> a more open herbaceous<br />
<strong>vegetation</strong> type, suggest<strong>in</strong>g P<strong>in</strong>us is overrepresented<br />
clue to k<strong>in</strong>g distance transport.<br />
<strong>The</strong> iso-pollen map for the maximum values <strong>of</strong> Ericales<br />
dur<strong>in</strong>g zone 3 (figure 8), shows the high values,<br />
over 20%, l<strong>in</strong>ked to the poorly dra<strong>in</strong>age and<br />
leached soils <strong>in</strong> tills situated <strong>in</strong> the northern <strong>Netherlands</strong>.<br />
In the ice-pushed region <strong>of</strong> the central <strong>Netherlands</strong><br />
and western part <strong>of</strong> the southern <strong>Netherlands</strong><br />
coversand area percentages above 10% occur, presumably<br />
related to the occurrence <strong>of</strong> a clayey substratum<br />
at shallow depth. Pollen diagrams from the<br />
coversand area and the nutrient rich river area show<br />
values below 5% for Empetrum dur<strong>in</strong>g zone 3. <strong>The</strong><br />
high occurrence <strong>of</strong> Empetrum nigrum is <strong>of</strong>ten used<br />
as an <strong>in</strong>dicator for oceanity, based on higher precipitation<br />
rates. At present, a higher occurrence <strong>of</strong> Empetrum<br />
<strong>in</strong>dicates a low nutrient availability or acid<br />
soils, a situation occurr<strong>in</strong>g already <strong>in</strong> the till region<br />
dur<strong>in</strong>g the time under <strong>in</strong>vestigation. Empetrum is<br />
able to grow <strong>in</strong> areas with an active aeolian sedimentation,<br />
a situation that occurred dur<strong>in</strong>g the second<br />
phase <strong>of</strong> the Younger Dryas (BOHNCKE et al., 1993).<br />
Conclusions<br />
Not only climatic changes (temperature and precipitation)<br />
<strong>in</strong>fluenced the <strong>vegetation</strong> development. Also<br />
more local variations <strong>in</strong> lithology, geomorphology<br />
and geo-hydrological conditions <strong>in</strong>fluenced the <strong>vegetation</strong><br />
and especially the <strong>vegetation</strong> patterns. As<br />
the <strong>vegetation</strong> <strong>in</strong> <strong>The</strong> <strong>Netherlands</strong>, and other areas,<br />
will not have been uniformous dur<strong>in</strong>g the <strong>Late</strong> <strong>Glacial</strong><br />
one has to be careful with deriv<strong>in</strong>g the climate<br />
signal from s<strong>in</strong>gle pollen diagrams.<br />
As <strong>The</strong> <strong>Netherlands</strong> occupied a relative cont<strong>in</strong>ental<br />
position dur<strong>in</strong>g the Weichselian <strong>Late</strong> <strong>Glacial</strong>, it is not<br />
feasible that differences <strong>in</strong> the pattern <strong>of</strong> Ericales dur<strong>in</strong>g<br />
the <strong>Late</strong> Dryas stadial are caused by a climatic<br />
gradient over <strong>The</strong> <strong>Netherlands</strong>. <strong>The</strong>re will, however<br />
have occurred a climatic event caus<strong>in</strong>g the great expansion<br />
<strong>of</strong> Empetrum nigrum <strong>in</strong> the areas favourable<br />
for this species.<br />
Acknowledgements<br />
This study forms part <strong>of</strong> the project: Palaeogeography<br />
<strong>of</strong> <strong>Late</strong> <strong>Glacial</strong> <strong>vegetation</strong>s: analysis <strong>in</strong> time and<br />
space.<br />
Aim <strong>of</strong> this project is to reconstruct the <strong>Late</strong> <strong>Glacial</strong><br />
<strong>vegetation</strong> <strong>in</strong> the northwest-european lowland <strong>in</strong> relation<br />
to climate and the abiotic components <strong>of</strong> the<br />
landscape.<br />
<strong>The</strong> project is sponsored by <strong>The</strong> <strong>Netherlands</strong> Organization<br />
for Scientific Research (N.W.O.- G.O.A.)<br />
and is <strong>in</strong>corporated <strong>in</strong> the research program <strong>of</strong> <strong>The</strong><br />
<strong>Netherlands</strong> Centre for Geo-ecological Research<br />
(ICG). Supervisor <strong>of</strong> the project is Pr<strong>of</strong>. Dr. W. H.<br />
Zagwijn, who is acknowledged for his valuable<br />
comments on the text.<br />
<strong>The</strong> palynological data used <strong>in</strong> this study were k<strong>in</strong>dly<br />
provided by the follow<strong>in</strong>g <strong>in</strong>stitutes; <strong>The</strong> <strong>Netherlands</strong><br />
Geological Survey (RGD), DLO Star<strong>in</strong>g Centre,<br />
Wagen<strong>in</strong>gen, Laboratory for Palaeo-ecology and<br />
Landscape-evolution (University <strong>of</strong> Gent, Belgium),
88 WIM Z. HOEK<br />
Hugo de Vries Laboratory (University <strong>of</strong> Amsterdam),<br />
Laboratory for Palynology and Paleobotany<br />
(University <strong>of</strong> Utrecht), Institute for Prehistory (University<br />
<strong>of</strong> Leiden) and the Faculty <strong>of</strong> Earth Science<br />
(Vrije Universiteit Amsterdam).<br />
References<br />
BERENDSEN H.J.A., HOEK, WZ. & SCHORN, E.A. (1995): <strong>Late</strong> Weichselian<br />
and Holocene river channel changes <strong>of</strong> the rivers Rh<strong>in</strong>e<br />
and Meuse <strong>in</strong> the <strong>Netherlands</strong> (Land van Maas en Waal). Paliäoklimaforschung<br />
Palaeoclimate Research, 14, 151-171.<br />
BIJLSMA, S. & DE LANGE, G.W. (1983). Geology, palynology and age<br />
<strong>of</strong> a p<strong>in</strong>go remnant near Daarle, prov<strong>in</strong>ce <strong>of</strong> Overijssel, <strong>The</strong><br />
<strong>Netherlands</strong>. Geologie en Mijnbouw, 62, 563-568.<br />
BOHNCKE, S.J.P., WLJMSTRA, L., VAN DER WOUDE, J. & SOHL, H. (1988).<br />
<strong>The</strong> <strong>Late</strong>-<strong>Glacial</strong> <strong>in</strong>fill <strong>of</strong> three lake successions <strong>in</strong> <strong>The</strong> <strong>Netherlands</strong>:<br />
Regional <strong>vegetation</strong>al history <strong>in</strong> relation to NW European<br />
<strong>vegetation</strong>al developments. Boreas, 17, 385-402.<br />
BOHNCKE, S.J.P., VANDENBERGHE, J.F. & HUIJZER, A.S. (1993): Periglacial<br />
Paleoenvironments dur<strong>in</strong>g the <strong>Late</strong> <strong>Glacial</strong> <strong>in</strong> the Maas<br />
Valley, <strong>The</strong> <strong>Netherlands</strong>. Geologie en Mijnbouw, 72, 193-210.<br />
DE GANS, W. (1991): Location, age and orig<strong>in</strong> <strong>of</strong> p<strong>in</strong>go remnants <strong>in</strong><br />
the Drentsche Aa valley area (<strong>The</strong> <strong>Netherlands</strong>). Geologie en<br />
Mijnbouw, 61, 147-158.<br />
HUNTLEY, B. & BIRKS, H.J.B. (1983): An atlas <strong>of</strong> past and present pollen<br />
maps for Europe: 0-13,000 years ago. Cambridge University<br />
Press, 667 pp.<br />
JANSSEN, CR. (1973): Local and regional pollen deposition. In: Birks,<br />
H.J.B, and West, R.G. (eds), Quaternary Plant Ecology, pp. 31-<br />
42, Blackwell Scientific Publications, Oxford.<br />
JELGERSMA, S. (1979): Sea-level changes <strong>in</strong> the North Sea bas<strong>in</strong>. In:<br />
Oele, E., Schüttenhelm, R.T.E. and Wiggers, A.J. (eds), <strong>The</strong><br />
Quaternary History <strong>of</strong> the North Sea, pp. 233-248, Acta Universitas<br />
Uppsala, 2, Uppsala. 249-<br />
KASSE, C & BOHNCKE, S.J.P. (1992): Weichselian Upper Pleniglacial<br />
Aeolian and Ice-cored Morphology <strong>in</strong> the Southern <strong>Netherlands</strong><br />
(Noord-Brabant, Grootc Peel). Permafrost and Periglacial<br />
Processes, 3, 327-342<br />
KASSE C, VANDENBERGHE, J.F. & BOHNCKE, S.J.P. (1995): Climate change<br />
and fluvial dynamics <strong>of</strong> the Maas dur<strong>in</strong>g the late Weichselian<br />
and early Holocene. Palaoklimaforschung Palaeoclimate<br />
Research, 14, 123-150.<br />
KOELBLOED, K.K. (19Ö9): Pollen diagram Middelbeers meerven. Intern<br />
rapport van de Sticht<strong>in</strong>g voor Bodemkarter<strong>in</strong>g, afdel<strong>in</strong>g<br />
palaeobotanie, 2 pp.<br />
LANG, G.H. (1994): Quartäre Vegetationsgeschichte Europas. Gustav<br />
Fischer Verlag, Jena. 462 pp.<br />
MAARLEVELD, G.C. & VAN DER SCHANS, R.P.H.P. (1961): De dekzandmorfologie<br />
van de Gelderse Vallei. Tijdschrift van het Kon<strong>in</strong>klijk<br />
Nederlands Aardrijkskundig Genootschap, 78, 22-34.<br />
SCHWAN, J. (1988). <strong>The</strong> structure and genesis <strong>of</strong> Weichselian to Early<br />
Holocene aeolian sand sheets <strong>in</strong> Western Europe. Sedimentary<br />
Geology, 55, 197-232.<br />
VANDENBERGHE, J.F. (1992): Periglacial Phenomena and Pleistocene<br />
Environmental Conditions <strong>in</strong> the <strong>Netherlands</strong> - An Overview.<br />
Permafrost and Periglacial Processes, 3, 363-374.<br />
ZAGWIJN, W.H. (1986): Nederland <strong>in</strong> het Holoceen. Rijks Geologische<br />
Dienst, Haarlem, <strong>The</strong> <strong>Netherlands</strong>, 46 pp.<br />
Manuskript e<strong>in</strong>gegangen am 17. 05. 1996