Development of Subsea Altimeter Sensor System (SASS) Using ...
Development of Subsea Altimeter Sensor System (SASS) Using ...
Development of Subsea Altimeter Sensor System (SASS) Using ...

You also want an ePaper? Increase the reach of your titles
YUMPU automatically turns print PDFs into web optimized ePapers that Google loves.
Full Paper<br />
Int. J. on Recent Trends in Engineering and Technology, Vol. 8, No. 2, Jan 2013<br />
<strong>Development</strong> <strong>of</strong> <strong>Subsea</strong> <strong>Altimeter</strong> <strong>Sensor</strong> <strong>System</strong><br />
(<strong>SASS</strong>) <strong>Using</strong> Portable Sonar <strong>Sensor</strong> Fish Finder<br />
Alarm for Unmanned Underwater Vehicles<br />
M.S.M.Aras 1 * , A.S.Mohd Nor 1 , S.S.Abdullah 2 , Rashid, M.Z.A 1 , A. Jamali 3<br />
1<br />
Faculty <strong>of</strong> Electrical Engineering, Universiti Teknikal Malaysia Melaka, Hang Tuah Jaya, 76100 Durian Tunggal, Melaka<br />
Malaysia.<br />
Email: shahrieel@utem.edu.my, arfahsyahida@utem.edu.my, zamzuri@utem.edu.my<br />
2<br />
Department <strong>of</strong> Electric and Electronics, Malaysia-Japan International Institute <strong>of</strong> Technology, Universiti Teknologi<br />
Malaysia, International Campus Jalan Semarak, 54100 Kuala Lumpur, Malaysia.<br />
Email: shahrum@fke.utm.my<br />
3<br />
Department <strong>of</strong> Mechanical And Manufacturing Engineering, Faculty <strong>of</strong> Engineering, University Malaysia Sarawak, Jalan<br />
Dato’ Muhammad Musa, 94300 Kota Samarahan, Sarawak.<br />
Email: annisa@feng.unimas.my<br />
Abstract—This paper describes the development <strong>of</strong> <strong>Subsea</strong> <strong>Altimeter</strong><br />
<strong>Sensor</strong> <strong>System</strong> (<strong>SASS</strong>) for Unmanned Underwater Vehicles (UUV)<br />
Application using portable sonar sensor fish finder alarm system.<br />
<strong>Altimeter</strong> <strong>Sensor</strong> system is used to measure the depth <strong>of</strong> water.<br />
This altimeter sensor design valid for shallow water depth ranges<br />
maximum 100 m. This <strong>SASS</strong> will be applied to Underwater<br />
Remotely Operated Vehicles (ROV) design to verify the <strong>SASS</strong><br />
performances. Experiments conducted to measure a depth <strong>of</strong> lab<br />
test, swimming pool test and Ayer Keroh Lake test. The experiments<br />
conducted in lab pool and swimming pool to measure and estimate<br />
the error and accuracy <strong>of</strong> <strong>SASS</strong> performances because <strong>of</strong> known<br />
the depth <strong>of</strong> water. The error <strong>of</strong> <strong>Altimeter</strong> <strong>Sensor</strong> <strong>System</strong> is 10% or<br />
± 5 cm depth and accuracy <strong>of</strong> <strong>SASS</strong> very high about 90% for the<br />
both experiments. The results on Lake <strong>of</strong> Ayer Keroh at certain<br />
point can be acceptable. The 3D design <strong>of</strong> seabed mapping is plotted<br />
using MATLAB and Excel.<br />
marine environment.<br />
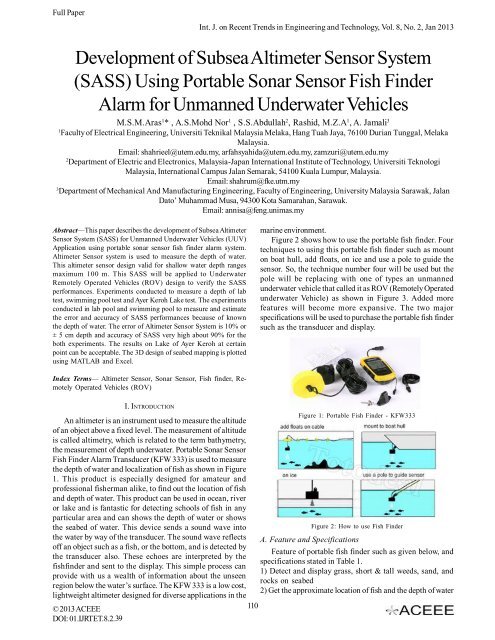
Figure 2 shows how to use the portable fish finder. Four<br />
techniques to using this portable fish finder such as mount<br />
on boat hull, add floats, on ice and use a pole to guide the<br />
sensor. So, the technique number four will be used but the<br />
pole will be replacing with one <strong>of</strong> types an unmanned<br />
underwater vehicle that called it as ROV (Remotely Operated<br />
underwater Vehicle) as shown in Figure 3. Added more<br />
features will become more expansive. The two major<br />
specifications will be used to purchase the portable fish finder<br />
such as the transducer and display.<br />
Index Terms— <strong>Altimeter</strong> <strong>Sensor</strong>, Sonar <strong>Sensor</strong>, Fish finder, Remotely<br />
Operated Vehicles (ROV)<br />
I. INTRODUCTION<br />
Figure 1: Portable Fish Finder - KFW333<br />
An altimeter is an instrument used to measure the altitude<br />
<strong>of</strong> an object above a fixed level. The measurement <strong>of</strong> altitude<br />
is called altimetry, which is related to the term bathymetry,<br />
the measurement <strong>of</strong> depth underwater. Portable Sonar <strong>Sensor</strong><br />
Fish Finder Alarm Transducer (KFW 333) is used to measure<br />
the depth <strong>of</strong> water and localization <strong>of</strong> fish as shown in Figure<br />
1. This product is especially designed for amateur and<br />
pr<strong>of</strong>essional fisherman alike, to find out the location <strong>of</strong> fish<br />
and depth <strong>of</strong> water. This product can be used in ocean, river<br />
or lake and is fantastic for detecting schools <strong>of</strong> fish in any<br />
particular area and can shows the depth <strong>of</strong> water or shows<br />
the seabed <strong>of</strong> water. This device sends a sound wave into<br />
Figure 2: How to use Fish Finder<br />
the water by way <strong>of</strong> the transducer. The sound wave reflects A. Feature and Specifications<br />
<strong>of</strong>f an object such as a fish, or the bottom, and is detected by<br />
Feature <strong>of</strong> portable fish finder such as given below, and<br />
the transducer also. These echoes are interpreted by the<br />
specifications stated in Table 1.<br />
fishfinder and sent to the display. This simple process can<br />
1) Detect and display grass, short & tall weeds, sand, and<br />
provide with us a wealth <strong>of</strong> information about the unseen<br />
rocks on seabed<br />
region below the water’s surface. The KFW 333 is a low cost,<br />
2) Get the approximate location <strong>of</strong> fish and the depth <strong>of</strong> water<br />
lightweight altimeter designed for diverse applications in the<br />
© 2013 ACEEE<br />
110<br />
DOI: 01.IJRTET.8.2. 39
Full Paper<br />
Int. J. on Recent Trends in Engineering and Technology, Vol. 8, No. 2, Jan 2013<br />
3) Round transducer sensor with 7.5m cable, 45 o beam angle<br />
4) With fish depth scale and audible fish alarm<br />
5) User selectable meter or feet readings<br />
6) Range <strong>of</strong> depth readout from 0.3m up to 100 meters<br />
7) Display bottom rock or grass<br />
TABLE I: SPECIFICATIONS OF PORTABLE FISH FINDER<br />
(b)<br />
Figure 4: (a) At 50 cm level <strong>of</strong> <strong>Sensor</strong><br />
<strong>Sensor</strong><br />
(b) At 30 cm level <strong>of</strong><br />
The propagation characteristic <strong>of</strong> acoustics underwater<br />
highly depends on local environmental factors such as<br />
distance from the ocean surface and depth to the sea-bed as<br />
well as salinity and temperature in the water [1]. As a result,<br />
an error control code system that is designed for one<br />
particular depth may not work well for a different depth. For<br />
example a coding system with high redundancies is required<br />
for shallow water transmission since the acoustic signal could<br />
be reflected by the ocean surface randomly. In fact in a series<br />
<strong>of</strong> experiments [2] showed that up to 20% <strong>of</strong> the signal could<br />
be lost due to the reflection from the ocean surface for the<br />
particular set <strong>of</strong> equipment they used.<br />
II. THEORY<br />
Sonar sensor contains two main parts which are<br />
transmitter and receiver as shown in Figure 5. These two<br />
parts have their own function. The transmitter will emit the<br />
pulse meanwhile the receiver will receive the pulse that<br />
bounce back when hit an object under the water. The reflected<br />
<strong>of</strong> the pulse is known as echo [8][14].<br />
Figure 3:Portable Fish Finder attached to ROV and tested on lab<br />
pool<br />
Figure 5: How sonar sensor works<br />
The sensor has limitation <strong>of</strong> the coverage area. Since it<br />
works at 200 kHz, the capable coverage is only 60p . That<br />
means the object outside the area will not be detected by the<br />
sensor. In the process <strong>of</strong> transmitting the pulse, there should<br />
be no interruption until the pulses reach the seabed [9]. Any<br />
kind <strong>of</strong> interruption will cause a defect in process <strong>of</strong> data<br />
taken. In the other words, the efficiency <strong>of</strong> sensor will be<br />
affected because <strong>of</strong> interruption [10-12] .Figure 6 shows the<br />
transducer works to measure depth <strong>of</strong> water. The frequency<br />
used for the <strong>SASS</strong> is 200k Hz. Wavelength <strong>of</strong> <strong>SASS</strong> is about<br />
1.5km length.<br />
(a)<br />
Figure 4 shows the <strong>SASS</strong> are tested with different depth<br />
to identify the tolerance <strong>of</strong> error as discussed in next section.<br />
© 2013 ACEEE<br />
DOI: 01.IJRTET.8.2.39<br />
111<br />
(a)
Full Paper<br />
Int. J. on Recent Trends in Engineering and Technology, Vol. 8, No. 2, Jan 2013<br />
TABLE II. RESULTS TESTING ON LAB POOL<br />
(b)<br />
Figure 6: the transducer works to measure depth <strong>of</strong> water<br />
III. RESULTS<br />
Generally, the experiment was divided into two parts. First<br />
part <strong>of</strong> the experiment is to find the accuracy <strong>of</strong> the device.<br />
The discussion will focus on the comparison between real<br />
depth and measured depth <strong>of</strong> the pools. The second part is<br />
to measure the seabed mapping. It is important to evaluate<br />
the performance <strong>of</strong> the device before testing at the real field<br />
because we never know how good the device is until it is<br />
proven. Another reason for testing the device is to ensure its<br />
quality and reliability. In order to measure the accuracy, the<br />
device was tested at the three pools which the depth <strong>of</strong> the<br />
pools is known. Accuracy means the difference between the<br />
result <strong>of</strong> the measurement and the true value <strong>of</strong> the<br />
measurement. The difference between two measurement<br />
cannot be assumed as ‘mistakes’ but it is called a variation in<br />
the measurements or in simple word is called as ‘error’.<br />
A. Lab tank test<br />
Since the measurement process is indirect, and the<br />
measurement environment is complicated by many factors<br />
affecting the instrument readings, corrections to the raw data<br />
are needed before they are used to compute geophysical<br />
parameters. Figure 7 shows the lab tank for measure a depth<br />
while Table 2 shows the results testing on lab pool. From<br />
Table shows that error for <strong>SASS</strong> is about 7.7% or ± 5cm depth.<br />
Figure 8 shows the comparison performances <strong>of</strong> <strong>SASS</strong>.<br />
Figure 8: Actual and Measured Data (m) VS Distance (m) for lab<br />
tank test<br />
responsibility and situated in Banda Hilir. The size is about<br />
50m x 25m with 8 lane pools and a depth <strong>of</strong> between 0.9m to<br />
3.8m.<br />
TABLE III. MBMB SWIMMING POOL TEST<br />
Percent <strong>of</strong> error, E 3<br />
for experiment 3 is:<br />
<strong>SASS</strong> will be tested on UTeRG ROV 1 at MBMB swimming<br />
pool whrere the size <strong>of</strong> pool is about 50m length x 25m<br />
width and the depth from 3 feet until 12.5 feet. Table 3 shows<br />
the results <strong>of</strong> testing <strong>SASS</strong>. The length set up increment 5m<br />
Figure 7 : Lab tank<br />
and measure using <strong>SASS</strong> dan the actual depth. Based on<br />
Table 2 the error <strong>of</strong> measring the depth is about ± 10 cm. This<br />
B. MBMB Swimming pool<br />
error is same obtained when tested at lab pool. Figure 9 shows<br />
MBMB Swimming pool is under Melaka City Council the 3D design for swimming pool depth at certain point using<br />
© 2013 ACEEE<br />
112<br />
DOI: 01.IJRTET.8.2. 39
Full Paper<br />
Int. J. on Recent Trends in Engineering and Technology, Vol. 8, No. 2, Jan 2013<br />
micros<strong>of</strong>t <strong>of</strong>fice excel.<br />
The Figure 10 shows the depth <strong>of</strong> 1.2m, which is the place<br />
where the device takes the reading. But in Figure 10 shows<br />
the reading <strong>of</strong> 1.1m. This situation happen not because the<br />
device was placed at the 1.1m but there is error occurs. In the<br />
Table 5, the error also can be seen at few other readings.<br />
TABLE V. DATA TAKEN AT CASA RACHADO RESORT’S SWIMMING POOL<br />
Figure 9: Results Testing on MBMB swimming pool<br />
TABLE IV. DATA TAKEN AT EAGLE RANCH RESORT’S SWIMMING POOL<br />
The Table 4 shows the data taken at the swimming pool.<br />
Real data represent the true measurement meanwhile<br />
measured data is the readings taken from the device. Real<br />
data has not changed since the depth <strong>of</strong> the pool is 1.3m. The<br />
distance means the data taken from the edge <strong>of</strong> the pool. To<br />
obtain a better data, readings taken at every 5m. From the<br />
Table 4, it can be seen that only one data recorded correctly<br />
as in real data while three other data recorded in contrast to<br />
the original. It shows that there is inequality between the real<br />
and measured data using the device. Because <strong>of</strong> the<br />
differences, it can be said that the device has an error.<br />
Percent <strong>of</strong> error for experiment 1 is:<br />
Table 5 shows the readings taken from the pool. It can<br />
see that, from five readings taken, only two readings show<br />
the accuracy with the actual data. This shows uncertain in<br />
measurement or error. The absolute error for the experiment<br />
at the Casa Rachado’s Swimming Pool is shown below.<br />
Percent <strong>of</strong> error for experiment 2 is:<br />
C. Seabed Mapping <strong>of</strong> Tasik Ayer Keroh<br />
After testing the device at the three pools and satisfied<br />
with the accuracy <strong>of</strong> the device, then the device was used to<br />
measure the seabed at the research actual field.<br />
Unlike swimming pool at Eagle Range Resort with only one<br />
depth, the swimming pool at this resort has different depth<br />
starting with 0.4m up to 1.5m. But the process <strong>of</strong> taking the<br />
reading is same. The only thing need to be sure during the<br />
measurement is to make sure the device is positioned at the<br />
depth measure. For example when taking the reading at depth<br />
1.2m, be sure the device place at the right depth.<br />
Figure 10: The device recorded 1.1m at 1.2m depth<br />
© 2013 ACEEE<br />
DOI: 01.IJRTET.8.2.39<br />
Figure 11: Ayer Keroh Lake<br />
There is a difficulty in measuring the size <strong>of</strong> the lake<br />
because <strong>of</strong> the irregular shape. The best way to measure the<br />
side <strong>of</strong> the lake is using reading taken from Google Earth as<br />
shown in Figure 11. The length <strong>of</strong> every side taken in straight<br />
line even though it is known that the shape <strong>of</strong> the lake is<br />
nearly circular. The readings <strong>of</strong> every side are shown in Table<br />
6.<br />
After measuring the total wide <strong>of</strong> the lake, the depth <strong>of</strong><br />
the lake was taken. Since the size <strong>of</strong> the lake is large, it is<br />
difficult to find the seabed mapping for the whole lake. So, in<br />
this study, the seabed mapping only involved thirty one lines<br />
113
Full Paper<br />
Int. J. on Recent Trends in Engineering and Technology, Vol. 8, No. 2, Jan 2013<br />
TABLE VI. LENGTH OF EVERY SIDE OF TASIK AYER KEROH<br />
in the middle <strong>of</strong> the lake as shown in Figure 12. The next<br />
experiment done on ayer keroh lake. The layout <strong>of</strong> testing<br />
area at ayer keroh lake as shown in Figure 12. For the first<br />
experiment only one set point to measure the depth and the<br />
result as shown in Figure 13. To do 3D plot more data needed.<br />
31m length x 31m width testing and some data collection.<br />
Every 1m the <strong>SASS</strong> will be ,measuring the depth<br />
(b)<br />
Figure 12: Experiment set up at Ayer keroh Lake<br />
Figure 13: Results testing on Ayer keroh Lake at one certain point<br />
(c)<br />
Figure 14: The view <strong>of</strong> seabed mapping plotted using MATLAB<br />
with different view<br />
Figure 14 shows the results plotted on 3D dimension <strong>of</strong><br />
seabed mapping using MATLAB s<strong>of</strong>tware. Difference views<br />
<strong>of</strong> depth as shown in Figure 14. From the thirty one lines, it<br />
can conclude that the depth <strong>of</strong> the lake is always changing at<br />
different point. That means, there is no flat seabed for the<br />
lake [13]. The difference <strong>of</strong> seabed might be caused by the<br />
different mineral seabed such as clay, bedrocks or waste since<br />
the lake is open to public for water activities.<br />
Realized the importance <strong>of</strong> seabed mapping for various<br />
purpose, it is good if the research can be extended to the next<br />
level. One <strong>of</strong> the further researches is to study the relationship<br />
between depth and water density. In particular, it is necessary<br />
to investigate how density changes as the depth changes.<br />
Whether it is directly proportional or nor related at all. Or<br />
maybe there are other factors that influence the changes.<br />
Another further research can be made is the study <strong>of</strong> the<br />
relationship between depth and seabed mineral and<br />
investigate whether the depth <strong>of</strong> the water can describe the<br />
condition <strong>of</strong> seabed mineral.<br />
© 2013 ACEEE<br />
DOI: 01.IJRTET.8.2. 39<br />
(a)<br />
IV. CONCLUSION<br />
Today measurement <strong>of</strong> the seabed mapping is a necessary<br />
as many activities can be done in the sea, lake or river. Knowing<br />
the seabed mapping will provides many benefits to many<br />
parties. There are several techniques in seabed mapping;<br />
one <strong>of</strong> the techniques is using echo sounding. It has been<br />
discussed how echo sounding works in determining the<br />
seabed mapping. The device sent the pulse in water and<br />
reflects back when it has contact with hard object. The time<br />
114
Full Paper<br />
Int. J. on Recent Trends in Engineering and Technology, Vol. 8, No. 2, Jan 2013<br />
pulse taken to reflect back to the device will be used to measure<br />
the distance from the device and seabed. The accuracy<br />
<strong>of</strong> the device sometimes needs to be ensured before used in<br />
measuring. Normally, there is difference between true value<br />
and the result <strong>of</strong> the measurement.<br />
<strong>Altimeter</strong> <strong>Sensor</strong> system is used to measure the depth <strong>of</strong><br />
water and valid for shallow water depth ranges maximum 100<br />
m. This <strong>SASS</strong> will be applied to Underwater Remotely<br />
Operated Vehicles (ROV) design to verify the <strong>SASS</strong><br />
performances. The error <strong>of</strong> <strong>Altimeter</strong> <strong>Sensor</strong> <strong>System</strong> is 10%<br />
±5 cm depth and accuracy <strong>of</strong> <strong>SASS</strong> very high about 90%.<br />
Future work is to plot more lake and river in Melaka. All data<br />
will be useful for safety and rescue.<br />
ACKNOWLEDGEMENT<br />
Special appreciation and gratitude to honorable University<br />
(Universiti Teknikal Malaysia Melaka, UTeM and Universiti<br />
Teknologi Malaysia, UTM) especially to the both Faculty <strong>of</strong><br />
Electrical Engineering for providing the financial as well as<br />
moral support to complete this project successfully.<br />
REFERENCES<br />
[1] C. Chen a, A. Anvara and T. Lua, Modelling and Simulation <strong>of</strong><br />
Automated Underwater Acoustic Communication<br />
Transmission Recovery for Oceanic Robotics Operations, 19th<br />
International Congress on Modelling and Simulation, Perth,<br />
Australia, 12–16 December 2011.<br />
[2] Bevan, J., D. L. Zhao, X. Mu, and N. H. Yahaya (2010, October).<br />
Intelligent robot long-distance hybrid secure communication<br />
control. Honour Thesis.<br />
[3] David W. Hancock. Ronald G. Forsythe, and Jack Lorell,<br />
Seasat <strong>Altimeter</strong> <strong>Sensor</strong> File Algorithms, IEEE Journal <strong>of</strong><br />
Oceanic Engineering, Vol. Oe-5, No. 2, April 1980<br />
[4] John L. Macarthur, Design <strong>of</strong> The Seasat-A War <strong>Altimeter</strong>,<br />
IEEE Journal <strong>of</strong> Oceanic Engineering, April 1976<br />
[5] Report No: 406, Fundamentals <strong>of</strong> Underwater sound,<br />
International Association <strong>of</strong> Oil & Gas Producers, May 2008.<br />
[6] Lawrence E. Kinsler and Austin R. Frey, Fundamentals <strong>of</strong><br />
Acoustics., 4 th . ed. New York. John Wiley & Sons, 2002.<br />
[7] I.Ceren Elmasli and Hayrettin Koymen, A Wideband and a<br />
Wide - Beamwidth Acoustic Transducer Design for<br />
Underwater Acoustic Communications, IEEE, 2006.<br />
[8] W. A. Smith, Modelling 1-3 Composite Pizoelectrics:<br />
Thickness Mode Oscillations, IEEE Trans Ultrason. Ferroelec.<br />
Freq. Contr., Vol. 38, pp. 40-46, 1991.<br />
[9] Qiao Ziliang, Lei Kaizhuo, Zhang Qunfei and Teng Duo,<br />
Response Characteristics <strong>of</strong> Acoustic Transducer in Intense<br />
Sound Pulse, IEEE, 2008.<br />
[10] Ali R. Amiri-Simkooei, Mirjan Snellan and Dick G. Simmons,<br />
Principle Component Analysis <strong>of</strong> Single-Beam Echo-Sounder<br />
Signal Features for Seafloor Classification, 2011.<br />
[11] D. D. Sternlicht and C. P. D. Moustier, Remote sensing <strong>of</strong><br />
Sediment Characteristics by Optimized Echo-envolope<br />
Matching, IEEE, 2003.<br />
[12] R. T DeKeyzer, J. S. Byrne, J. D. Case, B. A. Clifford amd W.<br />
S Simmons, A Comparison <strong>of</strong> Aucostic Imagenary <strong>of</strong> Sea Floor<br />
Features <strong>Using</strong> a Towed Side Scan Sonar and a Multibeam<br />
Echosounder, IEEE, 2002.<br />
[13] Henry Manik and Masahiko Furusawa, Combined Underwater<br />
Acoustic and Radar Instruments for Assessing Fish Near<br />
Seabed and Mapping Seabed, IEEE, 2002.<br />
[14] Erik Hammerstad, Multibeam Echo Sounder for EEZ Mapping,<br />
IEEE, 1997.<br />
© 2013 ACEEE<br />
DOI: 01.IJRTET.8.2.39<br />
115