EUROPEAN SYNCHROTRON RADIATION FACILITY
EUROPEAN SYNCHROTRON RADIATION FACILITY
EUROPEAN SYNCHROTRON RADIATION FACILITY

Create successful ePaper yourself
Turn your PDF publications into a flip-book with our unique Google optimized e-Paper software.
Beamline:<br />
ID-02<br />
Shifts:<br />
9<br />
Experiment title:<br />
Swelling/Deswelling Kinetics of Temperature-Sensitive<br />
PNIPAM Microgels in Mixed Solvents<br />
Date of experiment:<br />
from: 23.11.2012 to: 26.11.2012<br />
Local contact(s):<br />
Dr. Gudrun Lotze<br />
Experiment<br />
number:<br />
SC-3475<br />
Date of report:<br />
23/07/2013<br />
Received at ESRF:<br />
Names and affiliations of applicants (* indicates experimentalists):<br />
Dersy Lugo*; Christine Scherzinger*, Cornelius Hofzumahaus*, Walter Richtering<br />
(Institute of Physical Chemistry, RWTH Aachen,Landoltweg 2, D-52056 Aachen,<br />
Germany)<br />
Report:<br />
PNIPAM is one of the most widely studied water-swellable microgel system. It is a thermosensitive microgel<br />
and becomes insoluble in aqueous solution at 32 °C. [1] This temperature is known as the volume phase<br />
transition temperature (VPTT). The PNIPAM microgels do not only exhibit a well-defined temperatureinduced<br />
phase transition in aqueous media, but also a so-called cononsolvency effect. [2] This term describes<br />
the phenomenon that the polymer is insoluble in a certain concentration range of solvent mixtures, while<br />
being soluble in the pure solvents. Previous works [2-3] showed that the PNIPAM microgel particles deswell to<br />
a minimum size upon the addition of alcohols and then, reswell again as the alcohol-rich region is<br />
approached.<br />
These stimuli-responsive properties of the microgels make them special materials for applications in many<br />
fields, especially in the industrial and biomedicals areas Therefore, their properties has been widely studied,<br />
but all these studies have been focused to investigate the size, shape, morphology, composition and VPTT of<br />
the microgel particles and relatively few research has been reported on their volume phase transition (VPT)<br />
kinetics by means of the stopped flow technique [4] or nanosecond laser-induced temperature-jump<br />
technique [5] .<br />
To the best of our knowledge, the swelling/deswelling kinetics of microgels induced by a change of solvent<br />
composition has not been reported yet, Therefore, in this contribution we have exploited the cononsolvency<br />
effect to study the collapsed kinetics of PNIPAM microgels by means of the stopped flow-SAXS technique.<br />
The solvent exchange kinetics in PNIPAM microgels implicate a different and more complicated process for<br />
the VPT of microgels that those induced by temperature- or pH-jump reported in the literature, [4,5] since in the<br />
cononsolvency phenomenon the volume transition of the microgel particles requires first that a co-nonsolvent<br />
(e.g. methanol) penetrates into the microgel and, then, when sufficient solvent has been exchanged, the<br />
solvent mixture is expelled when the particle shrinks. Thus, a coupled mass-transport is involved in the<br />
cononsolvency process, in which the mass transport of each solvent (e.g. methanol and water) is different as<br />
compared to the transport of protons used in pH-jump experiments. [5]
In addition, exploiting the cononsolvency effect will not only allow studying both deswelling and swelling<br />
with the same system but also by different routes. E.g. particles swollen either in water (H 2 O) or in methanol<br />
(MeOH) can be completely collapsed by adding either methanol or water, respectively.<br />
We have used PNIPAM microgels of 5 different sizes in the range of 800 nm – 2 µm dispersed in H 2 O and in<br />
MeOH in our time-resolved SAXS experiment on the beamline ID02. The measurements were made at a<br />
temperature of 10 °C below the VPTT of the particles in H 2 O (32°C) and the final concentration of the<br />
PNIPAM microgel in the desired final H 2 O/MeOH solvent composition was set to 0.4 wt%. In this<br />
experiment, we focused mostly in the solvent exchange collapse transition kinetics starting from different<br />
initial states (starting with dispersions of PNIPAM in pure H 2 O or in pure MeOH) to reach the same final<br />
state (dispersions of PNIPAM in a mole fraction of methanol (x MeOH ) of 0.20). All measurements were made<br />
at a wavelength of 1Å . The samples were measured at three different detector distances (3m, 8m, and 10m).<br />
Additionally, we performed static measurements in a flow-through cell to determine the initial and final state<br />
of our particles at 10 °C.<br />
PNIPAM dispersions in pure solvent (either H 2 O or MeOH), H 2 O , and MeOH were injected into the stoppedflow<br />
apparatus. A PNIPAM dispersion and its contrarion solvent, i.e. a PNIPAM dispersion in pure H 2 O was<br />
mixed turbulently with MeOH and vice versa, were injected for 50ms continously into the flow path of the<br />
stopped-flow device corresponding to a steady state condition. X-ray data acquistion was triggered directly<br />
before those 50ms. The sample age of the mixed solution during this steady state was mainly determined by<br />
the necessary time to flow from the mixer inside the stopped flow device to the point of X-ray exposure. This<br />
initial dead time was 3 ms. The effective exposure time for each frame was 1.5 ms meaning that each<br />
scattering curve was integrated over 1.5 ms. Consequently, the first scattering curve describes the kinetic at a<br />
point in time of 3.75ms. The minimum detector readout time during the experiment was 320 ms, hence a<br />
stroboscopic data strategy was necessarily applied to access points in time well before 320ms. This was<br />
achieved by varying the first dead time before the first X-ray exposure, i.e. a delay time of 50 ms, 55 ms, 60<br />
ms, 70ms etc. was introduced.<br />
Each mixing experiment was repeated with first acquisition delayed 50, 55, 60, 70 ms, etc. Each acquisition<br />
was repeated three times to improve the statistics and to verify the reproducibility. Subsequently, all curves<br />
were averaged for each point in time. Model fitting has been carried out using the NIST SANS analysis<br />
package [6] , a form factor for polydisperse microgels developed by Stieger et al. [7] and for polydisperse coreshell<br />
microgels developed by Berndt et al. [8]<br />
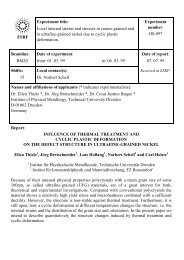
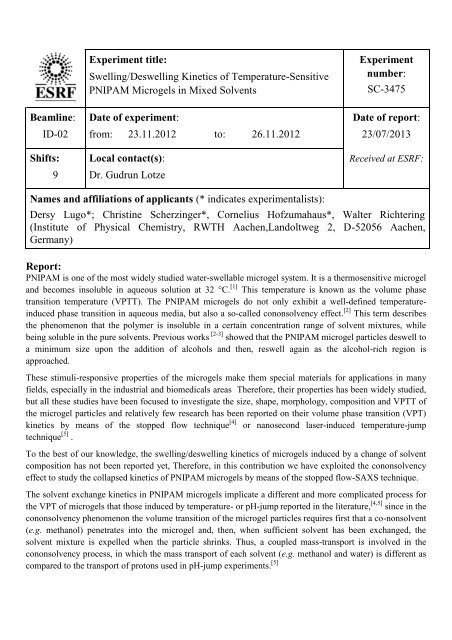
As an example, we present here the results for the<br />
biggest particle used on this experiment in the<br />
solvent composition jump from pure MeOH to<br />
x MeOH = 0.20. Figure 1 shows a time series of SAXS<br />
curves over the full range of the measured times,<br />
in which many form factors minima are observed.<br />
As it can be seen on the first two acquisitions,<br />
it is not possible to observe the first form factor<br />
minimum (q min,1 ) due to the fact that this minimum<br />
is out of the q range of the ID02. With time the first<br />
form factor minimum appears and shifts to higher q<br />
regions.<br />
More oscillations at the higher q region are as well<br />
evident, indicating shrinking and a narrower size<br />
Intensity, cm -1<br />
1E13 3.75 ms<br />
1E12<br />
1E11<br />
1E10<br />
1E9<br />
1E8<br />
1E7<br />
1000000<br />
100000<br />
10000<br />
1000<br />
100<br />
10<br />
0,1 1<br />
0,01<br />
1E-3<br />
0,01 0,1<br />
q, nm -1<br />
PNIPAM in MeOH PNIPAM in X MeOH<br />
= 0.20<br />
Figure 1. Radial averaged SAXS diffraction<br />
pattern for the biggest PNIPAM in the solvent<br />
indicating shrinking and a narrower size distribution composition jump from pure MeOH to x MeOH = 0.20.<br />
of the particles with time. In Figure 1, curves were Times were corrected for the 50ms offset.<br />
5.75 ms<br />
8.75 ms<br />
13.75 ms<br />
23.75 ms<br />
33.75 ms<br />
53.75 ms<br />
83.75 ms<br />
93.75 ms<br />
113.75 ms<br />
143.75 ms<br />
193.75 ms<br />
233.75 ms<br />
325.25 ms<br />
433.75 ms<br />
573.75 ms<br />
753.75 ms<br />
876.75 ms<br />
978.25 ms<br />
1078.25 ms<br />
1339.75 ms<br />
1519.75 ms<br />
1751.75 ms<br />
2072.75 ms
R form factor min 1<br />
, nm<br />
vertically shifted to higher intensities by multiplication for better visibility.<br />
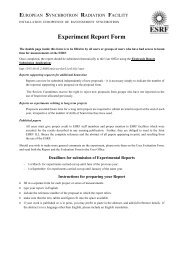
The radius of the microgel was determined from the position of q min,1 and with this information the evolution<br />
of the microgel size with time was derived (Fig. 2). The position of q min,1 provides information about the<br />
radius of collapsed microgel particles, as they behave similar as hard spheres at this state. In the case of<br />
swollen microgel particles, the position of q min,1 provides information about the radius from the center of the<br />
particle to the half-width of its fuzziness (see Fig. 1 on reference [7]). Since swollen microgels exhibit an<br />
inhomogeneous density with a cross-linking density decreasing from the center towards the periphery and this<br />
leads to a fuzziness of the particle surface.<br />
In Figure 2 the evolution of the microgel size with time is plotted for the biggest PNIPAM microgel for two<br />
solvent composition jumps starting from different initial states to reach the identical final state.<br />
It can be observed that the equilibrium radius is similar<br />
in both cases, as expected. This minimum radius is in the<br />
order of 309 nm (similar to the microgel radius at x MeOH<br />
= 0.20 obtained by static light scattering measurements<br />
performed at 20 °C (R qmin.1 307 nm)). It seems that the<br />
temperature inside the cuvette increases by 10°C, due to<br />
the heat released by mixing H 2 O and MeOH in order to<br />
obtain a final solvent composition of x MeOH = 0.20, as it<br />
has been predicted theoretically assuming an adiabatic<br />
process without friction and verified experimentally<br />
by measuring the temperature inside the stopped<br />
flow cuvette during the kinetics measurements with a<br />
cable sensor Pt100 and recording the temperature with time.<br />
420<br />
400<br />
380<br />
360<br />
340<br />
320<br />
X M,i<br />
= 0.00 to X M,f<br />
= 0.20<br />
X M,i<br />
= 1.00 to X M,f<br />
= 0.20<br />
300<br />
0 500 1000 1500 2000 2500<br />
t, ms<br />
Figure 2. Evolution of the microgel size with time<br />
Another important feature of this plot is that collapse after two different solvent composition jumps.<br />
transition kinetics of PNIPAM induced by adding MeOH<br />
to the aqueous dispersion of the microgel is slower than that induced by the addition of H 2 O to the dispersion<br />
of PNIPAM in pure MeOH.<br />
At the early stages of the collapse transition during the solvent exchange, one might expect that microgel<br />
volume transitions would occur first at the microgel periphery and proceed towards the interior. That would<br />
lead to the formation of a desolvated shell of polymer surrounding a solvated core. The hydrophobicity of this<br />
skin layer tunes the diffusion rate of the solvent from the shell and subsequently from the particle interior.<br />
Then further deswelling occurs by a thickening of the desolvated layer and a decrease of the swollen core<br />
until an equilibrium state is reached where the microgel particle exhibits a homogeneous density profile<br />
similar to the hard spheres.<br />
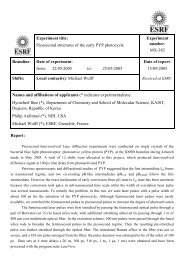
According to the explanation given above, we could fit the form factor curves at the final state with a model<br />
for spheres with homogeneous density. But the curves corresponding to the points in times before the<br />
equilibrium state could not be very well described with a core-shell form factor model. We have found a very<br />
good agreement if we assume a bimodal dispersion containing spheres and core-shell spheres with<br />
homogeneous density and the shell becomes thicker and thicker with time. Figure 3 shows scattering curves<br />
for the biggest PNIPAM in the solvent composition jump from pure MeOH to x MeOH = 0.20 at a time before<br />
the equilibrium state ( 193.75 ms) and at the equilibrium state ( 2072.75 ms). The cartoons in the plots<br />
represent the morphology of the PNIPAM particles at the corresponding time. As can be seen, the cartoon at<br />
193.75 ms corresponds to the existence of two kind of morphologies of the PNIPAM particles with different<br />
sizes (spheres and core-shell spheres with homogeneous density). The drawback of the assumption of a
Intensity, cm -1<br />
Intensity, cm -1<br />
bimodal dispersion is that the radius of the homogeneous spheres is significantly bigger than the radius<br />
estimated from the position of q min,1 , and moreover, to the core-shell spheres radius. This preliminary analysis<br />
indicates that the system is more complicated than expected and therefore we will try as a next step to fit the<br />
curves with other core shell spheres form factor. In the first model a polydisperse shell will be assumed [6] ; in<br />
the second model a shell with decaying density profile [9] will be assumed; and in the third model an<br />
asymmetric interface between the core and the shell it will be assumed [10] .<br />
10000<br />
1000<br />
100<br />
10<br />
1<br />
0,1<br />
Sum of Log Normal spheres and Polyd. core shell spheres<br />
form factors<br />
193.75 ms<br />
(a)<br />
0,01 0,1<br />
q, nm -1<br />
10000 Polydisperse hard spheres with homogeneous density<br />
2072.75 ms<br />
1000<br />
100<br />
10<br />
1<br />
0,1<br />
(b)<br />
0,01 0,1<br />
q, nm -1<br />
Figure 3. Radial averaged SAXS diffraction pattern for the biggest PNIPAM in the solvent composition jump from pure<br />
MeOH to x MeOH = 0.20: (a) before the final state (t = 193.75 ms); (b) at the final state (t = 2072.75 ms). The cartoons<br />
A similar behaviour was observed for the other PNIPAM microgels, in which a faster response rate of the<br />
collapse transtion kinetics was observed by decreasing the particle size, in concordance with the Tanaka-<br />
Fillmore Theory [11] .<br />
In summary, we were able to obtain high quality data observing for the first time to our best knowledge with<br />
time-resolved SAXS the solvent exchange kinetics collapse transition in PNIPAM microgels. We will now<br />
focus on the modeling of this data and explore different model approaches to describe the internal structure<br />
changes of the polymer network induced by cononsolvency effect.<br />
References<br />
[1] R.H. Pelton, P. Chibante, Colloids Surf. 1986,120, 247-256.<br />
[2] F. M. Winnik, H. Ringsdorf, J. Venzmer, Macromolecules 1990, 23, 2415-2416; F. M. Winnik, M. F.<br />
Ottaviani, S. H. Bossmann, M. Garcia-Garibay, N. J. Turro, Macromolecules 1992, 25, 6007-6017.<br />
[3] H. M. Crowther, B. Vincent, Colloid Polym Sci 1998, 276, 46-51; G. Zhang, C. Wu, J. Am. Chem. Soc.<br />
2001, 123, 1376-1380; C. Scherzinger, P. Lindner, M. Keerl, W. Richtering, Macromolecules 2010, 43,<br />
6829-6833.<br />
[4] J. Wang, D. Gan, L. A. Lyon, M. A. El-Sayed, J. Am. Chem. Soc., 2001, 123, 11284-11289.<br />
[5] D. Dupin, J. Rosselgong, S. P. Armes, A. F. Routh, Langmuir, 2007, 23, 4035-4041; J. Yin, D. Dupin, J.<br />
Li, S. P. Armes, S. Liu, Langmuir, 2008, 24, 9334-94340.<br />
[6] S. R. Kline, J. Appl. Cryst. 2006, 39, 895-900.<br />
[7] M.Stieger, W. Richtering, J.S. Pedersen, P. Lindner, J. Chem. Phys. 2004, 120, 6197-6206.<br />
[8] I. Berndt,; J. S. Pedersen, W. Richtering, J. Am. Chem. Soc. 2005, 127, 9372–9373.<br />
[9] C. M. Wijmans, E. B. Zhulina, Macromolecules 1993, 26, 7214-7224.<br />
[10] I. Berndt,; J. S. Pedersen, W. Richtering, Angew. Chem., Int. Ed. 2006, 45, 1737–1741.<br />
[11] Tanaka T.; Fillmore D. J. J. Chem. Phys. 1979, 70, 1214-1218.