View - SRE-Discussion Papers and SRE-Research Reports
View - SRE-Discussion Papers and SRE-Research Reports
View - SRE-Discussion Papers and SRE-Research Reports

You also want an ePaper? Increase the reach of your titles
YUMPU automatically turns print PDFs into web optimized ePapers that Google loves.
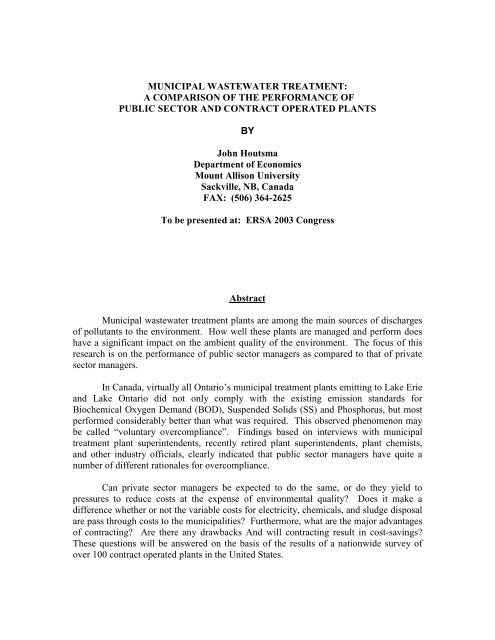
MUNICIPAL WASTEWATER TREATMENT:<br />
A COMPARISON OF THE PERFORMANCE OF<br />
PUBLIC SECTOR AND CONTRACT OPERATED PLANTS<br />
BY<br />
John Houtsma<br />
Department of Economics<br />
Mount Allison University<br />
Sackville, NB, Canada<br />
FAX: (506) 364-2625<br />
To be presented at: ERSA 2003 Congress<br />
Abstract<br />
Municipal wastewater treatment plants are among the main sources of discharges<br />
of pollutants to the environment. How well these plants are managed <strong>and</strong> perform does<br />
have a significant impact on the ambient quality of the environment. The focus of this<br />
research is on the performance of public sector managers as compared to that of private<br />
sector managers.<br />
In Canada, virtually all Ontario’s municipal treatment plants emitting to Lake Erie<br />
<strong>and</strong> Lake Ontario did not only comply with the existing emission st<strong>and</strong>ards for<br />
Biochemical Oxygen Dem<strong>and</strong> (BOD), Suspended Solids (SS) <strong>and</strong> Phosphorus, but most<br />
performed considerably better than what was required. This observed phenomenon may<br />
be called “voluntary overcompliance”. Findings based on interviews with municipal<br />
treatment plant superintendents, recently retired plant superintendents, plant chemists,<br />
<strong>and</strong> other industry officials, clearly indicated that public sector managers have quite a<br />
number of different rationales for overcompliance.<br />
Can private sector managers be expected to do the same, or do they yield to<br />
pressures to reduce costs at the expense of environmental quality? Does it make a<br />
difference whether or not the variable costs for electricity, chemicals, <strong>and</strong> sludge disposal<br />
are pass through costs to the municipalities? Furthermore, what are the major advantages<br />
of contracting? Are there any drawbacks And will contracting result in cost-savings?<br />
These questions will be answered on the basis of the results of a nationwide survey of<br />
over 100 contract operated plants in the United States.
2<br />
OUTLINE<br />
I<br />
II<br />
III<br />
IV<br />
V<br />
INTRODUCTION: INSTITUTIONAL ARRANGEMENTS<br />
CONTRACTING FOR WASTEWATER TREATMENT<br />
MAIN ADVANTAGES<br />
MAIN DRAWBACKS<br />
WILL CONTRACTING RESULT IN COST-SAVINGS?<br />
EFFLUENT QUALITY: PUBLIC vs PRIVATE SECTOR<br />
PERFORMANCES<br />
SUMMARY AND CONCLUSIONS
3<br />
I INTRODUCTION: INSTITUTIONAL ARRANGEMENTS<br />
Throughout the world, privatization of water supply <strong>and</strong> sewerage services is a<br />
controversial topic of political debate. Any nationalization, privatization, or alteration in<br />
the regulating regime constitutes a significant change of the institutional mechanism of<br />
water management. The focus of this paper will be on the institutional arrangements<br />
most commonly found in Canada <strong>and</strong> the United States. For the sake of clarity <strong>and</strong><br />
contrast the main historical developments in Engl<strong>and</strong> <strong>and</strong> Wales will be briefly outlined<br />
at the outset.<br />
Prior to 1973, as Table 1 shows, there were 29 Statutory (private) water<br />
companies <strong>and</strong> a complex mixture of public sector groups, including municipal utilities,<br />
in Engl<strong>and</strong> <strong>and</strong> Wales. In 1973, the municipally owned industry was restructured on the<br />
basis of geographic rather than political or administrative boundaries, <strong>and</strong> the Water <strong>and</strong><br />
Sewerage Authorities were created based in <strong>and</strong> serving ten regions in Engl<strong>and</strong> <strong>and</strong><br />
Wales. These ten publicly owned Water Authorities were reconstituted in 1989 as private<br />
companies owning the infrastructure network <strong>and</strong> assets of the industry. They were then<br />
floated on the Stock Exchange as ten companies whose main subsidiary supplied water<br />
<strong>and</strong> sewerage services. Due to takeovers <strong>and</strong> mergers the number of statutory water only<br />
companies was reduced from 29 to 19 by April 1996. Economic regulation is being<br />
carried out by a national organization, The Office of Water Services (OFWAT).<br />
Comprehensive assessments of the performance of this newly privatized water industry<br />
can be found in Shaoul, (1997) <strong>and</strong> Letza <strong>and</strong> Smallman, (2001).<br />
In Canada <strong>and</strong> the United States, two principal modes of producing local<br />
government services are in-house provision by government employees, <strong>and</strong> contracting<br />
out to private suppliers, also known as privatization. Compared to the British context, the<br />
term privatization now has quite a different meaning. Under a purchase-of-service<br />
contract, the public authority retains ownership but awards a competitive bid to a private<br />
vendor for operating <strong>and</strong> maintenance. There is now no need for systematic economic<br />
regulation. Only emission st<strong>and</strong>ards <strong>and</strong> staffing levels (in some cases) are imposed by<br />
provincial <strong>and</strong> state levels of government.<br />
As Table 1 shows, in both countries the water supply is managed in-house by<br />
approximately 80% of all utilities. In the remaining 20%, it is provided by private
4<br />
companies in the case of the United States. In Ontario, however, the Ontario Clean<br />
Water Agency, a public sector agency, manages water supply on behalf of 18% of the<br />
water utilities. In only 2% of the municipalities do private companies supply water.<br />
As far as wastewater treatment is concerned the public sector-private sector<br />
breakdown in Ontario is the same as for water supply: 98% vs 2%. Here the Ontario<br />
Clean Water Agency (OCWA) plays a greater role, managing more than half of all<br />
facilities. OCWA actively competes with private companies for contracts. It’s success in<br />
winning contracts explains, in part at least, the very limited role of private firms in<br />
Ontario.<br />
In the United States contracting for wastewater treatment started in the early<br />
1980’s (Holcombe, 1991). By now private firms have a market share of about 3%.<br />
Many municipal officials are satisfied with this arrangement. However, there were<br />
others, as we shall see, who were not. This resulted in the cancellation <strong>and</strong>/or nonrenewals<br />
of contracts.
5<br />
Table 1<br />
GREAT BRITAIN<br />
WATER SUPPLY AND WASTEWATER TREATMENT:<br />
INSTITUTIONAL ARRANGEMENTS<br />
Before 1973: WATER SUPPLY WASTEWATER<br />
TREATMENT<br />
29 STATUTORY WATER COMPANIES 25% -<br />
(private sector monopolies)<br />
A COMPLEX MIXTURE OF PUBLIC<br />
75% 100%<br />
SECTOR GROUPS, INCL. MUNICIPAL<br />
UTILITIES<br />
Water act of 1973<br />
29 STATUTORY WATER COMPANIES 25% -<br />
(private sector monopolies)<br />
10 REGIONAL WATER AUTHORITIES 75% 100%<br />
Water act of 1989<br />
29 (NOW 19) STATUTORY WATER<br />
25% -<br />
COMPANIES<br />
10 WATER SERVICE PUBLIC LIMITED<br />
COMPANIES<br />
(Large private sector monopolies)<br />
75% 96%<br />
CANADA (Ontario only) – 657 WATER SUPPLY SYSTEMS<br />
454 WASTEWATER TREATMENT SYSTEMS<br />
FACILITIES OPERATED BY WATER SUPPLY WASTEWATER<br />
TREATMENT<br />
MUNICIPAL UTILITIES 519 (70%) 209 (46%)<br />
ONTARIO CLEAN WATER AGENCY* 123 (18%) 234 (52%)<br />
PRIVATE COMPANIES 15 ( 2%) 11 ( 2%)<br />
*ONTARIO CLEAN WATER AGENCY is a PUBLIC SECTOR AGENCY<br />
UNITED STATES - 34,000 WATER SUPPLY SYSTEMS <strong>and</strong>,<br />
15,000 WASTEWATER TREATMENT SYSTEMS<br />
FACILITIES OPERATED BY: WATER SUPPLY WASTEWATER<br />
TREATMENT<br />
MUNICIPAL UTILITIES 80% 97%<br />
PRIVATE COMPANIES 20% 3%
6<br />
II. CONTRACTING FOR WASTEWATER TREATMENT:<br />
ADVANTAGES AND DRAWBACKS<br />
MAIN ADVANTAGES:<br />
In order to become informed about contract operations for wastewater treatment<br />
some 240 city <strong>and</strong> municipal authorities all across the United States were contacted with<br />
the request to complete a four-page questionnaire. In total the response rate was close to<br />
fifty percent. Fully completed questionnaires were received covering 91 contracts <strong>and</strong> a<br />
further 16 were received from places that had decided to discontinue contracting in the<br />
recent past. In this latter group one or more reasons for non-renewal were given by a<br />
municipal official. Although the questionnaires were sent to municipal officials, the<br />
clients, out of the 91 a total of 65 were completed by a municipal official <strong>and</strong> the<br />
remaining 26 by their contractor.<br />
A summary of the main advantages as perceived by 65 municipal officials is<br />
found in Table 2A. It comes as no surprise that the list is headed by gaining the benefits<br />
of the Contractor’s Resources. These include expertise, experience, knowledge, trained<br />
staff <strong>and</strong> quality personnel, <strong>and</strong> professional services <strong>and</strong> technical support.<br />
Second in terms of response frequency are Cost Savings (in 15 cases), <strong>and</strong> Cost<br />
Control (in 7 cases). Administrative Convenience is also acknowledged by a fair number<br />
of respondents, as well as Liability Protection <strong>and</strong> Risk Shifting. It is somewhat<br />
surprising perhaps, in light of the acknowledged contractors’ quality resources, that<br />
Higher Quality Service was mentioned only in a few cases. In the last part of the paper<br />
we will take a closer look at this <strong>and</strong> learn that the contracting firms do very well in terms<br />
of meeting emission requirements.<br />
MAIN DRAWBACKS:<br />
Table 2B summarizes the views of municipal officials pertaining to drawbacks of<br />
contracting. The responses included here are those of 65 administrators where contracts<br />
are still in force <strong>and</strong> those of 16 administrators of operations where contracts had not<br />
been renewed. The main reasons cited for non-renewal were Inadequate Contractor<br />
Performance in 7 cases, <strong>and</strong> Higher Cost in 13 cases. Higher Cost, or the Possibility of
7<br />
Higher Cost were noted in a further 8 cases. A third frequently mentioned drawback<br />
related to control, either as Reduced Control or Loss of Control.<br />
Surprisingly few municipal officials mentioned Negotiating a Contract or<br />
Contract Management <strong>and</strong> Monitoring. With contracts in place <strong>and</strong> lasting, in the<br />
majority of cases, 5 years or longer, contract negotiation was often a matter of the past.<br />
Therefore, we learned from a different questionnaire question that relatively few major<br />
changes were made at contract renewal time. Contract management <strong>and</strong> monitoring<br />
resources were arranged for in at least 35 (out of 91) municipalities.<br />
TABLE 2A<br />
MAIN ADVANTAGES OF CONTRACTING<br />
1. CONTRACTOR’S RESOURCES<br />
EXPERTISE, EXPERIENCVE, KNOWLEDGE 18<br />
PROFESSIONAL STAFF, QUALITY PERSONNEL 6<br />
PROFESSIONAL SERVICES, TECHNICAL SUPPORT 5<br />
2. COST SAVINGS AND COST CONTROL<br />
COST SAVINGS 15<br />
FIXED COST, COST CONTINUITY, LEVELING 7<br />
3. ADMINISTRATIVE CONVENIENCE<br />
NO STAFF TRAINING, SUPERVISION, HASSELS 6<br />
DAY-TO-DAY OPERATIONS BY OTHERS 4<br />
ABILITY TO FOCUS EFFORTS ELSEWHERE 1<br />
4. LIABILITY PROTECTION AND RISK SHIFTING<br />
CONTRACTOR IS UP-TO-DATE WITH NEW RULES AND 5<br />
REGULATIONS<br />
INCREASED LIABILITY PROTECTION, SOME RISK 4<br />
SHIFTING<br />
5. HIGHER QUALITY OF SERVICES<br />
IMPROVED PERFORMANCE, COMPLIANCE 3<br />
BETTER SAFETY RECORDS 1<br />
BETTER SERVICE TO THE PUBLIC 1
8<br />
TABLE 2B<br />
MAIN DRAWBACKS OF CONTRACTING<br />
1. INADEQUATE CONTRACTOR PERFORMANCE<br />
REASON CITED IN 7 OUT OF 16 CASES OF NON-RENEWAL 7<br />
CONTRACT DELIVERABLES ARE NOT ACHIEVED 1<br />
LOW SERVICES TO INFRASTRUCTURE 1<br />
2. HIGHER COST<br />
REASON CITED IN 13 OUT OF 16 CASES OF NON-RENEWAL 13<br />
HIGHER COST (4), POSSIBLY HIGHER COST (4) 8<br />
3. REDUCED CONTROL OR LOSS OF CONTROL<br />
REDUCED OR LOSS OF CONTROL 12<br />
RESPONSE TIME TO CRITICAL WORK 1<br />
KEEPING CONTRACTOR MOTIVATED; POOR LEADERSHIP<br />
POSSIBLE 1<br />
4. NEGOTIATING A CONTRACT<br />
WITH CLEAR LANGUAGE THAT ADDRES ALL ISSUES 1<br />
TIME CONSUMING, COSTLY, POLITICAL VOLATILE 1<br />
5. CONTRACT MANAGEMENT AND MONITORING<br />
AT LEAST 35 PLACES (OUT OF 91) CHOSE TO INCUR 3<br />
OVERHEAD COSTS ASSOCIATED WITH CONTRACT<br />
MANAGEMENT AND MONITORING<br />
6. NONE 16
9<br />
III WILL CONTRACTING RESULT IN COST-SAVINGS?<br />
In the preceding section dealing with Advantages <strong>and</strong> Drawbacks we saw that<br />
among municipal administrators who have experience with contracting there is no clear<br />
prevailing view one way or the other. About as many indicated a clear cost savings<br />
advantage, as there were persons, who took the opposite view, that contracting does not<br />
result in cost savings. How can this be understood? And what further evidence exists in<br />
relation to this question?<br />
It can be argued that a contractor can generate cost saving by, among other things:<br />
cutting staff through mechanization<br />
offering more training opportunities<br />
improving energy efficiency<br />
economies of scale in purchasing<br />
Savings in these areas would clearly lower the total cost of operating the utility.<br />
However, this lower cost is not what is being charged. The contracting firm has a head<br />
office which charges contract “overhead” <strong>and</strong> a profit margin. Municipal administrators<br />
indicated that the order of magnitude for these two items is around 15%. Furthermore,<br />
prudent municipalities also incur contract management <strong>and</strong> monitoring costs. Therefore,<br />
the total cost for the municipality would only be less if the cost-savings identified above<br />
exceed the contracting firm’s overhead-charge <strong>and</strong> profit margin plus the municipality’s<br />
contract management <strong>and</strong> monitoring costs. The next question is: is there a literature on<br />
cost comparison?<br />
In contrast with privatization of water supply, no systematic studies examining<br />
cost comparisons of wastewater treatment could be found. To the general question, “Can<br />
public employees compete with private ownership?” Spulber <strong>and</strong> Sabbaghi (1994)<br />
responded that in their view:<br />
“Public ownership is not inherently less efficient than private ownership, <strong>and</strong><br />
public ownership carries less risk. For utilities, inefficiency often stems from<br />
isolation from effective competition rather than ownership per se” (as quoted in<br />
Shanker <strong>and</strong> Rodman, 1996, p. 106.)
10<br />
Peterson (1994) states:<br />
“Ensuring cost-effectiveness, not just the lowest cost, requires thorough<br />
evaluation. Yet, many public entities realize cost-savings. In most contract<br />
operations, 10% to 15% of budget will be saved, <strong>and</strong> in others savings of 25% or<br />
more are reached” (pp. 59,60.)<br />
Unfortunately, for the purpose of comparison, Peterson was unable to attach<br />
magnitudes to the public sector savings he referred to. Illustrations of such savings <strong>and</strong><br />
the importance of a sense of competition can be found in Robinson (1998). In her article,<br />
Robinson profiles three large public water agencies that had answered the competitive<br />
wake-up call <strong>and</strong> are changing the way they do business. These changes resulted in<br />
public sector cost savings<br />
Peterson’s statement illustrates a fundamental methodological point. The relevant<br />
cost comparison is not one of before-<strong>and</strong>-after, but rather one of without-<strong>and</strong>-with contracting.<br />
Over time as improvements are made, cost-savings can well occur under either<br />
regime. What ultimately matters is under which regime, public sector or private sector<br />
management, are such cost-savings the largest.<br />
A very simple <strong>and</strong> crude illustration of this methodological point is found in<br />
Shaoul (1997). The numbers employed in the water industry in Engl<strong>and</strong>, <strong>and</strong> Wales in<br />
1989, just prior to privatization, were 47,810. By 1995 this number had declined, in part<br />
due to privatization, to 37,555. Efficiency gains? Perhaps. However, to put this in<br />
perspective, it should be noted that in 1981 the labor force was 62,385, almost 15,000<br />
more than in 1989. Like the private sector, the public sector had also managed to reduce<br />
the labor force substantially.<br />
Returning to our basic question whether contracting wastewater treatment will<br />
result in cost-savings, the short answer that perhaps explains the absence of systematic<br />
analysis is found in Wright, Rubin <strong>and</strong> Powers (1996). They point out that:<br />
“Fears <strong>and</strong> myths surrounding wastewater privatization are rampant these days<br />
because there isn’t a lot of objective data on its cost effectiveness.” (p.24)<br />
There is no lack of data pertaining to the United States water supply industry. We<br />
saw in Table 1 that the private sector has a market share of about 20%. A number of
11<br />
comparative efficiency studies have been conducted <strong>and</strong> published since the mid-1970’s.<br />
Donahue (1989) reviewed seven studies, listed below, <strong>and</strong> concluded:<br />
“The weight of evidence, then, favors the conclusion that there is no tendency for<br />
private water utilities to be any more productive” (p.75)<br />
Water Supply Efficiency<br />
Study<br />
Conclusion<br />
Mann <strong>and</strong> Mikesell, 1976<br />
Public more efficient<br />
Crain <strong>and</strong> Zardkoohi, 1978<br />
Private more efficient*<br />
Bruggink, 1982<br />
Public more efficient<br />
Feigenbaum <strong>and</strong> Teeples, 1983<br />
No significant difference<br />
Feigenbaul, Teeples, <strong>and</strong> Glyer, 1986<br />
No significant difference<br />
Byrners, Grosskopf, <strong>and</strong> Hayes, 1986<br />
No significant difference<br />
Teeples <strong>and</strong> Glyer, 1987<br />
No significant difference<br />
Source: Donahue (1989)<br />
Lambert, Dichen, <strong>and</strong> Raffiee, 1993<br />
No significant difference<br />
Bhattacharyya, Harris, Naraynan <strong>and</strong> Raffiee, 1995 Public more efficient on average<br />
* Due to a methodological question this finding is not supported by Bhattacharyya et al<br />
(1994.)<br />
The studies by Lambert et al (1993) <strong>and</strong> Bhattacharyya et al (1995) examine more recent<br />
data. Their findings are consistent with those of the earlier studies.<br />
IV EFFLUENT QUALITY: Public vs Private Sector Performance<br />
The goals of a firm are commonly assumed to be profit maximization <strong>and</strong>,<br />
indirectly, cost minimization. What are the goals of the public sector manager? We will<br />
skip the theoretical literature on this subject <strong>and</strong> go directly to the results of our survey of<br />
opinions. First, we will briefly examine the performance results.<br />
In Table 3 we find the performance levels of 155 municipal operations in Ontario<br />
over a six-year period, 1992 – 1997. What is striking about the results is that many plants<br />
emit even less than 25% of what the permit would allow for BOD, Suspended Solids <strong>and</strong><br />
Phosphorus. The group of plants that emits 50% or less, consists of 84% of the plant in<br />
the case of BOD, 61% in the case of Suspended Solids <strong>and</strong> 52% in the case of
12<br />
Phosphorus. These results amount to what may be labeled a substantial “voluntary over<br />
compliance.”<br />
TABLE 3<br />
COMPLIANCE OF ONTARIO MUNICIPALITIES WITH 1997<br />
STANDARDS AND GUIDELINES FOR THE PERIOD 1992 – 1997<br />
All Plants (n = 155)<br />
ACTUAL BOD SUSPENDED PHOSPHORUS OVERALL<br />
REQUIRED<br />
SOLIDS<br />
RANGE No. % No. % No. % No. %<br />
0 – 25% 67 43.2 32 20.5 18 11.6 22 14.2<br />
26 – 50% 63 40.6 69 44.5 62 40.0 83 53.5<br />
0 – 50% 130 83.8 101 65.1 80 51.6 105 67.7<br />
50 – 75% 22 14.2 35 22.6 55 35.5 38 24.5<br />
76 – 100% 3 2.0 9 5.8 9 5.8 7 4.5<br />
>100% 0 0.0 10 6.5 11 7.1 5 3.2<br />
TOTAL 155 100.0 155 100.0 155 100.0 155 100.0<br />
Why do we see consistently such excellent results? We gained some insight into<br />
this question by interviewing a number of persons who are, or had been, directly or<br />
indirectly involved in the decision making process. The offices held by the public sector<br />
decision- makers that were interviewed are listed below. The main explanations given<br />
for voluntary overcompliance are found in Table 4.<br />
Current treatment plant superintendents<br />
Recently retired treatment plant superintendents<br />
Treatment plant chemists<br />
A privatization contact supervisor (former plant superintendent)<br />
A regional water <strong>and</strong> wastewater division manager<br />
Two regional coordinators
13<br />
Table 4 VOLUNTARY OVERCOMPLIANCE: EXPLANATIONS<br />
1. “EXPECTED TO MEET THE STANDARDS ALL THE TIME”<br />
(In contrast with achieving annual <strong>and</strong> monthly averages; weekly samples to be<br />
sent to Toronto…)<br />
2. “FEAR OF LOSING JOB; ALWAYS ON THE DEFENSIVE”<br />
(If you screw up, you are on your own…”)<br />
3. ‘NOT ENOUGH CONTROL (OVER THE PROCESS) TO ALLOW FOR<br />
HIGHER NUMBERS”<br />
4. “OPERATOR PRIDE AND SATISFACTION; CONFERENCE AWARDS”<br />
5. “EXTRA COSTS RELATIVELY SMALL; NO NEED TO SAVE THE EXTRA<br />
COST”<br />
6. “AS A PUBLIC SERVANT, DO THE BEST WE CAN FOR OUR PUBLIC<br />
EVEN IF IT COSTS A LITTLE MORE”<br />
7. “OPERATE TO THE BEST CAPABILITY OF THE FACILITY”<br />
(Ontario Clean Water Agency – operating plants)<br />
8. “WE ARE DOWNSTREAM FROM OURSELVES”<br />
(Drinking water inlet – wastewater outlet; avoid odor/algae trouble)<br />
9. “TO ‘STRETCH’ TREATMENT CAPACITY”<br />
(To enable further housing <strong>and</strong> industrial development)<br />
The explanations given represent a variety of motivations. They range from<br />
playing safe (#1 - #3); to operator pride <strong>and</strong> satisfaction (#4), to serving the public<br />
interest even when this involves some additional cost (#5 - #9). By way of contrast,<br />
which of these motivations would play a role for a private sector manager? The answer is<br />
quite possibly limited to #3, “not enough control”, <strong>and</strong> #4 “operator pride <strong>and</strong><br />
satisfaction”. On the basis of this we would predict that contract operated plants will not<br />
perform nearly as well as their public sector counterparts. Is this consistent with the<br />
facts? As we see in Table 6A the answer is a clear “No”. Simply put, the degree of
14<br />
voluntary overcompliance by 73 United States contract operated plants for which we<br />
have data is about the same as that of Ontario’s public sector plants (Table 5, summary of<br />
Table 3).<br />
TABLE 5<br />
COMPLIANCE OF ONTARIO MUNICIPALITIES WITH 1997<br />
STANDARDS AND GUIDELINES FOR THE PERIOD 1992 – 1997<br />
All Plants (n = 155)<br />
ACTUAL BOD SUSP. PHOSPHORUS OVERALL<br />
REQUIRED<br />
SOLIDS<br />
RANGE % % % %<br />
0 – 25% 43.2 20.5 11.6 14.2<br />
26 – 50% 40.6 44.5 40.0 53.5<br />
0 – 50% 83.8 65.1 51.6 67.7<br />
50 – 75% 14.2 22.6 35.5 24.5<br />
76 – 100% 2.0 5.8 5.8 4.5<br />
>100% 0.0 6.5 7.1 3.2<br />
TABLE 6A<br />
COMPLIANCE OF U. S. CONTRACT OPERATE PLANTS IN 2001<br />
All Plants (n = 73)<br />
ACTUAL<br />
REQUIRED<br />
BOD<br />
(n=73)<br />
S. SOLIDS<br />
(n = 73)<br />
PHOSPHORUS<br />
(n = 11)<br />
RANGE % % %<br />
0 – 25% 33.3 36.1 18.2<br />
26 – 50% 36.2 41.7 18.2<br />
0 – 50% 69.5 77.5 36.4<br />
51 – 75% 15.9 13.9 36.4<br />
76 – 100% 11.6 5.6 27.3<br />
>100% 2.9 2.8 0
15<br />
This unexpected <strong>and</strong> rather surprising finding leads to a follow up question.<br />
About one-half of these 73 plants pass through the electricity cost (<strong>and</strong> some other costs)<br />
to the municipality. Clearly electricity costs are performance related, <strong>and</strong> one would<br />
expect that in cases where the contracting firm can pass these costs on, the performance<br />
would be better. In Table 6B, the two groups of plants, without <strong>and</strong> with pass through<br />
costs, are side-by-side. The table shows that this expectation is also not born out by the<br />
facts. Again the performance of these two sub-groups of contract operated plants is about<br />
the same. In other words, whether or not the contracting firm bears the electricity costs,<br />
etc., appears to make no difference.<br />
TABLE 6B<br />
CONTRACTS WITHOUT AND WITH PASS THROUGH COSTS<br />
ACTUAL WITH NO PASS THROUGH WITH PASS THROUGH<br />
REQUIRED COSTS (n = 37)<br />
COSTS (n = 36)<br />
BOD SUSP. SOLIDS BOD SUSP. SOLIDS<br />
RANGE % % % %<br />
0 – 25% 40.5 37 22.2 32.5<br />
26 – 50% 35 39.5 36.1 43.3<br />
0 – 50% 75.5 76.5 58.3 75.7<br />
51 – 75% 13.5 13.5 16.7 13.5<br />
76 – 100% 5.5 2.5 16.7 8.1<br />
> 100% 5.5 5.5 8.3 2.7<br />
At this point a word of caution is in order. The Ontario group of plants consists of<br />
all plants, which emit wastewater directly, or indirectly into Lake Erie or Lake Ontario.<br />
On the other h<strong>and</strong>, the group of United States plants is only a sample, <strong>and</strong> not necessarily<br />
a r<strong>and</strong>om sample. There may well be an element of self-selection among the ones who<br />
responded <strong>and</strong> the ones that did not respond to our request to complete the questionnaire.<br />
We did gain some insights regarding low level emissions from additional<br />
comments made by three contractors. One contractor put it as follows:
16<br />
“The contractor achieves the lowest discharge st<strong>and</strong>ards possible.<br />
With a sequential batch reactor design there are no additional electrical<br />
costs associated with the lower emissions. In fact, achieving lower<br />
BOD <strong>and</strong> SS levels allows the plant to lower chemical costs”<br />
The other two comments focussed on the installation of bubblers.<br />
“The contractor persuaded the City to install several energy savings<br />
projects including fine bubble diffusers. Addition of the bubblers also<br />
improved the discharge quality.”<br />
In these cases there are chemical cost savings <strong>and</strong> electrical cost savings in<br />
concert with a higher quality effluent. Unfortunately we do not know to how many cases<br />
these explanations apply.<br />
There are at least two further possible general explanations for voluntary<br />
overcompliance by contract operators.<br />
1) The incremental costs of achieving these excellent results are relatively small.<br />
2) Contractors are also public interest oriented <strong>and</strong> value the goodwill that stems<br />
from their high-level performance.<br />
In the absence of data on performance related incremental cost or what, in detail,<br />
motivates the managers of private sector firms, we are unable to determine the<br />
significance of these considerations. What is clear is that pure <strong>and</strong> simple short-run profit<br />
maximization does not appear to rule the day-to-day decision-making.<br />
A final question is what, if anything do the excellent performers have in common?<br />
Three criteria were examined: 1) volume, represented by average daily flow; 2) capacity<br />
utilization rate, <strong>and</strong> 3) relative cost of operation per million gallons a day of average daily<br />
flow. We found that at each performance level 0-25%, 26-50%, etc. there are plants of all<br />
sizes, plants with high capacity utilization rates, <strong>and</strong> there are plants whose unit costs are<br />
low, medium <strong>and</strong> high relative to the unit costs in their size class
17<br />
V SUMMARY AND CONCLUSION<br />
The main conclusions of this study can be summarized as follows:<br />
1. The privatization of the water industry in Engl<strong>and</strong> <strong>and</strong> Wales in 1989 is<br />
commonly referred to as complete privatization. Ten large regional wastewater<br />
supply <strong>and</strong> wastewater treatment firms, regulated by a national agency, were<br />
created. In Canada <strong>and</strong> the United States privatization of wastewater treatment<br />
usually takes the form of public-private partnership where service provision is<br />
contracted out for a specified number of years to a private firm. The scope for<br />
regulation is much more limited compared to under complete privatization.<br />
2. Few municipalities in Ontario engage private firms to provide water supply or<br />
wastewater treatment services. This can in part be explained by the presence of<br />
the Ontario Clean Water Agency, a public sector agency, which actively competes<br />
for contracts with private sector firms.<br />
3. Contracting for wastewater treatment is a relatively new phenomenon in Canada<br />
<strong>and</strong> the United States. Major advantages of contracting can explain why some<br />
municipalities have decided to engage the services of a private firm. Major<br />
disadvantages, on the other h<strong>and</strong>, explain why there are also municipalities that<br />
have terminated their contract or have decided not to renew.<br />
4. Whether or not contracting for wastewater treatment services results in a cost<br />
savings is unclear. Over time, <strong>and</strong> in particular in the presence of competition,<br />
both public sector management <strong>and</strong> private sector management can improve<br />
operational efficiency <strong>and</strong> generate cost-savings. Lack of objective data on costeffectiveness<br />
underlies the absence of systematic analysis,<br />
5. A number of earlier as well as two more recent studies of the United States water<br />
supply industry find no evidence to support the claim that private water utilities<br />
are more efficient than their public sector counterparts.<br />
6. The effluent quality of Ontario’s public sector plants <strong>and</strong> the sample of United<br />
States contract operated plants in this study is by-<strong>and</strong>-large excellent. Under both<br />
management regimes a large majority of plants emits less than one-half of BOD,<br />
Suspended Solids <strong>and</strong> Phosphorus allowed by the permit. Interviews with a<br />
number of public sector officials generated a list of motivations for this
18<br />
“voluntary over-compliance”. It is unclear on the other h<strong>and</strong> why the for-profit<br />
contract operated plants produced similar excellent results. If the sample of<br />
questionnaires examined in this study is reasonably representative of the<br />
population, we can be conclude that the privatization of wastewater treatment<br />
does not pose a threat to environmental quality.<br />
ACKNOWLEDGEMENTS<br />
I am grateful to Mount Allison University <strong>and</strong> George Mason University for their<br />
support of this work. I am most indebted to my friend John Seldon, alias “Mr. Sludge”,<br />
for his many insights in the workings of the wastewater treatment business, <strong>and</strong> for<br />
facilitating the interviews with public sector decision makers in Ontario. I also wish to<br />
thank Arjuman Zaidi who developed the U.S. database <strong>and</strong> assisted with the data<br />
analysis.<br />
REFERENCES<br />
Bhattacharyya, A.A., E. Parker, <strong>and</strong> K. Raffiee, 1994. “An Examination of the<br />
Effect of Ownership on the Relative Efficiency of Public <strong>and</strong> Private Water Utilities”,<br />
L<strong>and</strong> Economics 70(2), 197-209<br />
Bhattacharyya, A.A., T. R. Harris, R. Narayanan, <strong>and</strong> K. Raffiee, 1995.<br />
“Specifications <strong>and</strong> estimations of the effect of ownership on the economic efficiency of<br />
the water utilities”, Regional Science of Urban Economics 25, 759-784<br />
Donahue, J. D., 1989. The Privatization Decision: Public Ends, Private Means.<br />
New York: Basic Books, Inc.<br />
Holcombe, R. G., 1991. “Privatization of Municipal Wastewater Treatment,”<br />
Public Budgeting & Finance, Fall 2991, 28-42.<br />
Lambert, D. K., D. Dichev, <strong>and</strong> K. Raffiee, 1993. “Ownership <strong>and</strong> Sources of<br />
Inefficiency in the Provision of Water Services,” Water Resources <strong>Research</strong> 29(6), 1573-<br />
1578.<br />
Letza, S. <strong>and</strong> C. Smallman, 2001. “In Pure Water There Is A Pleasure Begrudged<br />
By None: On Ownership, Accountability And Control In A Privatized Utility,” Critical<br />
Perspectives in Accounting, 12, 65-85.
19<br />
Peterson, W. A., 1994. “Privatization at a Crossroads,” Water Environment &<br />
Technology, Nov. 1994, 56-60.<br />
Robinson, C., 1998. “Public Water Utilities Gain Competitive Advantage,”<br />
Public Works, Sept. 1998, 72-76.<br />
Shanker, A. <strong>and</strong> L. Rodman, 1996. “Public-Private Partnerships: Journal of the<br />
American Water Works Association, April 1996, 102-107.<br />
Shaoul, J., 1997. “A Critical Financial Analysis Of The Performance Of<br />
Privatized Industries: The Case Of The Water Industry In Engl<strong>and</strong> <strong>and</strong> Wales,” Critical<br />
Perspectives On Accounting, 8, 479-505.<br />
Spulber, N., <strong>and</strong> A. Sabbaghi, 1994. Economics of Water Resources: From<br />
Regulation to Privatization. Kluuer Academic Publishers, Norwell, Mass.<br />
Wright, A.G., D.K. Rubin, <strong>and</strong> M. B. Powers, 1996. “Controlling Interests: U.S.<br />
Wastewater Treatment Plants Provoke Public-Private Rivalry”, Engineering News<br />
Record, Sept. 23, 1996, 24-28.