

Loss characterization in rhodamine 6G.pdf
Loss characterization in rhodamine 6G.pdf
Loss characterization in rhodamine 6G.pdf

You also want an ePaper? Increase the reach of your titles
YUMPU automatically turns print PDFs into web optimized ePapers that Google loves.
<strong>Loss</strong> <strong>characterization</strong> <strong>in</strong> rhodam<strong>in</strong>e <strong>6G</strong> doped polymer film waveguide by side illum<strong>in</strong>ation fluorescence<br />
(a)<br />
(b)<br />
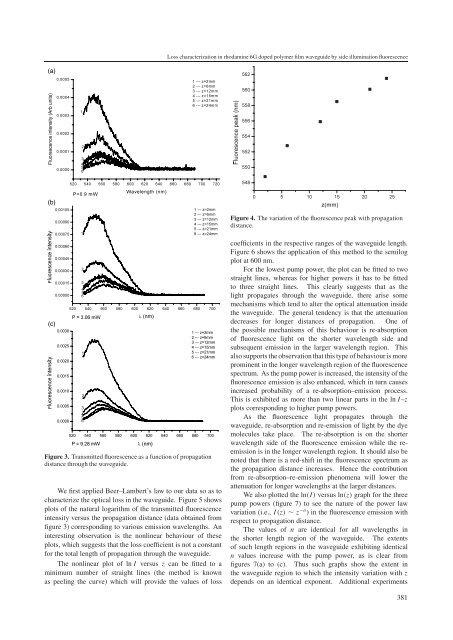
Figure 4. The variation of the fluorescence peak with propagation<br />
distance.<br />
(c)<br />
Figure 3. Transmitted fluorescence as a function of propagation<br />
distance through the waveguide.<br />
We first applied Beer–Lambert’s law toour data so as to<br />
characterize the optical loss <strong>in</strong> the waveguide. Figure 5 shows<br />
plots ofthe natural logarithm of the transmitted fluorescence<br />
<strong>in</strong>tensity versus the propagation distance (data obta<strong>in</strong>ed from<br />
figure 3) correspond<strong>in</strong>g to various emission wavelengths. An<br />
<strong>in</strong>terest<strong>in</strong>g observation is the nonl<strong>in</strong>ear behaviour of these<br />
plots, which suggests that the loss coefficient is not a constant<br />
for the total length of propagation through the waveguide.<br />
The nonl<strong>in</strong>ear plot of ln I versus z can be fitted to a<br />
m<strong>in</strong>imum number of straight l<strong>in</strong>es (the method is known<br />
as peel<strong>in</strong>g the curve) which will provide the values of loss<br />
coefficients <strong>in</strong> the respective ranges of the waveguide length.<br />
Figure 6 shows the application of this method to the semilog<br />
plot at 600 nm.<br />
For the lowest pump power, the plot can be fitted to two<br />
straight l<strong>in</strong>es, whereas for higher powers it has to be fitted<br />
to three straight l<strong>in</strong>es. This clearly suggests that as the<br />
light propagates through the waveguide, there arise some<br />
mechanisms which tend to alter the optical attenuation <strong>in</strong>side<br />
the waveguide. The general tendency is that the attenuation<br />
decreases for longer distances of propagation. One of<br />
the possible mechanisms of this behaviour is re-absorption<br />
of fluorescence light on the shorter wavelength side and<br />
subsequent emission <strong>in</strong> the larger wavelength region. This<br />
also supports the observation that this type of behaviour is more<br />
prom<strong>in</strong>ent <strong>in</strong> the longer wavelength region of the fluorescence<br />
spectrum. As the pump power is <strong>in</strong>creased, the <strong>in</strong>tensity of the<br />
fluorescence emission is also enhanced, which <strong>in</strong> turn causes<br />
<strong>in</strong>creased probability of a re-absorption–emission process.<br />
This is exhibited as more than two l<strong>in</strong>ear parts <strong>in</strong> the ln I–z<br />
plots correspond<strong>in</strong>g to higher pump powers.<br />
As the fluorescence light propagates through the<br />
waveguide, re-absorption and re-emission of light by the dye<br />
molecules take place. The re-absorption is on the shorter<br />
wavelength side of the fluorescence emission while the reemission<br />
is <strong>in</strong> the longer wavelength region. It should also be<br />
noted that there is a red-shift <strong>in</strong> the fluorescence spectrum as<br />
the propagation distance <strong>in</strong>creases. Hence the contribution<br />
from re-absorption–re-emission phenomena will lower the<br />
attenuation for longer wavelengths at the larger distances.<br />
We also plotted the ln(I) versus ln(z) graph for the three<br />
pump powers (figure 7) to see the nature of the power law<br />
variation (i.e., I (z) ∼ z −n )<strong>in</strong>thefluorescence emission with<br />
respect to propagation distance.<br />
The values of n are identical for all wavelengths <strong>in</strong><br />
the shorter length region of the waveguide. The extents<br />
of such length regions <strong>in</strong> the waveguide exhibit<strong>in</strong>g identical<br />
n values <strong>in</strong>crease with the pump power, as is clear from<br />
figures 7(a) to (c). Thus such graphs show the extent <strong>in</strong><br />
the waveguide region to which the <strong>in</strong>tensity variation with z<br />
depends on an identical exponent. Additional experiments<br />
381


