Meyniana
Meyniana
Meyniana

You also want an ePaper? Increase the reach of your titles
YUMPU automatically turns print PDFs into web optimized ePapers that Google loves.
Sediment dynamics and hydrodynamics...... 121<br />
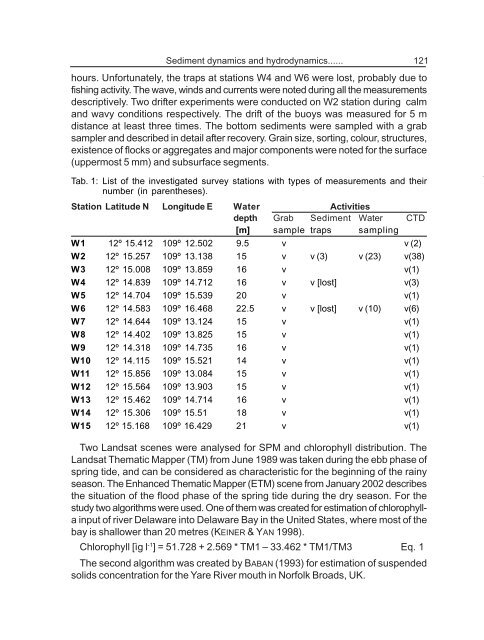
hours. Unfortunately, the traps at stations W4 and W6 were lost, probably due to<br />
fishing activity. The wave, winds and currents were noted during all the measurements<br />
descriptively. Two drifter experiments were conducted on W2 station during calm<br />
and wavy conditions respectively. The drift of the buoys was measured for 5 m<br />
distance at least three times. The bottom sediments were sampled with a grab<br />
sampler and described in detail after recovery. Grain size, sorting, colour, structures,<br />
existence of flocks or aggregates and major components were noted for the surface<br />
(uppermost 5 mm) and subsurface segments.<br />
Tab. 1: List of the investigated survey stations with types of measurements and their<br />
number (in parentheses).<br />
Station Latitude N Longitude E Water Activities<br />
depth Grab Sediment Water CTD<br />
[m] sample traps sampling<br />
W1 12º 15.412 109º 12.502 9.5 v v (2)<br />
W2 12º 15.257 109º 13.138 15 v v (3) v (23) v(38)<br />
W3 12º 15.008 109º 13.859 16 v v(1)<br />
W4 12º 14.839 109º 14.712 16 v v [lost] v(3)<br />
W5 12º 14.704 109º 15.539 20 v v(1)<br />
W6 12º 14.583 109º 16.468 22.5 v v [lost] v (10) v(6)<br />
W7 12º 14.644 109º 13.124 15 v v(1)<br />
W8 12º 14.402 109º 13.825 15 v v(1)<br />
W9 12º 14.318 109º 14.735 16 v v(1)<br />
W10 12º 14.115 109º 15.521 14 v v(1)<br />
W11 12º 15.856 109º 13.084 15 v v(1)<br />
W12 12º 15.564 109º 13.903 15 v v(1)<br />
W13 12º 15.462 109º 14.714 16 v v(1)<br />
W14 12º 15.306 109º 15.51 18 v v(1)<br />
W15 12º 15.168 109º 16.429 21 v v(1)<br />
Two Landsat scenes were analysed for SPM and chlorophyll distribution. The<br />
Landsat Thematic Mapper (TM) from June 1989 was taken during the ebb phase of<br />
spring tide, and can be considered as characteristic for the beginning of the rainy<br />
season. The Enhanced Thematic Mapper (ETM) scene from January 2002 describes<br />
the situation of the flood phase of the spring tide during the dry season. For the<br />
study two algorithms were used. One of them was created for estimation of chlorophylla<br />
input of river Delaware into Delaware Bay in the United States, where most of the<br />
bay is shallower than 20 metres (KEINER & YAN 1998).<br />
Chlorophyll [ìg l -1 ] = 51.728 + 2.569 * TM1 – 33.462 * TM1/TM3 Eq. 1<br />
The second algorithm was created by BABAN (1993) for estimation of suspended<br />
solids concentration for the Yare River mouth in Norfolk Broads, UK.