The Art of Political Science: Spatial Diagrams as Iconic and Revelatory
The Art of Political Science: Spatial Diagrams as Iconic and Revelatory
The Art of Political Science: Spatial Diagrams as Iconic and Revelatory

Create successful ePaper yourself
Turn your PDF publications into a flip-book with our unique Google optimized e-Paper software.
APSA Presidential Address |<br />
<strong>The</strong> <strong>Art</strong> <strong>of</strong> <strong>Political</strong> <strong>Science</strong><br />
answers to a number <strong>of</strong> questions using a simple scaling<br />
method—factor analysis.<br />
Is this picture a better or worse way to think about<br />
American politics than the picture with income <strong>and</strong> religious<br />
attendance? Of course there are re<strong>as</strong>ons to believe<br />
that moral conservatism is related to church attendance<br />
<strong>and</strong> that economic conservatism is related to household<br />
income, but which one, the issue dimension or the sociodemographic<br />
dimension, really gets at the heart <strong>of</strong> American<br />
politics? And are these the right two dimensions?<br />
Let’s start by <strong>as</strong>king whether these are the right issue<br />
dimensions. Many writers agree that the major issue dimensions<br />
today in American politics are economic issues <strong>and</strong><br />
social/cultural/moral issues, but only episodically foreign<br />
policy. 44 Foreign policy can be set <strong>as</strong>ide for a number <strong>of</strong><br />
re<strong>as</strong>ons, such <strong>as</strong> its “elite” nature, the lack <strong>of</strong> clear-cut<br />
groups that have obvious <strong>and</strong> firm opinions on any given<br />
foreign policy issue, 45 its overall volatility, <strong>and</strong> perhaps<br />
even its relationship to social/cultural/moral issues. 46<br />
We can see the importance <strong>of</strong> the first two major issue<br />
cleavages <strong>as</strong> far back <strong>as</strong> 1972 using the American National<br />
Election Studies, because four relevant items have been<br />
repeated in surveys conducted since then. Two <strong>of</strong> them,<br />
the “government guaranteed jobs” question <strong>and</strong> the “government<br />
aid to blacks” question are highly correlated <strong>and</strong><br />
represent an economic dimension. Two others, on the social<br />
role <strong>of</strong> women <strong>and</strong> on abortion, are also highly correlated. 47<br />
Are these dimensions important for American politics?<br />
When we regress the cl<strong>as</strong>sic Michigan seven-point party<br />
identification scale (where 1 is “strong Democrat” <strong>and</strong> 7 is<br />
“strong Republican”) on the two issue scales from 1972 to<br />
2004, we get an R-squared <strong>of</strong> about .10, suggesting that<br />
about 10% <strong>of</strong> the variance in party identification is<br />
explained by these two dimensions. Is this a little or a lot?<br />
I think it is enough, but it does raise the question <strong>of</strong><br />
whether other dimensions should be considered.<br />
Rather than pursuing this important, but contentious,<br />
question <strong>of</strong> how fully American politics can be described in<br />
terms <strong>of</strong> these two dimensions, I will turn to whether we<br />
should focus on socio-demographic or issue dimensions.<br />
When we regress the seven-point party identification scale<br />
on the socio-demographic dimensions <strong>of</strong> household income<br />
<strong>and</strong> religious attendance, we get statistically significant, but<br />
much smaller effects, <strong>and</strong> the overall R-squared is about<br />
3%—less than one-third <strong>of</strong> what we got for issues. Indeed,<br />
there are lots <strong>of</strong> re<strong>as</strong>ons to believe that socio-demographic<br />
characteristics belong further back in the “funnel <strong>of</strong> causality”<br />
than issues, <strong>and</strong> it is not surprising to see that they are<br />
less-powerful predictors <strong>of</strong> party identification.<br />
And it seems quite possible that there can be sociodemographic<br />
differences without attitudinal differences,<br />
<strong>and</strong> there can be attitudinal differences without political<br />
differences. In the 1970s, for example, neither religious<br />
attendance nor social-moral conservatism w<strong>as</strong> significantly<br />
related to political party differences. In the spatial<br />
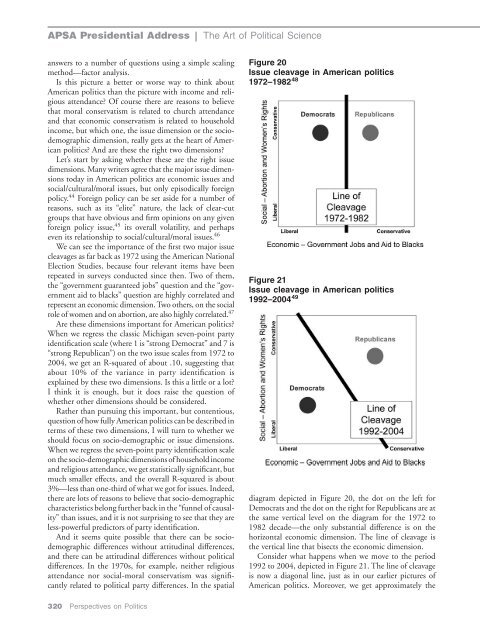
Figure 20<br />
Issue cleavage in American politics<br />
1972–1982 48<br />
Figure 21<br />
Issue cleavage in American politics<br />
1992–2004 49<br />
diagram depicted in Figure 20, the dot on the left for<br />
Democrats <strong>and</strong> the dot on the right for Republicans are at<br />
the same vertical level on the diagram for the 1972 to<br />
1982 decade—the only substantial difference is on the<br />
horizontal economic dimension. <strong>The</strong> line <strong>of</strong> cleavage is<br />
the vertical line that bisects the economic dimension.<br />
Consider what happens when we move to the period<br />
1992 to 2004, depicted in Figure 21. <strong>The</strong> line <strong>of</strong> cleavage<br />
is now a diagonal line, just <strong>as</strong> in our earlier pictures <strong>of</strong><br />
American politics. Moreover, we get approximately the<br />
320 Perspectives on Politics