Arjun Chennu, Paul Färber, Nils Volkenborn, Mohammad ... - ASLO
Arjun Chennu, Paul Färber, Nils Volkenborn, Mohammad ... - ASLO
Arjun Chennu, Paul Färber, Nils Volkenborn, Mohammad ... - ASLO

You also want an ePaper? Increase the reach of your titles
YUMPU automatically turns print PDFs into web optimized ePapers that Google loves.
<strong>Chennu</strong> et al.<br />
Hyperspectral imaging of MPB biofilms<br />
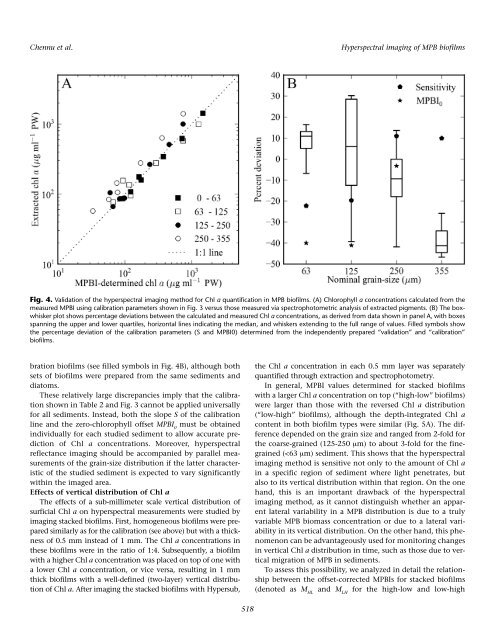
Fig. 4. Validation of the hyperspectral imaging method for Chl a quantification in MPB biofilms. (A) Chlorophyll a concentrations calculated from the<br />
measured MPBI using calibration parameters shown in Fig. 3 versus those measured via spectrophotometric analysis of extracted pigments. (B) The boxwhisker<br />
plot shows percentage deviations between the calculated and measured Chl a concentrations, as derived from data shown in panel A, with boxes<br />
spanning the upper and lower quartiles, horizontal lines indicating the median, and whiskers extending to the full range of values. Filled symbols show<br />
the percentage deviation of the calibration parameters (S and MPBI0) determined from the independently prepared “validation” and “calibration”<br />
biofilms.<br />
bration biofilms (see filled symbols in Fig. 4B), although both<br />
sets of biofilms were prepared from the same sediments and<br />
diatoms.<br />
These relatively large discrepancies imply that the calibration<br />
shown in Table 2 and Fig. 3 cannot be applied universally<br />
for all sediments. Instead, both the slope S of the calibration<br />
line and the zero-chlorophyll offset MPBI 0<br />
must be obtained<br />
individually for each studied sediment to allow accurate prediction<br />
of Chl a concentrations. Moreover, hyperspectral<br />
reflectance imaging should be accompanied by parallel measurements<br />
of the grain-size distribution if the latter characteristic<br />
of the studied sediment is expected to vary significantly<br />
within the imaged area.<br />
Effects of vertical distribution of Chl a<br />
The effects of a sub-millimeter scale vertical distribution of<br />
surficial Chl a on hyperspectral measurements were studied by<br />
imaging stacked biofilms. First, homogeneous biofilms were prepared<br />
similarly as for the calibration (see above) but with a thickness<br />
of 0.5 mm instead of 1 mm. The Chl a concentrations in<br />
these biofilms were in the ratio of 1:4. Subsequently, a biofilm<br />
with a higher Chl a concentration was placed on top of one with<br />
a lower Chl a concentration, or vice versa, resulting in 1 mm<br />
thick biofilms with a well-defined (two-layer) vertical distribution<br />
of Chl a. After imaging the stacked biofilms with Hypersub,<br />
the Chl a concentration in each 0.5 mm layer was separately<br />
quantified through extraction and spectrophotometry.<br />
In general, MPBI values determined for stacked biofilms<br />
with a larger Chl a concentration on top (“high-low” biofilms)<br />
were larger than those with the reversed Chl a distribution<br />
(“low-high” biofilms), although the depth-integrated Chl a<br />
content in both biofilm types were similar (Fig. 5A). The difference<br />
depended on the grain size and ranged from 2-fold for<br />
the coarse-grained (125-250 μm) to about 3-fold for the finegrained<br />
(