Home and community occupational therapy for children and youth: A ...
Home and community occupational therapy for children and youth: A ...
Home and community occupational therapy for children and youth: A ...

Create successful ePaper yourself
Turn your PDF publications into a flip-book with our unique Google optimized e-Paper software.
LAW ET AL.<br />
TABLE 2<br />
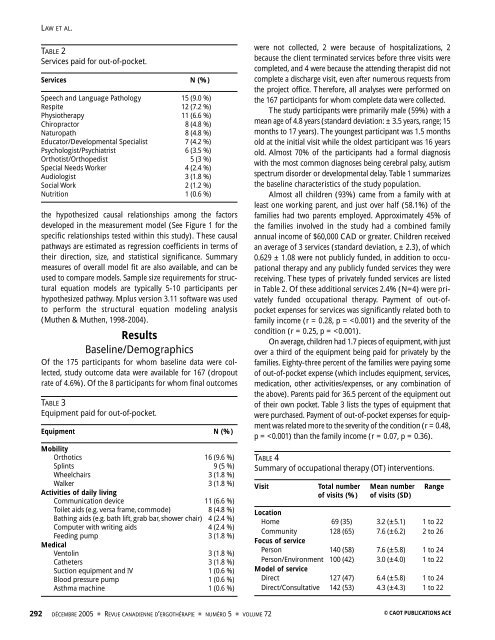
Services paid <strong>for</strong> out-of-pocket.<br />
Services N (%)<br />
Speech <strong>and</strong> Language Pathology 15 (9.0 %)<br />
Respite 12 (7.2 %)<br />
Physio<strong>therapy</strong> 11 (6.6 %)<br />
Chiropractor 8 (4.8 %)<br />
Naturopath 8 (4.8 %)<br />
Educator/Developmental Specialist 7 (4.2 %)<br />
Psychologist/Psychiatrist 6 (3.5 %)<br />
Orthotist/Orthopedist 5 (3 %)<br />
Special Needs Worker 4 (2.4 %)<br />
Audiologist 3 (1.8 %)<br />
Social Work 2 (1.2 %)<br />
Nutrition 1 (0.6 %)<br />
the hypothesized causal relationships among the factors<br />
developed in the measurement model (See Figure 1 <strong>for</strong> the<br />
specific relationships tested within this study). These causal<br />
pathways are estimated as regression coefficients in terms of<br />
their direction, size, <strong>and</strong> statistical significance. Summary<br />
measures of overall model fit are also available, <strong>and</strong> can be<br />
used to compare models. Sample size requirements <strong>for</strong> structural<br />
equation models are typically 5-10 participants per<br />
hypothesized pathway. Mplus version 3.11 software was used<br />
to per<strong>for</strong>m the structural equation modeling analysis<br />
(Muthen & Muthen, 1998-2004).<br />
Results<br />
Baseline/Demographics<br />
Of the 175 participants <strong>for</strong> whom baseline data were collected,<br />
study outcome data were available <strong>for</strong> 167 (dropout<br />
rate of 4.6%). Of the 8 participants <strong>for</strong> whom final outcomes<br />
TABLE 3<br />
Equipment paid <strong>for</strong> out-of-pocket.<br />
Equipment N (%)<br />
Mobility<br />
Orthotics 16 (9.6 %)<br />
Splints 9 (5 %)<br />
Wheelchairs 3 (1.8 %)<br />
Walker 3 (1.8 %)<br />
Activities of daily living<br />
Communication device 11 (6.6 %)<br />
Toilet aids (e.g. versa frame, commode) 8 (4.8 %)<br />
Bathing aids (e.g. bath lift, grab bar, shower chair) 4 (2.4 %)<br />
Computer with writing aids 4 (2.4 %)<br />
Feeding pump 3 (1.8 %)<br />
Medical<br />
Ventolin 3 (1.8 %)<br />
Catheters 3 (1.8 %)<br />
Suction equipment <strong>and</strong> IV 1 (0.6 %)<br />
Blood pressure pump 1 (0.6 %)<br />
Asthma machine 1 (0.6 %)<br />
were not collected, 2 were because of hospitalizations, 2<br />
because the client terminated services be<strong>for</strong>e three visits were<br />
completed, <strong>and</strong> 4 were because the attending therapist did not<br />
complete a discharge visit, even after numerous requests from<br />
the project office. There<strong>for</strong>e, all analyses were per<strong>for</strong>med on<br />
the 167 participants <strong>for</strong> whom complete data were collected.<br />
The study participants were primarily male (59%) with a<br />
mean age of 4.8 years (st<strong>and</strong>ard deviation: ± 3.5 years, range; 15<br />
months to 17 years). The youngest participant was 1.5 months<br />
old at the initial visit while the oldest participant was 16 years<br />
old. Almost 70% of the participants had a <strong>for</strong>mal diagnosis<br />
with the most common diagnoses being cerebral palsy, autism<br />
spectrum disorder or developmental delay. Table 1 summarizes<br />
the baseline characteristics of the study population.<br />
Almost all <strong>children</strong> (93%) came from a family with at<br />
least one working parent, <strong>and</strong> just over half (58.1%) of the<br />
families had two parents employed. Approximately 45% of<br />
the families involved in the study had a combined family<br />
annual income of $60,000 CAD or greater. Children received<br />
an average of 3 services (st<strong>and</strong>ard deviation, ± 2.3), of which<br />
0.629 ± 1.08 were not publicly funded, in addition to <strong>occupational</strong><br />
<strong>therapy</strong> <strong>and</strong> any publicly funded services they were<br />
receiving. These types of privately funded services are listed<br />
in Table 2. Of these additional services 2.4% (N=4) were privately<br />
funded <strong>occupational</strong> <strong>therapy</strong>. Payment of out-ofpocket<br />
expenses <strong>for</strong> services was significantly related both to<br />
family income (r = 0.28, p =