July investor presentation - John Deere
July investor presentation - John Deere
July investor presentation - John Deere

You also want an ePaper? Increase the reach of your titles
YUMPU automatically turns print PDFs into web optimized ePapers that Google loves.
<strong>John</strong> <strong>Deere</strong><br />
Committed to Those<br />
Linked to the Land<br />
Investor Presentation<br />
<strong>Deere</strong> & Company<br />
<strong>July</strong> 2013
Safe Harbor Statement & Disclosures<br />
This <strong>presentation</strong> includes forward-looking comments subject to important risks<br />
and uncertainties. It may also contain financial measures that are not in<br />
conformance with accounting principles generally accepted in the United States<br />
of America (GAAP).<br />
Refer to <strong>Deere</strong>’s reports filed on Forms 8-K (current), 10-Q (quarterly), and<br />
10-K (annual) for information on factors that could cause actual results to differ<br />
materially from information in this <strong>presentation</strong> and for information reconciling<br />
financial measures to GAAP.<br />
Guidance noted in the following slides was effective as of the company’s most<br />
recent earnings release and conference call (15 May 2013). Nothing in this<br />
<strong>presentation</strong> should be construed as reaffirming or disaffirming such guidance.<br />
This <strong>presentation</strong> is not an offer to sell or a solicitation of offers to buy any of<br />
<strong>Deere</strong>’s securities.<br />
2<br />
| <strong>Deere</strong> & Company | <strong>July</strong> 2013
Table of Contents<br />
Slide #<br />
<strong>John</strong> <strong>Deere</strong> Strategy 4<br />
Foundational Success Factors 9<br />
Global Markets and Opportunities 18<br />
<strong>John</strong> <strong>Deere</strong> Financial Services 38<br />
<strong>John</strong> <strong>Deere</strong> Power Systems 44<br />
Market Fundamentals 48<br />
Appendix 54<br />
3<br />
| <strong>Deere</strong> & Company | <strong>July</strong> 2013
<strong>John</strong> <strong>Deere</strong><br />
Strategy
*<br />
*<br />
* SVA: Shareholder Value Added<br />
5 | <strong>Deere</strong> & Company | <strong>July</strong> 2013
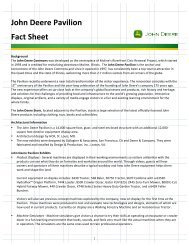
The <strong>John</strong> <strong>Deere</strong> Strategy<br />
Foundational Success Factors<br />
Exceptional Operating Performance - Equipment Operations<br />
− 29.4% OROA* in 2012<br />
35%<br />
30%<br />
25%<br />
20%<br />
15%<br />
10%<br />
2009<br />
12%<br />
2010<br />
2009, adjusted***<br />
2003<br />
2007<br />
2006<br />
20%<br />
2011<br />
2012<br />
2008<br />
2004<br />
2005<br />
28%<br />
12% OROA (SVA** Neutral)<br />
5%<br />
2002<br />
0%<br />
2001<br />
-5%<br />
80%<br />
Low<br />
100%<br />
Normal<br />
% of Normal Volume<br />
* OROA: Operating Return on Operating Assets<br />
** SVA: Shareholder Value Added<br />
*** Excludes fiscal 2009 expenses related to goodwill impairment and voluntary employee-separation, for reconciliation to GAAP see “2009 OROA*<br />
Reconciliation to GAAP” slide in Appendix.<br />
120%<br />
High<br />
6<br />
| <strong>Deere</strong> & Company | <strong>July</strong> 2013
$ Millions<br />
The <strong>John</strong> <strong>Deere</strong> Strategy<br />
Foundational Success Factors<br />
Exceptional Operating Performance - Equipment Operations<br />
− Higher Net Cash Flow, More Consistently<br />
3,500<br />
Adoption of SVA* Model<br />
3,000<br />
2,500<br />
Sale of Trade Receivables to<br />
Credit<br />
2,000<br />
1,500<br />
1,000<br />
500<br />
0<br />
1991 1992 1993 1994 1995 1996 1997 1998 1999 2000 2001 2002 2003 2004 2005 2006 2007 2008 2009 2010 2011 2012<br />
• Over $7.5 billion in Pension/OPEB contributions, 2001-2012<br />
* SVA: Shareholder Value Added<br />
7<br />
| <strong>Deere</strong> & Company | <strong>July</strong> 2013
SVA ($ millions)<br />
The <strong>John</strong> <strong>Deere</strong> Strategy<br />
Foundational Success Factors<br />
Disciplined SVA* Growth - Equipment Operations<br />
− SVA Journey, 1991 - 2012<br />
2,800<br />
2,400<br />
Adoption of SVA Model<br />
2,000<br />
1,600<br />
1,200<br />
800<br />
400<br />
0<br />
-400<br />
-800<br />
-1,200<br />
-1,600<br />
1991 1992 1993 1994 1995 1996 1997 1998 1999 2000 2001 2002 2003 2004 2005 2006 2007 2008 2009 2010 2011 2012<br />
* SVA: Shareholder Value Added<br />
Note: For reconciliation of SVA to GAAP, please see “SVA* Reconciliation to GAAP” slide in Appendix<br />
8<br />
| <strong>Deere</strong> & Company | <strong>July</strong> 2013
Foundational<br />
Success Factors<br />
Building on Core Strengths<br />
That Have Guided Our<br />
Success
$ Millions<br />
Asset Management<br />
Dramatic Reduction in Asset Intensity<br />
• Avoided ~ $7.5 billion in working capital in 2012 vs. 1998<br />
• Receivable level in 2012 consistent with 1998, with almost 3x the sales<br />
Quarterly Receivables & Inventory as a % of Previous 12 Months Sales<br />
60%<br />
$40,000<br />
Trade Receivables and Net Sales<br />
55%<br />
$35,000<br />
50%<br />
45%<br />
Prior Year<br />
Current Year<br />
$30,000<br />
$25,000<br />
40%<br />
$20,000<br />
35%<br />
$15,000<br />
30%<br />
$10,000<br />
25%<br />
$5,000<br />
20%<br />
2000 2001 2002 2003 2004 2005 2006 2007 2008 2009 2010 2011 2012 2013*<br />
$0<br />
Trade Receivables<br />
Net Sales<br />
*Through 2 nd quarter 2013<br />
1998 2012<br />
10<br />
| <strong>Deere</strong> & Company | <strong>July</strong> 2013
$ Thousands<br />
Productivity Improvement<br />
~ 6% CAGR over 30 Years<br />
• <strong>Deere</strong>’s net sales and revenues per employee have increased at a CAGR<br />
of ~ 6% over last 30 years<br />
$600<br />
Net Sales and Revenues per Employee<br />
$500<br />
$400<br />
$300<br />
$200<br />
$100<br />
$0<br />
1982 1984 1986 1988 1990 1992 1994 1996 1998 2000 2002 2004 2006 2008 2010 2012<br />
11 | <strong>Deere</strong> & Company | <strong>July</strong> 2013
Investment in New Products and Technologies<br />
$1,600<br />
$1,400<br />
$1,200<br />
$1,000<br />
$800<br />
$600<br />
$400<br />
$200<br />
$0<br />
R&D as Percent of Net Sales<br />
2000 2001 2002 2003 2004 2005 2006 2007 2008 2009 2010 2011 2012<br />
6.00%<br />
5.00%<br />
4.00%<br />
3.00%<br />
2.00%<br />
1.00%<br />
0.00%<br />
<strong>Deere</strong> R&D $ <strong>Deere</strong> % Competitor A % Competitor B % Competitor C %<br />
Source: <strong>Deere</strong> & Company and competitor SEC filings<br />
12 | <strong>Deere</strong> & Company | <strong>July</strong> 2013
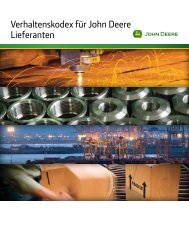
Net Sales by Product Category<br />
Equipment Operations - Fiscal Year 2012<br />
Agriculture & Turf – $27.1B<br />
Construction & Forestry – $6.4B<br />
Turf<br />
Other<br />
Commercial<br />
Worksite<br />
Products<br />
Other<br />
Large Ag<br />
Forestry<br />
Small Ag<br />
Construction<br />
13 | <strong>Deere</strong> & Company | <strong>July</strong> 2013
<strong>Deere</strong> Use-of-Cash Priorities<br />
Cash from Operations<br />
Committed to “A” Rating<br />
‣ Manage the balance sheet, including liquidity, to support a rating<br />
that provides access to low-cost and readily available short- and<br />
long-term funding mechanisms<br />
‣ Reflects the strategic nature of our financial services operation<br />
Fund Operating and Growth Needs<br />
‣ Fund value-creating investments in our businesses<br />
Common Stock Dividend<br />
‣ Consistently and moderately raise dividend targeting a 25%-<br />
35% payout ratio of mid-cycle earnings<br />
Share Repurchase<br />
‣ Consider share repurchase as a means to deploy excess cash<br />
to shareholders, once above requirements are met and<br />
repurchase is viewed as value-enhancing<br />
14 | <strong>Deere</strong> & Company | <strong>July</strong> 2013
Share Repurchase<br />
As Part of Publicly Announced Plans<br />
Cumulative cost of repurchases 2004-2Q2013:<br />
Amount remaining on May 2008 authorization of $5 billion:<br />
~ $9.5 billion<br />
~ $2.2 billion<br />
30 April 2013 period ended shares: ~ 388.0 million<br />
2Q2013 average diluted shares:<br />
Shares repurchased 2004-2Q2013:<br />
~ 3.9 million<br />
~ 164.0 million<br />
Average repurchase price 2004-2Q2013: $57.70<br />
Actual<br />
Shares<br />
Repurchased*<br />
(in millions)<br />
Total Amount**<br />
(in billions)<br />
2004 5.9 $0.2<br />
2005 27.7 $0.9<br />
2006 34.0 $1.3<br />
2007 25.7 $1.5<br />
2008 21.2 $1.7<br />
2009 0.0 $0.0<br />
2010 5.2 $0.4<br />
2011 20.8 $1.7<br />
2012 20.2 $1.6<br />
2013 YTD 3.3 $0.3<br />
* All shares adjusted for two-for-one stock split effective 26 November 2007<br />
** Rounded totals for each period – sum may not tie to cumulative cost of repurchases 2004-2Q2013<br />
15<br />
| <strong>Deere</strong> & Company | <strong>July</strong> 2013
'03 Q1<br />
Q2<br />
Q3<br />
Q4<br />
'04 Q1<br />
Q2<br />
Q3<br />
Q4<br />
'05 Q1<br />
Q2<br />
Q3<br />
Q4<br />
'06 Q1<br />
Q2<br />
Q3<br />
Q4<br />
'07 Q1<br />
Q2<br />
Q3<br />
Q4<br />
'08 Q1<br />
Q2<br />
Q3<br />
Q4<br />
'09 Q1<br />
Q2<br />
Q3<br />
Q4<br />
'10 Q1<br />
Q2<br />
Q3<br />
Q4<br />
'11 Q1<br />
Q2<br />
Q3<br />
Q4<br />
'12 Q1<br />
Q2<br />
Q3<br />
Q4<br />
'13 Q1<br />
Q2<br />
Q3<br />
<strong>Deere</strong> Quarterly Dividends Declared*<br />
Q1 2003 – Q3 2013<br />
$0.60<br />
$0.50<br />
$0.46<br />
$0.51<br />
$0.40<br />
$0.35<br />
$0.41<br />
$0.30<br />
$0.20<br />
$0.10<br />
$0.11<br />
$0.14 $0.16 $0.20<br />
$0.22<br />
$0.25<br />
$0.28<br />
$0.30<br />
Dividend raised 82%<br />
since launch of the<br />
revised <strong>John</strong> <strong>Deere</strong><br />
Strategy in 2010**<br />
$0.00<br />
* Adjusted for 2 for 1 stock split on 26 November 2007<br />
** See slide 5 for <strong>John</strong> <strong>Deere</strong> Strategy<br />
16<br />
| <strong>Deere</strong> & Company | <strong>July</strong> 2013
$ Millions<br />
Sources and Uses of Cash Fiscal 2004 - 2012<br />
Equipment Operations<br />
$27,000<br />
$24,000<br />
$668<br />
= Source of Cash<br />
= Use of Cash<br />
$21,000<br />
$6,530<br />
$18,000<br />
$1,081<br />
$101<br />
$15,000<br />
$12,000<br />
$19,326<br />
$3,967<br />
$9,000<br />
$6,000<br />
$3,000<br />
$0<br />
$4,287<br />
Beginning<br />
Cash & Cash<br />
Equivalents<br />
(10/31/03)<br />
Cash From<br />
Operations<br />
Divestitures,<br />
net of<br />
Acquisitions<br />
Capital<br />
Expenditures<br />
Investment in<br />
Financial<br />
Services<br />
Net Change in<br />
Debt and<br />
Intercompany<br />
Balances<br />
$7,720<br />
~60% of cash from operations<br />
returned to shareholders<br />
Dividends<br />
Share<br />
Repurchase,<br />
net of<br />
Common<br />
Stock<br />
Issuances<br />
(1) Other includes proceeds from maturities and sales of marketable securities and purchases of marketable securities and reconciliation for non-cash<br />
items including excess tax benefits from share-based compensation and the effect of exchange rates on cash and cash equivalents<br />
$974<br />
Other<br />
(1)<br />
$3,908<br />
Ending Cash &<br />
Cash<br />
Equivalents<br />
(10/31/12)<br />
Source: <strong>Deere</strong> & Company SEC filings<br />
17<br />
| <strong>Deere</strong> & Company | <strong>July</strong> 2013
Global Markets and<br />
Opportunities
$ Millions<br />
Growing Global Presence<br />
• FY 2012 equipment net sales outside U.S. & Canada over 4x the<br />
level in FY 2000<br />
$14,000<br />
Net Sales Outside U.S. and Canada<br />
50%<br />
$12,000<br />
45%<br />
$10,000<br />
$8,000<br />
$6,000<br />
$4,000<br />
$2,000<br />
40%<br />
35%<br />
30%<br />
25%<br />
$0<br />
2000 2001 2002 2003 2004 2005 2006 2007 2008 2009 2010 2011 2012<br />
20%<br />
Net Sales Outside U.S. & Canada<br />
% of Total Net Sales<br />
19 | <strong>Deere</strong> & Company | <strong>July</strong> 2013
Global Growth<br />
Major Equipment Factory Investments<br />
Waterloo, IA, USA<br />
A&T Division<br />
• Foundry<br />
Waterloo, IA, USA<br />
A&T Division<br />
• Ag Tractors<br />
Domodedovo, Russia<br />
A&T and C&F Division<br />
• Tractors<br />
• Combine Harvesters<br />
Orenburg, Russia<br />
A&T Division<br />
• Seeding Equipment<br />
• Tillage Equipment<br />
Valley City, ND, USA<br />
A&T Division<br />
• Seeding Equipment<br />
• Tillage Equipment<br />
Des Moines, IA, USA<br />
A&T Division<br />
• Spraying Equipment<br />
• Cotton Harvesting Equipment<br />
• Tillage Equipment<br />
• Seeding Equipment<br />
Indaiatuba, Brazil<br />
C&F Division<br />
• Backhoe Loaders<br />
• 4WD Loaders<br />
Moline, IL, USA<br />
A&T Division<br />
• Planting Equipment<br />
Moline, IL, USA<br />
Cylinder Division<br />
• Hydraulic Cylinders<br />
Davenport, IA, USA<br />
C&F Division<br />
• Articulated Dump Trucks<br />
• 4WD Loaders<br />
• Motor Graders<br />
• Skidders<br />
• Wheeled Feller Bunchers<br />
Harbin, China<br />
A&T Division<br />
• Combine Harvesters<br />
• Tractors<br />
• Sprayers<br />
• Irrigation Products<br />
Tianjin (TEDA), China<br />
C&F Division<br />
• 4WD Loaders<br />
• Excavators<br />
Tianjin (TEDA), China<br />
<strong>John</strong> <strong>Deere</strong> Power Systems<br />
• Engines<br />
Rosario, Argentina<br />
A&T Divison and<br />
<strong>John</strong> <strong>Deere</strong> Power Systems<br />
• Engines<br />
• Tractors<br />
• Combines<br />
Indaiatuba, Brazil (JV)<br />
C&F Division<br />
• Excavators<br />
Pune, India<br />
A&T Division<br />
• Engines<br />
• Transmissions<br />
• Tractors<br />
Dewas, India<br />
A&T Division<br />
• Tractors<br />
New Factories<br />
Major Expansions or Modernizations<br />
20<br />
| <strong>Deere</strong> & Company | <strong>July</strong> 2013
2007<br />
2008<br />
2009<br />
2007<br />
2010<br />
2008<br />
2011<br />
2009<br />
2012<br />
2010<br />
2011<br />
2012<br />
2007<br />
2008<br />
2009<br />
2007<br />
2010<br />
2008<br />
2011<br />
2009<br />
2012<br />
2010<br />
2011<br />
2007<br />
2012<br />
2008<br />
2007<br />
2009<br />
2008<br />
2010<br />
2009<br />
2011<br />
2010<br />
2012<br />
2011<br />
2012<br />
Net Sales by Major Markets<br />
Equipment Operations<br />
U.S. & Canada<br />
9% CAGR<br />
$15.1 $14.8<br />
$13.8<br />
$13.0<br />
$17.4<br />
$20.8<br />
Western Europe<br />
2% CAGR<br />
$3.9 $4.6 $4.4 $4.3<br />
$3.4 $3.4<br />
Central Europe & CIS<br />
11% CAGR<br />
$1.9<br />
$1.4 $1.7<br />
$1.0<br />
$0.7 $0.7<br />
Asia, Africa & Middle East<br />
21% CAGR<br />
$0.8 $1.1 $1.2<br />
$1.4<br />
$1.9 $2.1<br />
Central & South America<br />
18% CAGR<br />
$3.6 $3.6<br />
$2.6 $2.6<br />
$1.6 $1.8<br />
Australia & New Zealand<br />
20% CAGR<br />
$0.4 $0.6 $0.6 $0.6 $0.8 $1.0<br />
21<br />
| <strong>Deere</strong> & Company | <strong>July</strong> 2013
U.S. and Canada<br />
Factory Locations<br />
British Columbia, Canada<br />
• Log Loaders & Specialty Products<br />
Alberta, Canada<br />
• Remanufactured Components<br />
North Dakota, USA<br />
• Air Seeding Equipment<br />
• Electronics<br />
Wisconsin, USA<br />
• Lawn & Garden Equipment<br />
• Utility Vehicles<br />
• Golf & Turf Reel Mowers<br />
Iowa, USA<br />
• Cotton Harvesting Equipment<br />
• Planting Equipment<br />
• Spraying Equipment<br />
• Tillage Equipment<br />
• Ag Tractors<br />
• Components<br />
• Foundry<br />
• Engines<br />
• Hay & Forage Equipment<br />
• Articulated Dump Trucks<br />
• 4WD Loaders<br />
• Motor Graders<br />
• Skidders<br />
• Wheeled Feller Bunchers<br />
• Backhoes<br />
• Compact Tracked Loaders<br />
• Crawler Dozers<br />
• High-Speed Dozers<br />
• Knuckleboom Loaders<br />
• Skid Steer Loaders<br />
• Tracked Feller Bunchers<br />
• Tracked Harvesters<br />
Illinois, USA<br />
• Combine Harvesters<br />
• Headers<br />
• Planting Equipment<br />
• Hydraulic Cylinders<br />
Tennessee, USA<br />
• Lawn Tractors<br />
North Carolina, USA<br />
• Commercial Mowers<br />
• Golf & Turf Mowers<br />
• Utility Vehicles<br />
• Hydraulic Excavators<br />
Georgia, USA<br />
• Utility Tractors<br />
• Compact Utility Tractors<br />
California, USA<br />
• Satellite Receivers<br />
Kansas, USA<br />
• Power Transmission Equipment<br />
Missouri, USA<br />
• Remanufactured Components<br />
Louisiana, USA<br />
• Sugarcane Harvesting Equipment<br />
• Tractor Loaders<br />
• Scrapers<br />
• Cotton Strippers<br />
22<br />
| <strong>Deere</strong> & Company | <strong>July</strong> 2013
U.S. and Canada<br />
Growth-Related Announcements<br />
• November 2012 – $58 million investment at Moline, IL<br />
planter factory to enhance efficiency and quality<br />
Waterloo Works Capacity<br />
Expansion<br />
2008 to 2013<br />
10%<br />
• June 2012 – $47 million investment at Moline, IL<br />
cylinder operations to expand manufacturing capacity<br />
15%<br />
25%<br />
• March 2012 – Final Tier 4/Stage IV solution to combine<br />
proven EGR Interim Tier 4 platform with customized<br />
selective catalytic reduction (SCR) system<br />
2008-<br />
2010<br />
2010-<br />
2012<br />
2012-<br />
2013<br />
• March 2012 – $70 million investment at Waterloo, IA<br />
factory to expand production of large farm tractors by<br />
10%<br />
• January 2012 – Strategic agreement with MacDon to<br />
manufacture self-propelled windrowers<br />
• December 2011 – $85 million in capital improvements<br />
at Des Moines, IA factory to expand production of selfpropelled<br />
sprayers<br />
<strong>Deere</strong> & Company Forecast as of 15 May 2013<br />
23<br />
| <strong>Deere</strong> & Company | <strong>July</strong> 2013
EU 27<br />
Factory Locations<br />
Horst, The Netherlands<br />
• Spraying Equipment<br />
Zweibrücken, Germany<br />
• Combines & Forage Harvesters<br />
Saran, France<br />
• Engines<br />
Arc-les-Gray, France<br />
• Forage Equipment<br />
• Balers<br />
• Ag Loaders<br />
Joensuu, Finland<br />
• Wheel Forwarders<br />
• Wheel Harvesters<br />
• Forestry Attachments<br />
Stadtlohn, Germany<br />
• Headers<br />
Gummersbach, Germany<br />
• Walk-Behind Mowers<br />
Bruchsal, Germany<br />
• Tractor, Harvesting & Forestry Cabs<br />
Madrid, Spain<br />
• Components<br />
Mannheim, Germany<br />
• Tractors<br />
24 | <strong>Deere</strong> & Company | <strong>July</strong> 2013
EU 27<br />
Growth-Related Announcements<br />
• October 2012 – Grand opening of new Polish branch<br />
headquarters and training center<br />
• Represents a $26 million investment in the region<br />
• November 2011 – Awards received at Agritechnica 2011<br />
• 7280R – “Tractor of the Year 2012”<br />
• 6R tractor – “Machine of the Year”<br />
• Five silver medals<br />
• June 2011 – Largest new product introduction for Region 2*<br />
• Over 100 new products<br />
• 80% of large tractor and combine models new or<br />
updated<br />
• Focus on Dealer of Tomorrow strategy<br />
• May 2011 – <strong>John</strong> <strong>Deere</strong> and Kuhn Group sign strategic<br />
cooperation<br />
• Provides large square balers into Region 2* in 2012<br />
* Region 2: EU 27, CIS (including Russia), Mediterranean countries in Africa, and the Near and Middle East<br />
25<br />
| <strong>Deere</strong> & Company | <strong>July</strong> 2013
Brazil<br />
Factory Locations<br />
Catalão, Brazil<br />
• Sugarcane Harvesters<br />
• Sprayers<br />
São Paulo, Brazil (JV)<br />
• Components<br />
Indaiatuba, Brazil<br />
• Backhoe Loaders<br />
• 4WD Loaders<br />
Horizontina, Brazil<br />
• Combine Harvesters<br />
• Planters<br />
Indaiatuba, Brazil (JV)<br />
• Excavators<br />
Montenegro, Brazil<br />
• Tractors<br />
<strong>Deere</strong> & Company Forecast as of 15 May 2013<br />
Existing<br />
Under Construction<br />
26<br />
| <strong>Deere</strong> & Company | <strong>July</strong> 2013
Brazil<br />
Growth-Related Announcements<br />
• October 2011 – Two new factories in São Paulo to manufacture construction equipment<br />
• Solely-owned <strong>Deere</strong> factory<br />
• Backhoes and four-wheel-drive loaders<br />
• Partner with Hitachi in second factory<br />
• Excavators<br />
• Expect production to begin in 2014<br />
• Agriculture portfolio and dealer expansion<br />
• 50 new or updated products in 2010/2011<br />
• Dealer locations roughly doubled since 2007<br />
• Achieved about 6 points of tractor market<br />
share in 2-year period - CY 2011 and CY<br />
2012 1<br />
1<br />
Carta da Anfavea, January 2012 and January 2013<br />
<strong>Deere</strong> & Company Forecast as of 15 May 2013<br />
27 | <strong>Deere</strong> & Company | <strong>July</strong> 2013
CIS<br />
Factory Locations<br />
Orenburg, Russia<br />
• Seeding Equipment<br />
• Tillage Equipment<br />
Domodedovo, Russia<br />
• Tractors<br />
• Combine Harvesters<br />
28<br />
| <strong>Deere</strong> & Company | <strong>July</strong> 2013
CIS<br />
Growth-Related Announcements<br />
• November 2011 – Orenburg, Russia<br />
• Move existing operations to a new, larger facility<br />
• Increase available manufacturing space by ~ 600 percent<br />
• Expand product offering from four to fifteen models<br />
• Production commenced January 2013<br />
• March 2011 – Domodedovo, Russia<br />
• Double manufacturing space at the factory<br />
• Expand capacity for existing products<br />
29 | <strong>Deere</strong> & Company | <strong>July</strong> 2013
China<br />
Factory Locations<br />
Jiamusi, China<br />
• Large Combine Harvesters<br />
• Corn Pickers<br />
• Cotton Pickers<br />
Harbin, China<br />
• Combine Harvesters<br />
• Tractors (150+ hp)<br />
• Sprayers<br />
• Irrigation Products<br />
Tianjin (TEDA), China<br />
• 4WD Loaders<br />
• Excavators<br />
Tianjin (TEDA), China<br />
• Engines (50-220 hp)<br />
Tianjin (TEDA), China<br />
• Tractors (75-135 hp)<br />
• Transmissions<br />
Ningbo, China<br />
• Tractors (28-70 hp)<br />
• Small Combine Harvesters<br />
• Hydraulic Cylinders<br />
30 | <strong>Deere</strong> & Company | <strong>July</strong> 2013
China<br />
Growth-Related Announcements<br />
• May 2011 – New engine facility in Tianjin<br />
• ~ $60 million investment<br />
• Initial occupancy <strong>July</strong> 2012<br />
• Production commenced April 2013<br />
Construction Equipment<br />
Tractors &<br />
Drivetrain<br />
Engines<br />
Product<br />
Test (PV&V)<br />
• May 2011 – New factory in Harbin<br />
Office<br />
• ~ $80 million initial outlay<br />
• Production commenced November 2012<br />
• December 2010 – New construction equipment factory in Tianjin<br />
• ~ $50 million investment<br />
• Initial occupancy <strong>July</strong> 2012<br />
• Production commenced January 2013<br />
Tianjin Economic-Technological Development Area (TEDA) Site<br />
31 | <strong>Deere</strong> & Company | <strong>July</strong> 2013
India<br />
Factory Locations<br />
Sirhind, India<br />
• Combine Harvesters<br />
Pune, India<br />
• Engines<br />
• Transmissions<br />
• Tractors (36-75 hp)<br />
• Electronics<br />
Dewas, India<br />
• Tractors (36-50 hp)<br />
Gummidipoondi, India (JV)<br />
• Side-Shift Backhoes<br />
• 4WD Loaders (planned production 2014)<br />
<strong>Deere</strong> & Company Forecast as of 15 May 2013<br />
Existing<br />
Under Construction<br />
32<br />
| <strong>Deere</strong> & Company | <strong>July</strong> 2013
India<br />
Growth-Related Announcements<br />
• January 2011 – New tractor factory in Dewas and<br />
expand current tractor facility in Pune<br />
• ~ $100 million investment<br />
• Expect production in Dewas to begin in 2013<br />
• October 2010 – Ashok Leyland <strong>John</strong> <strong>Deere</strong><br />
Construction Equipment Company inauguration<br />
• Production of backhoes commenced in 2011<br />
• Four-wheel-drive loader production expected in 2014<br />
• September 2010 – New combine factory in Sirhind<br />
• Production commenced February 2012<br />
• <strong>John</strong> <strong>Deere</strong> has been the largest exporter of tractors<br />
from India for past 10 years<br />
<strong>Deere</strong> & Company Forecast as of 15 May 2013<br />
33 | <strong>Deere</strong> & Company | <strong>July</strong> 2013
Other Regions<br />
Factory Locations<br />
Kibbutz Beit Hashita, Israel<br />
• Cotton Picker Components<br />
Monterrey, Mexico<br />
• Rotary Cutters<br />
• Implements<br />
• Components<br />
Ramos, Mexico<br />
• Ag Loaders<br />
• Compact Utility Tractor Loaders<br />
• Utility Tractor Cabs<br />
• Hydraulic Cylinders<br />
Torreon, Mexico<br />
• Axles<br />
• Engines<br />
• Electronics<br />
Saltillo, Mexico<br />
• Ag Tractors<br />
• Transaxles<br />
Tokoroa, New Zealand<br />
• Forestry Harvester Heads<br />
Rosario, Argentina<br />
• Engines<br />
• Tractors<br />
• Combines<br />
Richards Bay, South Africa<br />
• Articulated Dump Trucks<br />
• Loaders<br />
34<br />
| <strong>Deere</strong> & Company | <strong>July</strong> 2013
Worldwide Parts Services<br />
Supporting the Global Growth of Our Equipment Operations<br />
Highlights:<br />
● Nagpur, India<br />
Announced India Parts Distribution Center… target to open in 2H 2014<br />
● Johannesburg, South Africa<br />
New, larger Regional Distribution Center opened 4Q 2012<br />
● Rosario, Argentina<br />
New, larger Regional Distribution Center opened 4Q 2012<br />
● Stockholm, Sweden<br />
New, larger Regional Distribution Center serving C&F and A&T opened May 2012<br />
● Bruchsal, Germany<br />
E-PDC deconsolidation & packaging facility opened Nov 2011<br />
Anchor Parts Distribution Centers<br />
Regional Parts Distribution Centers<br />
or Depots<br />
Distribution Centers under<br />
construction<br />
35<br />
| <strong>Deere</strong> & Company | <strong>July</strong> 2013
<strong>John</strong> <strong>Deere</strong> FarmSight TM<br />
Integrated wireless technology linking the equipment, managers, operators, dealers, and<br />
agricultural consultants to provide more productivity and efficiency to a farm or business.<br />
● Machine Optimization<br />
● Solutions that get the most out of machinery<br />
● Use of automation and machine sensors<br />
● Increased machine uptime, and higher levels of machine<br />
productivity, including the impact machines have on crop<br />
productivity & input efficiency<br />
● Logistics Optimization<br />
● Coordination of field activities and resources<br />
● Enable fleet management decisions from web enabled devices<br />
● Machine-to-machine communication for in-field logistics<br />
● Ag Decision Support<br />
● Easy data flow between machines and trusted advisors<br />
● Platform for secure, trusted data sharing<br />
● Enable proactive management decisions through insights<br />
36<br />
| <strong>Deere</strong> & Company | <strong>July</strong> 2013
<strong>John</strong> <strong>Deere</strong> Water<br />
Leveraging our leadership in global agriculture to provide innovative and efficient<br />
agricultural water management solutions to enable higher crop yields<br />
● Innovative solutions<br />
● A leading producer of drip tape/lines worldwide<br />
● Fully integrated Field Connect soil sensing system<br />
● Tailored flow/spacing solutions for unique crop/field types<br />
● Integration of machinery and technology<br />
● Field Connect provides agronomic decision support<br />
which provides insight into key soil and crop requirements<br />
(plant, spray, harvest)<br />
● Field Connect soil information designed to work in<br />
concert with <strong>Deere</strong>’s on-farm eco-system<br />
● Enables increased yields and higher quality crops<br />
● Improves water use efficiency and reduces grower input<br />
costs<br />
● Partnering with our customers<br />
● Supported by our dedicated channel partners<br />
● Focused on optimizing farm operations and crop output<br />
● Enabling good stewardship of the environment and water<br />
resources<br />
37<br />
| <strong>Deere</strong> & Company | <strong>July</strong> 2013
<strong>John</strong> <strong>Deere</strong><br />
Financial Services
<strong>John</strong> <strong>Deere</strong> Financial Services<br />
Supporting the Global Growth of Our Equipment Operations<br />
• New JDF operations:<br />
• Russia (2012)<br />
• India (2012)<br />
• Chile (2012)<br />
• Thailand (2012)<br />
• China (2011)<br />
• Expanding EU-27 coverage<br />
to majority of countries<br />
<strong>Deere</strong> & Company Forecast as of 15 May 2013<br />
Owned Operations<br />
Bank/Finance Company Partners<br />
Retail programs through JDF not currently offered<br />
39<br />
| <strong>Deere</strong> & Company | <strong>July</strong> 2013
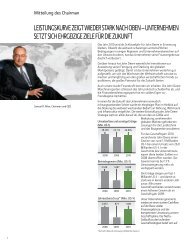
<strong>John</strong> <strong>Deere</strong> Financial Services<br />
$31.9 Billion Owned Portfolio at 31 October 2012<br />
Portfolio Composition by<br />
Market<br />
Portfolio Composition by<br />
Geography<br />
Portfolio Composition by<br />
Product<br />
C&F<br />
13%<br />
Latin America<br />
6%<br />
Europe<br />
7%<br />
Australia<br />
3%<br />
Leasing<br />
12%<br />
Revolving<br />
Credit<br />
8%<br />
Canada<br />
12%<br />
Ag & Turf<br />
87%<br />
U.S.<br />
72%<br />
Wholesale /<br />
Floorplan<br />
23%<br />
Installment<br />
Financing<br />
57%<br />
Information above includes all <strong>Deere</strong> lending activities worldwide. <strong>John</strong> <strong>Deere</strong> Capital Corporation is the largest lending operation of <strong>Deere</strong> & Company.<br />
40<br />
| <strong>Deere</strong> & Company | <strong>July</strong> 2013
<strong>John</strong> <strong>Deere</strong> Capital Corporation<br />
Profitability and Growth<br />
Net Income ($ Millions)<br />
275<br />
291<br />
311<br />
282<br />
319<br />
364<br />
383<br />
149<br />
2005 2006 2007 2008 2009 2010 2011 2012<br />
Administered Portfolio Growth ($ Billions)<br />
26.6<br />
23.3<br />
21.1<br />
17.7 18.6 19.0 19.1 19.3<br />
Write-offs/Average Owned Portfolio<br />
0.70%<br />
0.16%<br />
0.22%<br />
0.29%<br />
0.33%<br />
0.48%<br />
0.12% 0.05%<br />
2005 2006 2007 2008 2009 2010 2011 2012<br />
2005 2006 2007 2008 2009 2010 2011 2012<br />
41<br />
| <strong>Deere</strong> & Company | <strong>July</strong> 2013
<strong>John</strong> <strong>Deere</strong> Capital Corporation Retail Notes<br />
60+ Days Past Due vs. Write-offs<br />
Agriculture & Turf 1<br />
• Continued extremely low write-offs<br />
• Average write-offs less than 5 bps over last<br />
10 years<br />
Construction & Forestry<br />
• Extremely low write-offs in<br />
2012<br />
• Steady decline in write-offs<br />
since 2009<br />
3.95%<br />
3.45%<br />
2.95%<br />
2.45%<br />
1.95%<br />
1.45%<br />
0.95%<br />
0.45%<br />
3.95%<br />
3.45%<br />
2.95%<br />
2.45%<br />
1.95%<br />
1.45%<br />
0.95%<br />
0.45%<br />
-0.05%<br />
'83 '86 '89 '92 '95 '98 '01 '04 '07 '10<br />
Net Write-offs (Ag)<br />
Installments 60+DPD (Ag)<br />
-0.05%<br />
'95 '98 '01 '04 '07 '10<br />
Net Write-offs (C&F) Installments 60+DPD (C&F)<br />
(1) 1982 – 1985 includes Construction; 1986 - 1994 includes Lawn & Grounds Care; beginning in 2009 includes both Ag and Turf equipment; As %<br />
of Owned Losses After Dealer Reserve Charges<br />
Source: 1982 – 1994 internal reporting, 1995 - 2011 JDCC 10-K filings, 2012 internal reporting<br />
42<br />
| <strong>Deere</strong> & Company | <strong>July</strong> 2013
Resale Value as a % of Original List Price<br />
Resale Value as a % of Original List Price<br />
U.S. Resale Value vs. Loan Balance<br />
7230R Tractor and S660 Combine<br />
7230R Tractor (1)<br />
110%<br />
100%<br />
90%<br />
S660 Combine (2)<br />
110%<br />
100%<br />
90%<br />
80%<br />
80%<br />
70%<br />
70%<br />
60%<br />
60%<br />
50%<br />
50%<br />
40%<br />
40%<br />
30%<br />
20%<br />
Loan Balance<br />
30%<br />
20%<br />
Loan Balance<br />
10%<br />
10%<br />
0%<br />
Year 0 Year 1 Year 2 Year 3 Year 4 Year 5 Year 6<br />
Time Since Origination<br />
Model Year<br />
0%<br />
Year 0 Year 1 Year 2 Year 3 Year 4 Year 5 Year 6<br />
Time Since Origination<br />
Model Year<br />
2011 2010 2009 2008 2007 2006<br />
2011 2010 2009 2008 2007 2006<br />
(1) In 2011, the 7230R was introduced and replaced the 7830 series. In 2007, the 7830 series was introduced to the market replacing the<br />
7820. Loan balance assumes a 30% down payment on the highest list price financed for 5 years with annual payments at a rate of 6.50%.<br />
(2) Model S660 replaced model 9670 in 2012. Model 9670 replaced Model 9660 in 2006. Loan balance assumes a 30% down payment on the<br />
highest list price financed for 5 years with annual payments at a rate of 6.50%.<br />
Source for equipment values: North American Equipment Dealers Association – wholesale prices<br />
43<br />
| <strong>Deere</strong> & Company | <strong>July</strong> 2013
<strong>John</strong> <strong>Deere</strong><br />
Power Systems<br />
Engine Emissions and<br />
Technology
Engine Emissions<br />
Interim Tier 4<br />
Successful Transition<br />
• Integrated vehicle solution<br />
• Meeting customer performance and reliability<br />
requirements<br />
• Nearly 60 applications launched*<br />
• More than 40,000 engines in the field with<br />
>15 million customer hours*<br />
• Warranty claims on 9.0L engine 33% lower<br />
compared to Tier 3<br />
• Fuel economy 1-5% better than competitive<br />
equipment on tractors with 9.0L engine**<br />
• * As of 31 October 2012<br />
•** Per Nebraska Tractor Test Laboratory results<br />
45<br />
| <strong>Deere</strong> & Company | <strong>July</strong> 2013
Engine Emissions<br />
Final Tier 4<br />
iT4 success gives confidence in our ability to meet FT4 challenges<br />
• Challenge to absorb costs of continuing<br />
new emissions technologies<br />
• SCR introduces packaging and other new<br />
challenges<br />
• DEF freezing can be a concern in colder<br />
climates<br />
• Shorter implementation horizon than iT4<br />
• More applications to transition to FT4<br />
than past programs<br />
• Maintain Tier 2 and Tier 3 solutions for<br />
global markets<br />
46<br />
| <strong>Deere</strong> & Company | <strong>July</strong> 2013
Engine Emissions<br />
Worldwide Emissions Regulations<br />
U.S. and Canada<br />
Transition to Stage IV/Final Tier 4<br />
• > 175 hp: Jan 2014<br />
• < 175 hp: Jan 2015<br />
EU27*<br />
Transition to Stage IV/Final Tier 4<br />
• > 175 hp: Jan 2014<br />
• < 175 hp: Oct 2014<br />
Russia<br />
Proposed transition to Stage IIIA<br />
Jan 2014<br />
China<br />
Proposed transition to Stage IIIA<br />
Jan 2015<br />
2013 Emissions Regulations<br />
None<br />
Stage II<br />
Stage IIIA/Tier 3<br />
Stage IIIB/Interim Tier 4<br />
Brazil<br />
Proposed transition to Stage IIIA:<br />
• Construction Equipment: Jan 2015<br />
• Ag Equipment: Jan 2017<br />
India<br />
No set date to transition from<br />
Stage IIIA<br />
* Includes some non-EU27 countries that follow EU27 emissions regulations<br />
47<br />
| <strong>Deere</strong> & Company | <strong>July</strong> 2013
Market Fundamentals
$ Billions<br />
U.S. Farm Cash Receipts<br />
Total cash receipts remain at historically high levels<br />
$450<br />
$400<br />
$350<br />
$300<br />
$250<br />
$200<br />
$150<br />
$100<br />
$50<br />
$0<br />
1998 1999 2000 2001 2002 2003 2004 2005 2006 2007 2008 2009 2010 2011 2012F 2013F<br />
Government Payments<br />
Total Cash Receipts<br />
Source: 1998 – 2011: USDA 11 February 2013<br />
2012F – 2013F: <strong>Deere</strong> & Company Forecast as of 15 May 2013<br />
49<br />
| <strong>Deere</strong> & Company | <strong>July</strong> 2013
$ Billions<br />
1970<br />
1971<br />
1972<br />
1973<br />
1974<br />
1975<br />
1976<br />
1977<br />
1978<br />
1979<br />
1980<br />
1981<br />
1982<br />
1983<br />
1984<br />
1985<br />
1986<br />
1987<br />
1988<br />
1989<br />
1990<br />
1991<br />
1992<br />
1993<br />
1994<br />
1995<br />
1996<br />
1997<br />
1998<br />
1999<br />
2000<br />
2001<br />
2002<br />
2003<br />
2004<br />
2005<br />
2006<br />
2007<br />
2008<br />
2009<br />
2010<br />
2011<br />
2012F<br />
2013F<br />
U.S. Farm Balance Sheet Strong<br />
$3,000<br />
30%<br />
28%<br />
$2,500<br />
26%<br />
$2,000<br />
24%<br />
22%<br />
$1,500<br />
20%<br />
18%<br />
$1,000<br />
16%<br />
$500<br />
14%<br />
12%<br />
$0<br />
10%<br />
Farm Debt Farm Equity Debt to Equity Ratio (%) Debt to Asset Ratio (%)<br />
Source: 1970 – 2011: USDA 11 February 2013<br />
2012F – 2013F: <strong>Deere</strong> & Company Forecast as of 15 May 2013<br />
50<br />
| <strong>Deere</strong> & Company | <strong>July</strong> 2013
1992<br />
1993<br />
1994<br />
1995<br />
1996<br />
1997<br />
1998<br />
1999<br />
2000<br />
2001<br />
2002<br />
2003<br />
2004<br />
2005<br />
2006<br />
2007<br />
2008<br />
2009<br />
2010<br />
2011<br />
2012E<br />
2013P<br />
World Farm Fundamentals<br />
Global Stocks-To-Use Ratios<br />
90%<br />
80%<br />
70%<br />
60%<br />
Cotton<br />
50%<br />
40%<br />
30%<br />
20%<br />
10%<br />
Wheat<br />
Corn<br />
Soybeans<br />
0%<br />
Source: USDA - 11 <strong>July</strong> 2013<br />
51<br />
| <strong>Deere</strong> & Company | <strong>July</strong> 2013
1960<br />
1961<br />
1962<br />
1963<br />
1964<br />
1965<br />
1966<br />
1967<br />
1968<br />
1969<br />
1970<br />
1971<br />
1972<br />
1973<br />
1974<br />
1975<br />
1976<br />
1977<br />
1978<br />
1979<br />
1980<br />
1981<br />
1982<br />
1983<br />
1984<br />
1985<br />
1986<br />
1987<br />
1988<br />
1989<br />
1990<br />
1991<br />
1992<br />
1993<br />
1994<br />
1995<br />
1996<br />
1997<br />
1998<br />
1999<br />
2000<br />
2001<br />
2002<br />
2003<br />
2004<br />
2005<br />
2006<br />
2007<br />
2008<br />
2009<br />
2010<br />
2011<br />
2012F<br />
2013F<br />
U.S. Housing Starts<br />
2.500<br />
Housing Starts (Millions of Units)<br />
2.250<br />
2.000<br />
1.750<br />
1.500<br />
1.250<br />
1.000<br />
0.750<br />
0.500<br />
0.250<br />
0.000<br />
Multi-Family Housing Starts<br />
Single-Family Housing Starts<br />
Source: 1960 – 2011: U.S. Census Bureau December 2012<br />
2012F – 2013F: <strong>Deere</strong> & Company Forecast as of 15 May 2013<br />
52<br />
| <strong>Deere</strong> & Company | <strong>July</strong> 2013
Billions, 2005 Chained $’s<br />
1995<br />
1996<br />
1997<br />
1998<br />
1999<br />
2000<br />
2001<br />
2002<br />
2003<br />
2004<br />
2005<br />
2006<br />
2007<br />
2008<br />
2009<br />
2010<br />
2011<br />
2012F<br />
2013F<br />
U.S. Construction Spending<br />
2,300<br />
2,200<br />
2,100<br />
2,000<br />
1,900<br />
1,800<br />
1,700<br />
1,600<br />
1,500<br />
1,400<br />
1,300<br />
1,200<br />
1,100<br />
1,000<br />
900<br />
800<br />
700<br />
600<br />
500<br />
400<br />
300<br />
200<br />
100<br />
0<br />
U.S. Construction Spending (Billions, 2005 Chained $’s)<br />
Residential Investment in Structures<br />
Nonresidential Investment in Structures<br />
Government Investment in Structures<br />
Government Infrastructure Investment<br />
70%<br />
60%<br />
50%<br />
40%<br />
30%<br />
20%<br />
10%<br />
0%<br />
-10%<br />
-20%<br />
-30%<br />
-40%<br />
-50%<br />
-60%<br />
-70%<br />
-80%<br />
-90%<br />
-100%<br />
-110%<br />
-120%<br />
-130%<br />
-140%<br />
-150%<br />
-160%<br />
% Total Construction Spend<br />
Source: 1995 – 2011: U.S. Bureau of Economic Analysis December 2012<br />
2012F – 2013F: <strong>Deere</strong> & Company Forecast as of 15 May 2013<br />
53<br />
| <strong>Deere</strong> & Company | <strong>July</strong> 2013
Appendix
2009 OROA* Reconciliation to GAAP<br />
Equipment Operations<br />
(millions of dollars unless stated otherwise)<br />
Equipment Operations<br />
2009, as<br />
Reported<br />
Exclude Goodwill<br />
Impairment &<br />
Voluntary Employee-<br />
Separation<br />
2009, as<br />
Adjusted<br />
Net Sales 20,756 20,756<br />
Average Identifiable Assets<br />
With Inventories at LIFO 9,647 9,647<br />
With Inventories at Standard Cost 10,950 10,950<br />
Operating Profit 1,365 380 1,745<br />
Percent of Net Sales 6.6% 8.4%<br />
Operating Return on Assets<br />
With Inventories at LIFO 14.1% 18.1%<br />
With Inventories at Standard Cost 12.5% 15.9%<br />
* OROA: Operating Return on Operating Assets<br />
55<br />
| <strong>Deere</strong> & Company | <strong>July</strong> 2013
SVA* Reconciliation to GAAP<br />
Equipment Operations<br />
(millions of dollars unless stated otherwise)<br />
Equipment Operations 1991 1992 1993 1994 1995 1996 1997 1998 1999 2000 2001<br />
Net Sales 5,848 5,723 6,479 7,663 8,830 9,640 11,082 11,926 9,701 11,169 11,077<br />
Average Identifiable Assets<br />
With Inventories at LIFO 5,585 5,765 5,449 5,551 6,187 6,502 6,682 7,672 7,724 8,069 8,743<br />
With Inventories at Standard Cost 6,702 6,846 6,442 6,494 7,131 7,488 7,703 8,711 8,739 9,039 9,678<br />
Operating Profit 16 77 242 847 1,006 1,125 1,402 1,476 272 693 (46)<br />
Percent of Net Sales 0.3% 1.3% 3.7% 11.1% 11.4% 11.7% 12.6% 12.4% 2.8% 6.2% -0.4%<br />
Operating Return on Assets<br />
With Inventories at LIFO 0.3% 1.3% 4.4% 15.3% 16.3% 17.3% 21.0% 19.3% 3.5% 8.6% -0.5%<br />
With Inventories at Standard Cost 0.2% 1.1% 3.8% 13.0% 14.1% 15.0% 18.2% 16.9% 3.1% 7.7% -0.5%<br />
SVA Cost of Assets (804) (821) (773) (780) (856) (898) (924) (1,045) (1,049) (1,085) (1,162)<br />
SVA (788) (744) (531) 67 150 227 477 431 (776) (392) (1,208)<br />
Equipment Operations 2002 2003 2004 2005 2006 2007 2008 2009 2010 2011 2012<br />
Net Sales 11,703 13,349 17,673 19,401 19,884 21,489 25,803 20,756 23,573 29,466 33,501<br />
Average Identifiable Assets<br />
With Inventories at LIFO 6,229 5,965 6,482 7,248 7,546 8,092 9,652 9,647 9,196 11,516 13,594<br />
With Inventories at Standard Cost 7,147 6,925 7,477 8,312 8,634 9,205 10,812 10,950 10,494 12,875 14,965<br />
Operating Profit 401 708 1,905 1,842 1,905 2,318 2,927 1,365 2,909 3,839 4,397<br />
Percent of Net Sales 3.4% 5.3% 10.8% 9.5% 9.6% 10.8% 11.3% 6.6% 12.3% 13.0% 13.1%<br />
Operating Return on Assets<br />
With Inventories at LIFO 6.4% 11.9% 29.4% 25.4% 25.2% 28.6% 30.3% 14.1% 31.6% 33.3% 32.3%<br />
With Inventories at Standard Cost 5.6% 10.2% 25.5% 22.2% 22.1% 25.2% 27.1% 12.5% 27.7% 29.8% 29.4%<br />
SVA Cost of Assets (858) (831) (897) (998) (1,036) (1,094) (1,284) (1,301) (1,259) (1,545) (1,795)<br />
SVA (457) (123) 1,008 844 869 1,224 1,643 64 1,650 2,294 2,602<br />
* SVA: Shareholder Value Added<br />
56<br />
| <strong>Deere</strong> & Company | <strong>July</strong> 2013
57 | <strong>Deere</strong> & Company | <strong>July</strong> 2013