Math Handbook - Glencoe
Math Handbook - Glencoe
Math Handbook - Glencoe

Create successful ePaper yourself
Turn your PDF publications into a flip-book with our unique Google optimized e-Paper software.
APPENDIX B<br />
<strong>Math</strong><br />
<strong>Handbook</strong><br />
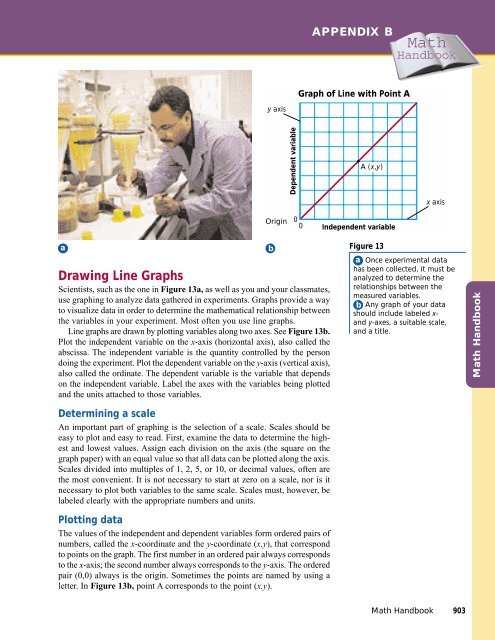
Graph of Line with Point A<br />
y axis<br />
Dependent variable<br />
A (x,y)<br />
x axis<br />
Origin<br />
0<br />
0<br />
Independent variable<br />
a<br />
Drawing Line Graphs<br />
Scientists, such as the one in Figure 13a, as well as you and your classmates,<br />
use graphing to analyze data gathered in experiments. Graphs provide a way<br />
to visualize data in order to determine the mathematical relationship between<br />
the variables in your experiment. Most often you use line graphs.<br />
Line graphs are drawn by plotting variables along two axes. See Figure 13b.<br />
Plot the independent variable on the x-axis (horizontal axis), also called the<br />
abscissa. The independent variable is the quantity controlled by the person<br />
doing the experiment. Plot the dependent variable on the y-axis (vertical axis),<br />
also called the ordinate. The dependent variable is the variable that depends<br />
on the independent variable. Label the axes with the variables being plotted<br />
and the units attached to those variables.<br />
Determining a scale<br />
An important part of graphing is the selection of a scale. Scales should be<br />
easy to plot and easy to read. First, examine the data to determine the highest<br />
and lowest values. Assign each division on the axis (the square on the<br />
graph paper) with an equal value so that all data can be plotted along the axis.<br />
Scales divided into multiples of 1, 2, 5, or 10, or decimal values, often are<br />
the most convenient. It is not necessary to start at zero on a scale, nor is it<br />
necessary to plot both variables to the same scale. Scales must, however, be<br />
labeled clearly with the appropriate numbers and units.<br />
b<br />
Figure 13<br />
a Once experimental data<br />
has been collected, it must be<br />
analyzed to determine the<br />
relationships between the<br />
measured variables.<br />
b Any graph of your data<br />
should include labeled x-<br />
and y-axes, a suitable scale,<br />
and a title.<br />
<strong>Math</strong> <strong>Handbook</strong><br />
Plotting data<br />
The values of the independent and dependent variables form ordered pairs of<br />
numbers, called the x-coordinate and the y-coordinate (x,y), that correspond<br />
to points on the graph. The first number in an ordered pair always corresponds<br />
to the x-axis; the second number always corresponds to the y-axis. The ordered<br />
pair (0,0) always is the origin. Sometimes the points are named by using a<br />
letter. In Figure 13b, point A corresponds to the point (x,y).<br />
<strong>Math</strong> <strong>Handbook</strong> 903