Math Handbook - Glencoe
Math Handbook - Glencoe
Math Handbook - Glencoe

Create successful ePaper yourself
Turn your PDF publications into a flip-book with our unique Google optimized e-Paper software.
APPENDIX B<br />
<strong>Math</strong> <strong>Handbook</strong><br />
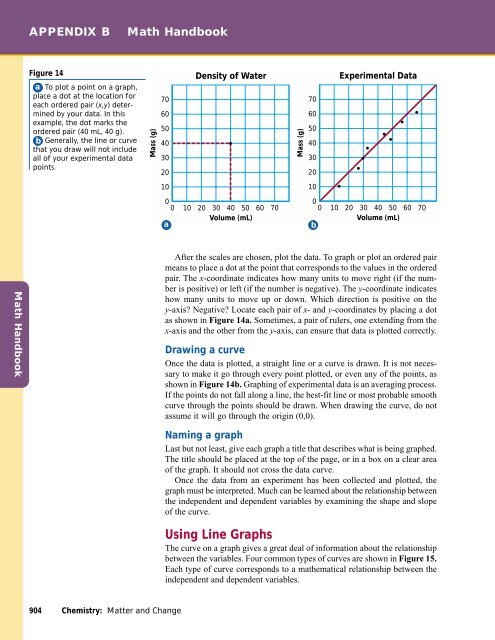
Figure 14<br />
a To plot a point on a graph,<br />
place a dot at the location for<br />
each ordered pair (x,y) determined<br />
by your data. In this<br />
example, the dot marks the<br />
ordered pair (40 mL, 40 g).<br />
b Generally, the line or curve<br />
that you draw will not include<br />
all of your experimental data<br />
points.<br />
Mass (g)<br />
70<br />
60<br />
50<br />
40<br />
30<br />
20<br />
Density of Water<br />
Mass (g)<br />
70<br />
60<br />
50<br />
40<br />
30<br />
20<br />
Experimental Data<br />
10<br />
10<br />
0<br />
0 10 20 30 40 50 60 70<br />
Volume (mL)<br />
a<br />
0<br />
0 10 20 30 40 50 60 70<br />
Volume (mL)<br />
b<br />
<strong>Math</strong> <strong>Handbook</strong><br />
After the scales are chosen, plot the data. To graph or plot an ordered pair<br />
means to place a dot at the point that corresponds to the values in the ordered<br />
pair. The x-coordinate indicates how many units to move right (if the number<br />
is positive) or left (if the number is negative). The y-coordinate indicates<br />
how many units to move up or down. Which direction is positive on the<br />
y-axis? Negative? Locate each pair of x- and y-coordinates by placing a dot<br />
as shown in Figure 14a. Sometimes, a pair of rulers, one extending from the<br />
x-axis and the other from the y-axis, can ensure that data is plotted correctly.<br />
Drawing a curve<br />
Once the data is plotted, a straight line or a curve is drawn. It is not necessary<br />
to make it go through every point plotted, or even any of the points, as<br />
shown in Figure 14b. Graphing of experimental data is an averaging process.<br />
If the points do not fall along a line, the best-fit line or most probable smooth<br />
curve through the points should be drawn. When drawing the curve, do not<br />
assume it will go through the origin (0,0).<br />
Naming a graph<br />
Last but not least, give each graph a title that describes what is being graphed.<br />
The title should be placed at the top of the page, or in a box on a clear area<br />
of the graph. It should not cross the data curve.<br />
Once the data from an experiment has been collected and plotted, the<br />
graph must be interpreted. Much can be learned about the relationship between<br />
the independent and dependent variables by examining the shape and slope<br />
of the curve.<br />
Using Line Graphs<br />
The curve on a graph gives a great deal of information about the relationship<br />
between the variables. Four common types of curves are shown in Figure 15.<br />
Each type of curve corresponds to a mathematical relationship between the<br />
independent and dependent variables.<br />
904 Chemistry: Matter and Change