MVP Evaluation Report Year 2 - Griffith University
MVP Evaluation Report Year 2 - Griffith University
MVP Evaluation Report Year 2 - Griffith University

Create successful ePaper yourself
Turn your PDF publications into a flip-book with our unique Google optimized e-Paper software.
2000 – 2 0 0 1 M V P E v a l u a t i o n R e p o r t<br />
more marginal. However, without the benefit of larger sample sizes and statistical analysis, definitive<br />
conclusions should not be drawn regarding this matter.<br />
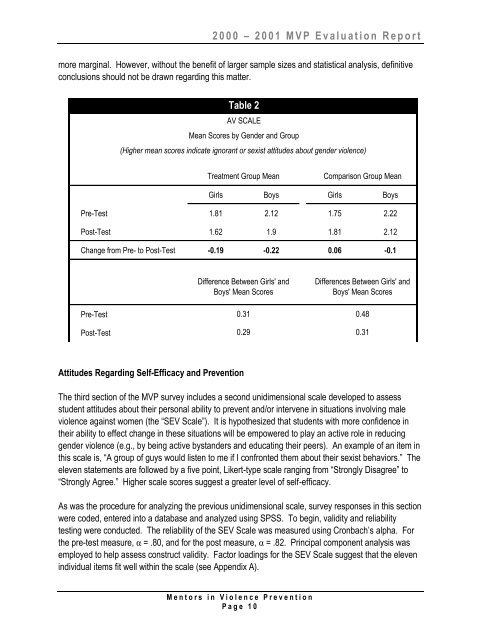
Table 2<br />
AV SCALE<br />
Mean Scores by Gender and Group<br />
(Higher mean scores indicate ignorant or sexist attitudes about gender violence)<br />
Treatment Group Mean<br />
Comparison Group Mean<br />
Girls Boys Girls Boys<br />
Pre-Test 1.81 2.12 1.75 2.22<br />
Post-Test 1.62 1.9 1.81 2.12<br />
Change from Pre- to Post-Test -0.19 -0.22 0.06 -0.1<br />
Difference Between Girls' and<br />
Boys' Mean Scores<br />
Differences Between Girls' and<br />
Boys' Mean Scores<br />
Pre-Test<br />
0.31 0.48<br />
Post-Test<br />
0.29<br />
0.31<br />
Attitudes Regarding Self-Efficacy and Prevention<br />
The third section of the <strong>MVP</strong> survey includes a second unidimensional scale developed to assess<br />
student attitudes about their personal ability to prevent and/or intervene in situations involving male<br />
violence against women (the “SEV Scale”). It is hypothesized that students with more confidence in<br />
their ability to effect change in these situations will be empowered to play an active role in reducing<br />
gender violence (e.g., by being active bystanders and educating their peers). An example of an item in<br />
this scale is, “A group of guys would listen to me if I confronted them about their sexist behaviors.” The<br />
eleven statements are followed by a five point, Likert-type scale ranging from “Strongly Disagree” to<br />
“Strongly Agree.” Higher scale scores suggest a greater level of self-efficacy.<br />
As was the procedure for analyzing the previous unidimensional scale, survey responses in this section<br />
were coded, entered into a database and analyzed using SPSS. To begin, validity and reliability<br />
testing were conducted. The reliability of the SEV Scale was measured using Cronbach‟s alpha. For<br />
the pre-test measure, α = .80, and for the post measure, α = .82. Principal component analysis was<br />
employed to help assess construct validity. Factor loadings for the SEV Scale suggest that the eleven<br />
individual items fit well within the scale (see Appendix A).<br />
M e n t o r s i n V i o l e n c e P r e v e n t i o n<br />
P a g e 10