MVP Evaluation Report Year 2 - Griffith University
MVP Evaluation Report Year 2 - Griffith University
MVP Evaluation Report Year 2 - Griffith University

You also want an ePaper? Increase the reach of your titles
YUMPU automatically turns print PDFs into web optimized ePapers that Google loves.
2000 – 2 0 0 1 M V P E v a l u a t i o n R e p o r t<br />
Strong treatment effects were found using both the factor score and the averaged score. Using the<br />
factor score regression model, students in the treatment group had significantly lower scores than the<br />
comparison group at post-test (p = .006). The averaged score regression model yielded confirmatory<br />
results and demonstrated that the difference between groups at post-test was statistically significant (p<br />
= .000).<br />
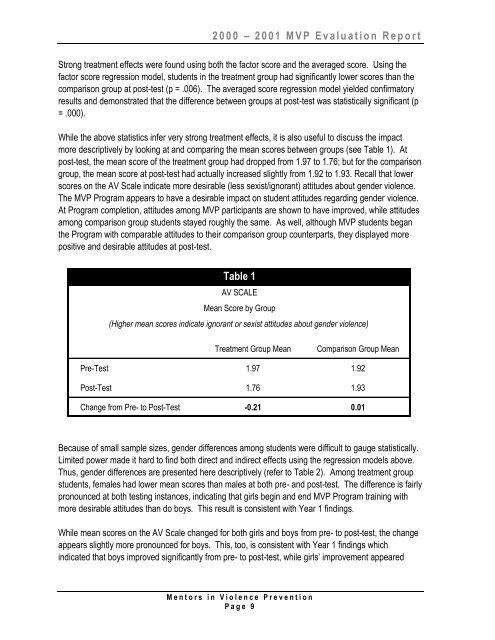
While the above statistics infer very strong treatment effects, it is also useful to discuss the impact<br />
more descriptively by looking at and comparing the mean scores between groups (see Table 1). At<br />
post-test, the mean score of the treatment group had dropped from 1.97 to 1.76; but for the comparison<br />
group, the mean score at post-test had actually increased slightly from 1.92 to 1.93. Recall that lower<br />
scores on the AV Scale indicate more desirable (less sexist/ignorant) attitudes about gender violence.<br />
The <strong>MVP</strong> Program appears to have a desirable impact on student attitudes regarding gender violence.<br />
At Program completion, attitudes among <strong>MVP</strong> participants are shown to have improved, while attitudes<br />
among comparison group students stayed roughly the same. As well, although <strong>MVP</strong> students began<br />
the Program with comparable attitudes to their comparison group counterparts, they displayed more<br />
positive and desirable attitudes at post-test.<br />
Table 1<br />
AV SCALE<br />
Mean Score by Group<br />
(Higher mean scores indicate ignorant or sexist attitudes about gender violence)<br />
Treatment Group Mean<br />
Comparison Group Mean<br />
Pre-Test 1.97 1.92<br />
Post-Test 1.76 1.93<br />
Change from Pre- to Post-Test -0.21 0.01<br />
Because of small sample sizes, gender differences among students were difficult to gauge statistically.<br />
Limited power made it hard to find both direct and indirect effects using the regression models above.<br />
Thus, gender differences are presented here descriptively (refer to Table 2). Among treatment group<br />
students, females had lower mean scores than males at both pre- and post-test. The difference is fairly<br />
pronounced at both testing instances, indicating that girls begin and end <strong>MVP</strong> Program training with<br />
more desirable attitudes than do boys. This result is consistent with <strong>Year</strong> 1 findings.<br />
While mean scores on the AV Scale changed for both girls and boys from pre- to post-test, the change<br />
appears slightly more pronounced for boys. This, too, is consistent with <strong>Year</strong> 1 findings which<br />
indicated that boys improved significantly from pre- to post-test, while girls‟ improvement appeared<br />
M e n t o r s i n V i o l e n c e P r e v e n t i o n<br />
P a g e 9