
You also want an ePaper? Increase the reach of your titles
YUMPU automatically turns print PDFs into web optimized ePapers that Google loves.
THE IMPACT OF BAD DATA ON<br />
PROFITS AND CONSUMER SERVICE<br />
IN THE AUSTRALIAN GROCERY<br />
INDUSTRY<br />
A report for the retail grocery industry prepared<br />
by <strong>GS1</strong> <strong>Australia</strong> in conjunction with IBM<br />
SUPPORTED BY
2<br />
Executive Summary<br />
Retailers are<br />
working with<br />
data that is<br />
inconsistent<br />
well over 80%<br />
of the time<br />
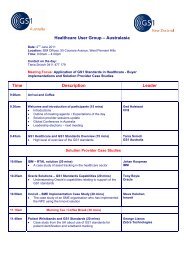
Bad data has a severe cost impact on<br />
the industry in three main areas:<br />
1. The cost of manual workarounds to<br />
source missing data and correct errors<br />
2. Administrative shrinkage costs in areas<br />
such as ordering and invoicing<br />
3. Lost consumer sales through shelf<br />
stock-outs<br />
4%<br />
31%<br />
65%<br />
CONTENTS<br />
Executive Summary 2<br />
Background 4<br />
The Study 5<br />
The Results 6<br />
Cost Implications of<br />
Bad Product <strong>Data</strong> 9<br />
Company in Profile:<br />
Kimberly-Clark 11<br />
More than a decade ago, the <strong>Australia</strong>n food and grocery industry recognised<br />
the impact of poor product supply-chain data. It embarked on a program to<br />
improve the quality and consistency of this data in 1998 when the EANnet data<br />
synchronisation service was commissioned.<br />
Through a series of iterations and developments and the migration to the<br />
Global <strong>Data</strong> Synchronisation Network (GDSN)-compliant data pool <strong>GS1</strong>net,<br />
completed in 2008, the program has progressed through to the present day.<br />
However, data synchronisation alone is not the answer to ensuring data quality.<br />
If the original data is inaccurate, the provision of master data to customers<br />
electronically means bad information is transferred at the speed of light.<br />
To ensure consistently high-quality data at the source, the key is to ensure<br />
data-gathering processes are correct. Once these processes are in place, the<br />
system of interoperable data pools that make up the GDSN network can<br />
be used to share this accurate data with all relevant trading partners.<br />
Looking Forward 12<br />
Call to Action 14<br />
Appendix 15<br />
Our study shows that retailers and<br />
suppliers using data synchronisation<br />
show significantly better data quality<br />
results than those who did not (fully)<br />
adopt data synchronisation
3<br />
Major findings<br />
of the <strong>Australia</strong>n<br />
study include:<br />
• Case pack and<br />
pallet data are<br />
considerably<br />
better aligned<br />
between<br />
supplier and<br />
retailers than<br />
SKU-level data<br />
• The most<br />
accurate data<br />
fields were SKU<br />
height, net case<br />
configuration<br />
and pallet TI HI<br />
• The least<br />
accurate data<br />
fields were<br />
gross and<br />
nett weight<br />
In 2009 <strong>GS1</strong> UK, in association with IBM, commissioned a report to examine the<br />
quality of product data that is the basis of many decisions affecting supply chain<br />
performance and underpinning a fully functioning and efficient grocery sector.<br />
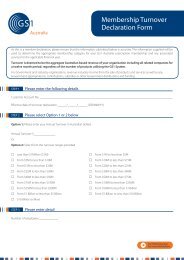
Cost Due to Supply Chain Inefficiencies<br />
UK<br />
AUS<br />
Cost Due to Supply Chain Stocks<br />
UK<br />
AUS<br />
AU$1.092B<br />
AU$350M<br />
AU$468M<br />
AU$675M<br />
The UK and <strong>Australia</strong>n reports show marked differences: the internal costs of the<br />
supply chain in <strong>Australia</strong> seem more streamlined than in the UK, while out-ofstocks<br />
and subsequent customer disappointment in the retailer or manufacturer<br />
is a bigger challenge in <strong>Australia</strong> than it is for our European counterparts.<br />
The <strong>GS1</strong> UK <strong>Data</strong> <strong>Crunch</strong> <strong>Report</strong> 2009 showed that the accuracy of this data was<br />
exceptionally poor overall and suggested that the UK retail industry could save<br />
£1 billion in just five years by addressing the issue of poor data quality.<br />
Following the publication of the UK report, in 2010 <strong>GS1</strong> <strong>Australia</strong> commissioned<br />
a similar report to better understand the situation in <strong>Australia</strong>, where data<br />
synchronisation with two of the three major retailers and more than 500<br />
suppliers has been a feature of the industry landscape for several years.
4 Background<br />
<strong>Australia</strong>n grocery retail is a highly competitive, fast-moving<br />
and rapidly changing industry. The major supermarket chains<br />
have developed supply chains that service a diverse range of<br />
outlets with an impressive and growing selection of products<br />
and merchandise. The supermarket groups are in a fiercely<br />
competitive environment and there is a threat of international<br />
players entering the market, following the success of Aldi<br />
in <strong>Australia</strong>. The retail sector is under constant pressure to<br />
innovate – to introduce new ways for consumers to buy (such<br />
as from the web and mobile devices), to provide extended<br />
product ranges and to address increasing demands from<br />
consumers and legislators.<br />
The flow of information is critical to these developments.<br />
However, for some time anecdotal evidence has suggested<br />
that product data in the supply chain is of variable quality.<br />
To prove (or disprove) the ‘bad data’ argument, <strong>GS1</strong> <strong>Australia</strong>,<br />
with IBM, compared data on grocery products held by the<br />
three major supermarket retailers and matched this against<br />
product data from four major suppliers.<br />
The <strong>Australia</strong>n <strong>Data</strong> <strong>Crunch</strong> Project has revealed that retailers<br />
are working with data that is inconsistent more than 80% of<br />
the time. Given the current overall health of the grocery<br />
retailing industry, it was surprising to discover such a high<br />
level of poor-quality product data currently being held<br />
by retailers.<br />
We calculate that over the next five years, <strong>Australia</strong>n grocery<br />
retailers and suppliers will experience over AU$350 million<br />
in profit erosion and AU$675 million in lost sales as a<br />
result of bad data. These are conservative estimates based<br />
on the combination of process inefficiencies, duplications<br />
and workarounds across the retailer and supplier’s supply<br />
chains, together with administrative shrinkage and shelf<br />
stock-outs caused by inaccurate data. These estimates are<br />
supported by previous independent research conducted<br />
over the past decade.<br />
The total cost of bad data in the <strong>Australia</strong>n grocery supply<br />
chain will be AU$1.035 billion over five years.
The Study<br />
5<br />
Although the <strong>Australia</strong>n grocery industry had engaged in data<br />
synchronisation for some years, there is still concern about the<br />
overall quality of data being shared. <strong>Data</strong> synchronisation must<br />
be combined with appropriate validation to ensure the quality<br />
of data is maintained. With more than 300 business validation<br />
rules set down by the industry as the program has evolved,<br />
much of the data required by the major retailers is quality<br />
assured.<br />
However, some data types cannot be checked by computer<br />
unless there is some level of human intervention. For instance,<br />
how does a computer determine whether the flavour of a new<br />
product is orange or lemon?<br />
What are brand owners and manufacturers doing about the<br />
quality of their data? Businesses cannot operate efficiently<br />
within their own four walls by basing decisions on inaccurate<br />
information. Any problems are then magnified once bad data<br />
is used to support trading relationships.<br />
The aim of this study was to determine the full extent of<br />
these issues among the top echelon of organisations in the<br />
<strong>Australia</strong>n grocery sector. Those participating included:<br />
SUPPLIERS<br />
The manufacturers provided the product data on all lines they<br />
supplied to their three major grocery retail trading partners.<br />
The retailers provided data for review on products they all<br />
supplied.<br />
The total number of consumer units submitted was 3,271,<br />
while 3,144 trade unit-level pack details were provided.<br />
A sub-set of data comprising the following fields<br />
was evaluated:<br />
• Item Global Trade Item Number (GTIN)<br />
• Item Depth<br />
• Item Width<br />
• Item Height<br />
• Item Net Weight<br />
• Item Gross Weight<br />
• Trade Unit GTIN<br />
• Trade Unit Depth<br />
• Trade Unit Width<br />
• Trade Unit Height<br />
• Trade Unit Net Weight<br />
• Trade Unit Gross Weight<br />
• Trade Unit Case Configuration<br />
• Pallet TI (Shipper boxes per pallet layer)<br />
• Pallet HI (Layers per pallet)<br />
The data was delivered to an IBM data centre and compared<br />
or 'crunched' across the various sources. All matches and<br />
deviations were recorded.<br />
PRODUCERS & SUPPORTERS<br />
RETAILERS & WHOLESALERS
6<br />
The Results<br />
A total of 3,271 products were supplied for the study, however, only 782<br />
consumer units and 788 trade units were matched to all three participating<br />
retailers.<br />
The following details the percentage of items matched in all three retailers’<br />
databases against the suppliers’ database.<br />
Consumer Units<br />
Knowing that a 1mm diversion could cause an error to be registered,<br />
<strong>GS1</strong> <strong>Australia</strong> decided to allow for a tolerance of 10%. Even with that<br />
tolerance the percentage of matches was surprisingly low.<br />
Depth and Width<br />
The depth and width parameters indicated a poor correlation between<br />
retailers and suppliers. The average match of around one-third of items<br />
raises questions as to the accuracy of shelf-space planning mechanisms.<br />
One of the four suppliers matched in two-thirds of items, meaning the<br />
overall results were dragged down by the other three – one in particular.<br />
Depth<br />
Width<br />
Height<br />
Net Weight<br />
Gross Weight<br />
41%<br />
41%<br />
77%<br />
37%<br />
11%<br />
Height<br />
Height was a different matter. Clearly the retailers place an emphasis<br />
on having this parameter accurately stored in their data files. Perhaps this<br />
is because if a product is too tall for the allocated shelf space there is<br />
nowhere for it to go, whereas an error in width or depth can be 'fudged'<br />
in shelf placement and has less impact.<br />
Net and Gross Weights<br />
The weight of consumer units is clearly not an area of significant priority<br />
for suppliers or retailers as there was minimal alignment. One supplier had<br />
nearly 50% alignment with the three retailers. There was more than 90%<br />
alignment for the majority of products for the one retailer who has<br />
undergone a significant data synchronisation program.<br />
A lack of net- and gross-weight data, or incorrect data, could have a<br />
significant impact on retailers with self-checkout systems in place. It has<br />
been reported that 40% of all checkout transactions at the major retailers<br />
are now conducted via self-checkouts. However, these systems - which<br />
allow consumers to scan, bag and pay for items unassisted - depend on<br />
correct product weight data to verify that the item has been placed in the<br />
bagging area. Without this data the self-checkout will not function.
7<br />
Depth<br />
Width<br />
Height<br />
Net Weight<br />
17%<br />
19%<br />
27%<br />
93%<br />
Gross Weight<br />
Case<br />
Configuration<br />
TI<br />
HI<br />
16%<br />
54%<br />
90%<br />
52%<br />
Traded Units<br />
Dimensions (Depth, Width and Height)<br />
Box and shipper dimensions were consistently misaligned<br />
between retailers and suppliers. Interviews with all three<br />
retailers revealed that this is an area of significant manual<br />
processing. All three ask suppliers to provide dimension data<br />
with new line submissions, through electronic means such as<br />
<strong>GS1</strong>net, or using more manual processes such as the Universal<br />
Buying Form (UBF). Yet all three then re-measure all new<br />
boxes supplied to distribution centres around the country<br />
and enter those measurements in their disparate warehouse<br />
management systems. All agreed there was little or no value<br />
having the original data from suppliers but they would<br />
consider using it if the data was reliable. However, for supplier<br />
data to be reliable, all suppliers must provide accurate data as<br />
there cannot be two systems in operation. So until suppliers<br />
can consistently provide this data to uniform industry<br />
standards, manual workarounds and duplication will remain.<br />
A common error made when providing dimension<br />
specifications is to confuse the width and depth dimensions.<br />
The width is the narrowest side of the base; the depth the<br />
longer side. A <strong>GS1</strong> <strong>Australia</strong> and Efficient Consumer Response<br />
Australasia (ECRA) study from 2007 identified errors of<br />
over 30% from a group of multi-national suppliers to the<br />
Australasian grocery sector. Part of this was due to confusion<br />
between width and depth and the transposition of these<br />
fields when mapped to the local data pool, <strong>GS1</strong>net. This led to<br />
the introduction of a validation rule whereby <strong>GS1</strong>net rejects<br />
data if the width for a trade unit item is greater than the depth.<br />
Net and Gross Weight<br />
Net weight accuracy was very high at 93%. Weight is an<br />
occupational health and safety issue so all parties pay extra<br />
attention to it. However, one retailer commented that “weight<br />
is only an issue if it is in excess of 16kgs”. Weight data is also<br />
used in transportation as transport companies are subjected<br />
to maximum weight and maximum cube regulatory limits.
8<br />
Case Configuration/Net Content<br />
This was the big-ticket item highlighted by all retailers in the<br />
survey. When goods arrive at a retailer’s receiving bay and the<br />
carton net content, i.e. the number of consumer units, differs<br />
from the retailer’s expectations and from what was ordered,<br />
everything suddenly stops. The supplier must be contacted<br />
and purchase orders and advance ship notices must be<br />
re-written and re-submitted before the receiving process can<br />
be advanced. In some instances, where differences cannot<br />
be resolved, trucks have been turned around and sent back.<br />
These delays have a flow-on effect throughout the<br />
distribution centre and for the trucks of other suppliers<br />
waiting to meet their allotted delivery slots at the centre. The<br />
distibution centre must also come under increased scrutiny<br />
due to chain-of-responsibility legislation requirements.<br />
This also complicates the accounts reconciliation<br />
process, which is required to correct the issues.<br />
The cost for individual organisations is high, but the overall<br />
cost to the industry is higher due to reduced service levels<br />
and more goods being out of stock.<br />
TI/HI<br />
TI/HI is a colloquial grocery term referring to the number of<br />
boxes per pallet layer (TI) and the number of layers stacked<br />
on a pallet (HI). This information is critical to retailers assigning<br />
pick slots in the warehouse. The pallet height ensures safety<br />
when putting pallets away in pick slots where there may only<br />
be clearance of around 100mm surrounding the slot. This<br />
allowance can be filled by a pallet stacked six or seven high<br />
if the measurements are out by only a couple of centimetres.<br />
As a result the pallet may topple over on the forklift driver.<br />
Most of the results were in the 80% - 90% range for these<br />
criteria; however, the number was dragged down by the<br />
supplier with the second largest volume of matched<br />
products who scored particularly poorly.
Cost Implications<br />
of Bad Product <strong>Data</strong><br />
9<br />
In order to understand the impact of bad product data,<br />
<strong>GS1</strong> <strong>Australia</strong> discussed the findings of the survey with<br />
representatives of large retailers and suppliers. The<br />
most likely cost implications of the data misalignment<br />
highlighted in the study fall into three main groups:<br />
1. Manual Workarounds 4%<br />
2. Administrative Shrinkage 31%<br />
3. Lost Consumer Sales 65%<br />
Manual Workarounds<br />
Invoice and Order Reconciliation<br />
Any mismatch between the goods supplied and the original<br />
purchase order significantly affects the supply chain. At the<br />
very least, the goods are held up until the issue is resolved<br />
leading to stores being out of stock.<br />
Depending on the variations, the receiver of the goods<br />
could return the goods entirely or, having made appropriate<br />
investigations, re-issue the purchase order so it matches the<br />
despatch advice. In some cases the truck will be kept waiting<br />
while investigations take place, causing a ripple effect through<br />
other suppliers and transport firms as strict delivery schedules<br />
are pushed out.<br />
If the goods are accepted, it can take months to reconcile the<br />
differences, leading to payment delays, customers being put<br />
on credit hold and finance issues.<br />
It is estimated these issues will cost the <strong>Australia</strong>n grocery<br />
industry around $31 million over the next five years based<br />
on current data inaccuracies.<br />
At every stage of a product’s journey through the supply<br />
chain, data is required to identify, process, handle, route and<br />
re-route these items successfully. Manual workarounds may<br />
be categorised into two major areas of cost implication:<br />
1. Invoice and Order Reconciliation<br />
2. Manual <strong>Data</strong> Entry and Workarounds<br />
Manual <strong>Data</strong> Entry and Workarounds<br />
The <strong>Australia</strong>n grocery retail sector is a low-margin, high-volume<br />
industry characterised by a relatively small market, large<br />
distances and low-growth population. Retailers have focused<br />
on taking costs out of their supply lines by taking greater<br />
direct control of product movements and economies in<br />
logistics.<br />
Significant investments in technology such as bar coding,<br />
electronic messaging and data synchronisation have helped<br />
increase automation reducing manual handling and supply<br />
chain costs significantly.<br />
When these processes, which rely heavily on the underpinning<br />
data, are subjected to inaccuracies, the whole system slows<br />
down and becomes extremely inefficient.<br />
When bar codes are keyed in, rather than scanned, when<br />
messages fail because the item code is wrong, the price<br />
differs from what was agreed or the carton quantities vary,<br />
the supply chain ceases to operate properly.
10<br />
Specific areas that have been identified as requiring manual<br />
entry and workaround include:<br />
• Transportation under/over utilisation<br />
• Storage under/over utilisation<br />
• Planogram errors<br />
• Material handling problems<br />
• Capacity constraints<br />
• Duplication of measurement<br />
• Product rejection<br />
• Record maintenance<br />
Associated costs are expected to amount to AU$13.5 million<br />
over the next five years.<br />
Administrative Shrinkage<br />
Shrinkage is an area identified in a number of local and<br />
overseas reports as an area of significant concern, with<br />
leakage from the product supply chain. Shrinkage is the<br />
difference between what is shipped by the supplier and<br />
what is finally sold to the consumer. It can be caused by a<br />
number of factors including theft, obsolescence, poor stock<br />
rotation, waste and general inefficiency. Shrinkage is said to<br />
add up to between 1.5% and 2% of a retailer’s total sales.<br />
General inefficiency and product misidentification are<br />
the main culprits. When you don’t know exactly what or<br />
where a product is, it is easy for it to become unsaleable<br />
before you have time to promote it or mark it down for<br />
immediate sale. The end result is process-driven shrinkage.<br />
This form of shrinkage, caused by bad data or inefficient<br />
transmission of data, is expected to cause around 10%<br />
of total shrinkage or around AU$316 million in the<br />
<strong>Australia</strong>n grocery industry over five years.<br />
Lost Consumer Sales<br />
Lost consumer sales due to stores being out of stock are a<br />
consistent and persistent problem in the <strong>Australia</strong>n grocery<br />
industry. A worldwide study by the Grocery Manufacturers<br />
Association (GMA) on out-of-stock levels shows that a global<br />
average of 8% of all items were out of stock at the time of<br />
measurement.<br />
The study clearly shows that retailers’ sales are directly at risk<br />
if on-shelf availability is not effectively addressed. When a<br />
consumer cannot find the product they wish to purchase<br />
on the shelf they will:<br />
• Purchase the product they want but at another retail<br />
outlet – the retailer loses<br />
• Purchase an alternative product – the supplier of the<br />
original product loses<br />
• Go without – both the supplier and the retailer lose<br />
In <strong>Australia</strong>, a 2007-2008 report into the current state of<br />
on-shelf availability in the <strong>Australia</strong>n and New Zealand<br />
food and grocery industry by ECRA and Accenture found<br />
that the percentage loss in sales responses resulted in a<br />
weighted average of 4.4%.<br />
The cost of lost sales due to bad data is expected to amount<br />
to AU$675 million over five years.<br />
Total Costs<br />
The total cost of bad data in the <strong>Australia</strong>n grocery supply<br />
chain will amount to AU$1.035 billion over five years.
Company Profile<br />
11<br />
Kimberly-Clark<br />
Kimberly-Clark <strong>Australia</strong> & New Zealand manufactures,<br />
markets and sells leading health and hygiene products.<br />
The company was an early adopter of electronic data<br />
interchange (EDI) in its healthcare business as well as<br />
being one of the first companies to establish web-based<br />
business-to-business (B2B) trading in 1997.<br />
It was also one of the first manufacturers to support<br />
data synchronisation through <strong>GS1</strong>net and all Kimberly-<br />
Clark products carry <strong>GS1</strong> Bar Codes. In 2009 Kimberly-<br />
Clark established three new distribution centres with<br />
operations dependent on accurate synchronised<br />
material records, and the business approached <strong>GS1</strong><br />
<strong>Australia</strong> to deliver a data-quality solution to achieve this.<br />
The objective of this audit was to assess and rectify<br />
errors with bar code numbers Global Trade Item<br />
Numbers (GTINs), product dimensions, weights,<br />
contents, item descriptions and physical packaging<br />
descriptions across all levels of packaging on<br />
approximately 1,193 imported items. The project also<br />
included physically reviewing a number of data<br />
attributes and comparing this data against internal<br />
systems to ensure information was accurate and<br />
complete.<br />
The company decided to focus on externally procured<br />
stock-keeping units (SKUs), which in the past had not<br />
been as rigorously controlled as internally manufactured<br />
SKUs. The company suspected that the bar coding and<br />
data on these SKUs was not meeting <strong>GS1</strong> standards.<br />
During the physical audit products’ bar codes were<br />
scanned, packaging levels opened and pack quantities<br />
counted and recorded. The team measured all stock<br />
dimensions and recorded gross and net weight. The<br />
actual audit covered 907 products comprising 1,526<br />
packaging levels. The audit focused on products for<br />
which the data was suspected to be inaccurate.<br />
It found that:<br />
• Dimensions for almost 100% of consumer (base) and<br />
intermediate units, and a high percentage of case units, were<br />
missing or wrong in SAP.<br />
• Weights for almost 100% of all units were missing or<br />
wrong in SAP<br />
• The contents of some Cases, Intermediate and Consumer (Base)<br />
units for a few materials were wrong in SAP<br />
Some 18 months later, Kimberly-Clark’s data was consistently of<br />
a higher quality than its competitors in this <strong>Data</strong> <strong>Crunch</strong> Study,<br />
scoring much greater alignment with all retailers.<br />
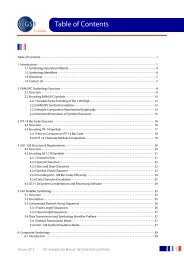
323<br />
Products<br />
354<br />
Products<br />
46<br />
Products<br />
8<br />
Products<br />
Wrong GTIN in SAP<br />
for the Case unit<br />
Wrong GTIN in SAP for<br />
the Consumer (Base) unit<br />
Intermediate pack levels<br />
that were not defined<br />
in SAP, and were missing<br />
their GTINs and dimensions<br />
Had Consumer (Base) unit<br />
pack levels that were not<br />
defined in SAP, and were<br />
missing their GTINs and<br />
dimensions
12<br />
Looking Forward<br />
Retailers and suppliers are constantly seeking fresh supply<br />
chain initiatives to speed products to market faster and utilise<br />
warehouses, delivery vehicles and shelf space more effectively.<br />
Key performance indicators funnel down to two imperatives:<br />
increasing sales and reducing costs. While the objectives are<br />
clear, there is little understanding of just how far collaboration<br />
between suppliers and retailers and the implementation of<br />
fresh supply chain initiatives that deliver sales growth and cost<br />
economies depend on a solid foundation of accurate, clean<br />
and consistent product data.<br />
An additional compelling reason for retailers and suppliers<br />
to take action to improve efficiency and manage the quality<br />
of product data more effectively is the increasing demand for<br />
better information coming from consumers, government,<br />
regulators and pressure groups.<br />
Consumer Health<br />
Consumer concerns about healthy eating and allergies place<br />
a growing responsibility on retailers and manufacturers to<br />
provide more information on product ingredients including<br />
eggs, milk, fish, soya, wheat and nut content. The consequences<br />
of getting this information wrong could be serious for the<br />
consumer, the supplier and the retailer who would be exposed<br />
should inaccurate data cause consumers to be harmed. Any<br />
resulting bad media exposure could have a severe impact<br />
on brand image.<br />
New Consumer Outlets<br />
Consumers exercising increased choice are driving supermarkets<br />
to offer alternative shopping outlets. There has been a rapid<br />
increase in convenience stores and online outlets offering<br />
home delivery. As technology advances, there will be an<br />
inevitable demand for grocery shopping from mobile devices<br />
and, no doubt, through other as-yet-unknown channels in<br />
the future.<br />
Each new channel places fresh demands on the retailer for<br />
new sizes, packs and categories of product, which in turn<br />
multiply the volume of product information that needs to<br />
be sourced and maintained. This exponential demand for<br />
data can only be managed effectively through a high-quality,<br />
centralised data management process that ensures consistency<br />
and accuracy.<br />
Walmart has recently admitted the folly of reducing choice<br />
and options within a category, a trend that was being<br />
followed in <strong>Australia</strong>. We would expect a reversal to be<br />
reflected locally, with retailers keen to increase the selection<br />
for consumers to keep them in their stores. This will result in<br />
the need to manage more data.<br />
Product Traceability<br />
Increasingly diverse products and product sources place<br />
a heavy burden on retailers to track the origins of product<br />
batches and distribution through the supply chain. It is<br />
important to know the constituent ingredients of products<br />
in case any ingredient becomes the subject of a health alert,<br />
so action can be swiftly taken to identify all affected products<br />
and withdraw relevant batches. Identifying ingredients across<br />
the many tens of thousands of products handled by a major<br />
grocery chain, and tracking products through complex supply<br />
chains requires comprehensive product attribute data from<br />
the supplier that is readily available at a central point, rather<br />
than buried within a maze of spreadsheets in local stores and<br />
warehouses, or simply missing from the entire organisation.
13<br />
Diverse Products<br />
& Sources<br />
The variety of products sourced by supermarket chains<br />
is constantly growing, with an average product life of 2.3<br />
years. Sourcing products is also becoming more complex.<br />
Fruit, vegetables and grocery products are arriving from<br />
more and more countries, with different cross-border taxes<br />
and quotas, a variety of weight and volume systems, and<br />
different labelling, packaging and language standards.<br />
This diversity adds to the complexity of product data and<br />
increases the risk of error if data quality is not properly<br />
managed.<br />
At the other extreme, supermarkets are responding to<br />
environmental pressures to reduce their carbon footprint<br />
by sourcing produce where possible within a tight radius<br />
of local stores. Small local producers have less sophisticated<br />
methods of measuring, shipping and packing products<br />
and providing product information. Retailers will need<br />
to accommodate these extremes of international and<br />
local product sources within their data repositories.<br />
Environmental Issues<br />
Grocery retailers and suppliers are faced with growing pressure<br />
from consumers and lobby groups for comprehensive information<br />
about how products, packaging, product sourcing<br />
and distribution logistics impact the environment. The type<br />
and nature of environmental information are continually<br />
evolving, adding to the quantity and scope of product<br />
attributes that need to be collated, stored and maintained.<br />
Meeting information demands from consumers, pressure<br />
groups and regulators while at the same time increasing the<br />
volume and diversity of stores, consumer outlets, products<br />
and suppliers places a heavy toll on the quantity, quality and<br />
availability of product information. Couple with this the<br />
financial imperative to move products faster through the supply<br />
chain, reduce stock and maintain high shelf-availability for<br />
consumers, and there is an irresistible imperative to improve<br />
the quality and performance of product data management.
14<br />
Call to Action<br />
The supply chain continues to function and satisfy the needs<br />
of consumers, but at a high financial cost in manual workarounds,<br />
a high incidence of lost sales and significant product shrinkage.<br />
In the past, rapid market growth and the expansion of large<br />
grocery retailers have compensated for the hidden costs in<br />
keeping the supply chain functioning. However, retailers<br />
need to pay more attention to raising efficiency levels and<br />
streamlining activities. Improving the quality of product data<br />
and reducing the time and effort it takes to obtain, manage<br />
and distribute consistent and accurate information across the<br />
business will play an important part in delivering operational<br />
benefits.<br />
As the grocery industry becomes more complex, product life<br />
cycles shorten and consumer outlets become more varied,<br />
the demand for faster delivery of more diverse and accurate<br />
data will increase.<br />
Additional pressures are being imposed by consumers,<br />
governments, regulators and pressure groups demanding<br />
more information on nutritional, environmental, packaging<br />
and other product attributes.<br />
To keep pace with these demands and manage product<br />
information efficiently and economically, retailers and suppliers<br />
will need to collaborate to maintain and exchange accurate<br />
product data.<br />
What should retailers and suppliers do to improve data<br />
quality, taking costs out of the supply chain and increasing<br />
top-line revenue by serving customers better?<br />
• Review the <strong>GS1</strong> <strong>Data</strong> Quality Framework (DQF) and employ<br />
it throughout their businesses<br />
• Develop capabilities to check and publish master data<br />
through <strong>GS1</strong>net and using tools available from<br />
<strong>GS1</strong>net-certified partners<br />
• Work off a single repository that feeds all sales channels<br />
• Ensure proper security and governance as set out in<br />
the DQF<br />
• Use the <strong>GS1</strong> System to improve product identification and<br />
visibility<br />
• Utilise <strong>GS1</strong> assistance with respect to <strong>GS1</strong>net and DQ support<br />
services<br />
The <strong>GS1</strong> <strong>Data</strong> Quality<br />
Framework<br />
The <strong>Data</strong> Quality Framework<br />
(DQF) provides<br />
an industry-developed<br />
best practice guide for<br />
improving data quality<br />
and allows companies<br />
to better leverage their<br />
data-quality programs,<br />
ensuring a continuously<br />
improving master data<br />
generation cycle. It details<br />
the crucial processes and<br />
capabilities that help<br />
organisations improve<br />
their data integrity and<br />
maintain a sustainable<br />
high-quality data output.<br />
The DQF can be downloaded<br />
from www.gs1.org/gdsn/dqf/<br />
data_quality_framework
Appendix 15<br />
Documents and reports referred to in this report:<br />
ECRA/EAN EANnet Feasibility Study – 2002<br />
<strong>GS1</strong>/ECRA Accurate Product Measurement – Items and Trade Units – 2007<br />
ECRA Guide to Collaborative Loss Prevention – 2002<br />
<strong>GS1</strong> UK <strong>Data</strong> <strong>Crunch</strong> <strong>Report</strong> – 2009<br />
ECRA/Accenture; The On Shelf Availability Challenge – 2007-2008<br />
Other sources include:<br />
IBM Global Benchmarks – Retail Industry<br />
Retailer interviews conducted by <strong>GS1</strong> <strong>Australia</strong> & IBM – 2011<br />
www.rateinflation.com<br />
ABS Retail Trade - 2010 sales (estimated) Food Retailing
16<br />
Head Office<br />
Axxess Corporate Park<br />
Unit 100/45 Gilby Rd<br />
Mt Waverley VIC 3149<br />
Locked Bag 2<br />
Mt Waverley VIC 3149<br />
T +61 3 9558 9559<br />
F +61 3 9558 9551<br />
Sydney Office<br />
Lakes Business Park<br />
Building 4B, 2-4 Lord St<br />
Botany NSW 2019<br />
Locked Bag 7002<br />
Botany NSW 1455rs<br />
T +61 2 9700 0933<br />
F +61 2 9700 0820<br />
JB_1137_160112<br />
National Number:<br />
1300 BARCODE<br />
(1300 227 263)<br />
ABN: 67 005 529 920<br />
www.gs1au.org<br />
16