Pharmacokinetic simulations for forensic toxicological ... - GTFCh
Pharmacokinetic simulations for forensic toxicological ... - GTFCh
Pharmacokinetic simulations for forensic toxicological ... - GTFCh

You also want an ePaper? Increase the reach of your titles
YUMPU automatically turns print PDFs into web optimized ePapers that Google loves.
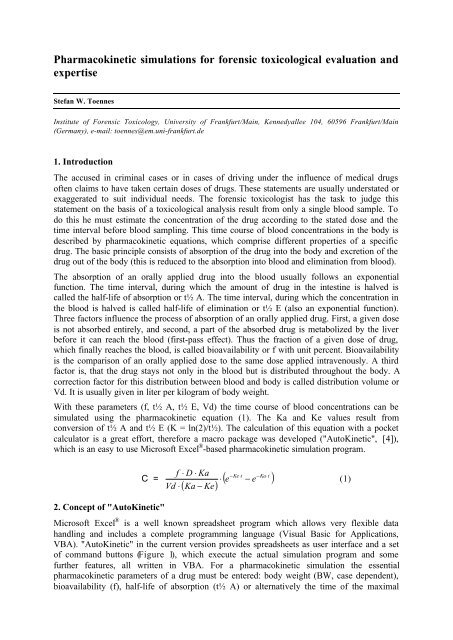
<strong>Pharmacokinetic</strong> <strong>simulations</strong> <strong>for</strong> <strong>for</strong>ensic <strong>toxicological</strong> evaluation and<br />
expertise<br />
Stefan W. Toennes<br />
Institute of Forensic Toxicology, University of Frankfurt/Main, Kennedyallee 104, 60596 Frankfurt/Main<br />
(Germany), e-mail: toennes@em.uni-frankfurt.de<br />
1. Introduction<br />
The accused in criminal cases or in cases of driving under the influence of medical drugs<br />
often claims to have taken certain doses of drugs. These statements are usually understated or<br />
exaggerated to suit individual needs. The <strong>for</strong>ensic toxicologist has the task to judge this<br />
statement on the basis of a <strong>toxicological</strong> analysis result from only a single blood sample. To<br />
do this he must estimate the concentration of the drug according to the stated dose and the<br />
time interval be<strong>for</strong>e blood sampling. This time course of blood concentrations in the body is<br />
described by pharmacokinetic equations, which comprise different properties of a specific<br />
drug. The basic principle consists of absorption of the drug into the body and excretion of the<br />
drug out of the body (this is reduced to the absorption into blood and elimination from blood).<br />
The absorption of an orally applied drug into the blood usually follows an exponential<br />
function. The time interval, during which the amount of drug in the intestine is halved is<br />
called the half-life of absorption or t½ A. The time interval, during which the concentration in<br />
the blood is halved is called half-life of elimination or t½ E (also an exponential function).<br />
Three factors influence the process of absorption of an orally applied drug. First, a given dose<br />
is not absorbed entirely, and second, a part of the absorbed drug is metabolized by the liver<br />
be<strong>for</strong>e it can reach the blood (first-pass effect). Thus the fraction of a given dose of drug,<br />
which finally reaches the blood, is called bioavailability or f with unit percent. Bioavailability<br />
is the comparison of an orally applied dose to the same dose applied intravenously. A third<br />
factor is, that the drug stays not only in the blood but is distributed throughout the body. A<br />
correction factor <strong>for</strong> this distribution between blood and body is called distribution volume or<br />
Vd. It is usually given in liter per kilogram of body weight.<br />
With these parameters (f, t½ A, t½ E, Vd) the time course of blood concentrations can be<br />
simulated using the pharmacokinetic equation (1). The Ka and Ke values result from<br />
conversion of t½ A and t½ E (K = ln(2)/t½). The calculation of this equation with a pocket<br />
calculator is a great ef<strong>for</strong>t, there<strong>for</strong>e a macro package was developed ("AutoKinetic", [4]),<br />
which is an easy to use Microsoft Excel ® -based pharmacokinetic simulation program.<br />
C =<br />
f<br />
Vd ⋅<br />
⋅ D ⋅ Ka<br />
( ) ( −Ke⋅t<br />
−Ka⋅t<br />
⋅ e − e )<br />
Ka − Ke<br />
(1)<br />
2. Concept of "AutoKinetic"<br />
Microsoft Excel ® is a well known spreadsheet program which allows very flexible data<br />
handling and includes a complete programming language (Visual Basic <strong>for</strong> Applications,<br />
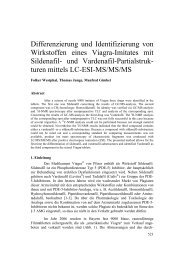
VBA). "AutoKinetic" in the current version provides spreadsheets as user interface and a set<br />
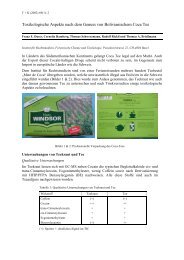
of command buttons (Figure 1), which execute the actual simulation program and some<br />
further features, all written in VBA. For a pharmacokinetic simulation the essential<br />
pharmacokinetic parameters of a drug must be entered: body weight (BW, case dependent),<br />
bioavailability (f), half-life of absorption (t½ A) or alternatively the time of the maximal
lood concentration (t max), the distribution volume (Vd), the elimination half-life (t½ E), the<br />
start time and end time of the simulation, the time interval between simulated data points and<br />
finally the dose of the drug. On pressing the "Calculate" button (pocket calculator icon) the<br />
program per<strong>for</strong>ms the simulation and enters the time and concentration data points in the<br />
spreadsheet and automatically generates (or updates) a diagram of the data. A special feature<br />
of the program is the possibility to freely define application of multiple doses.<br />
Figure 1: Screenshot of the spreadsheet "AutoChronic" with all essential user interface elements and a sample<br />
simulation.<br />
3. Gathering pharmacokinetic parameters<br />
The parameters needed <strong>for</strong> simulation must be gathered from literature. This can be specific<br />
scientific reports on the pharmacokinetic properties of a certain drug, but there are also other<br />
sources of in<strong>for</strong>mation. From my knowledge there is only one compendium, that contains lots<br />
of medical drugs and usually provides all necessary pharmacokinetic data (along with further<br />
details): the German "Fachin<strong>for</strong>mation" [1]. In most cases f, t½ E, Vd and t max are given. It<br />
is not necessary to know the t½ A, which is given only <strong>for</strong> a few drugs, as from the t max the<br />
necessary t½ A can be estimated. This is accomplished using an iterative algorithm, which is<br />
implemented in "AutoKinetic". Vd is in some cases also not available, but in these cases other<br />
data is available (the clearance or a dose and corresponding AUC) from which the Vd can be<br />
estimated (a feature also provided by the program).<br />
Other literature may also be helpful. The Baselt/Cravey [2] contains t max, t½ E and Vd<br />
in<strong>for</strong>mation but lacks the very important bioavailability. An advantage is, that it provides<br />
specific data on half-lives, C max and t max values from different scientific studies. Another
very valuable source of pharmacokinetic data is the compilation of Haen/Forth [3], but only<br />
very few substances are assembled yet.<br />
A bit of a thought should be given to the unit of the calculation result, which is amount of<br />
drug per volume. The unit of the volume is linked to the unit of the distribution volume which<br />
on the other hand derives from the concentration unit used in the original pharmacokinetic<br />
study of a certain drug. As concentrations are usually determined in mg per liter of<br />
serum/plasma, the resulting concentrations from the pharmacokinetic simulation do there<strong>for</strong>e<br />
also refer to serum/plasma and can not be taken as whole blood concentrations (if not<br />
specified otherwise). Another aspect is the unit of the amount of drug. This is linked to the<br />
unit of the calculated dose. If a dose of a drug would be defined in mmol, the unit of the<br />
simulated concentration would be mmol/l. If a 10 mg dose of morphine sulfate pentahydrate<br />
would be given, the simulation result would be mg morphine sulfate pentahydrate per liter of<br />
serum/plasma. As concentrations from <strong>toxicological</strong> analyses are usually mg of free drug per<br />
liter of serum/plasma, the dose must be corrected <strong>for</strong> the difference be<strong>for</strong>e calculation (weight<br />
ratio of e.g. morphine base and morphine salt).<br />
4. Strategy <strong>for</strong> pharmacokinetic evaluation of a <strong>for</strong>ensic case<br />
The first task is to compile a validated set of pharmacokinetic parameters with which realistic<br />
results can be obtained. The problem lies in most cases in a broad range of interindividual<br />
differences (especially t½ E and Vd). For first estimation of the biologic diversity, it might be<br />
helpful to compile a set of parameters, with which minimal blood concentrations are obtained<br />
and another set of parameters, with which maximal blood concentrations are obtained.<br />
Minimal blood concentrations result from low f, long t½ A and t max, large Vd and short t½<br />
E (<strong>for</strong> maximal concentrations vice versa.) The most realistic parameters lie somewhere in<br />
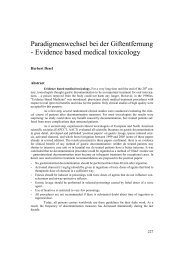
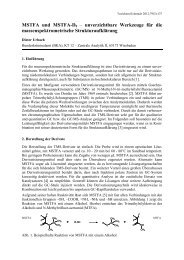
between, as demonstrated in Figure 2. As in the literature extremes may be given (e.g. long<br />
elimination half-lives in patients with hepatic disorders), the average of a given range is<br />
usually not appropriate. It would be better to chose parameters on the basis of specific (and<br />
coherent) study results.<br />
Selection of parameters should be directed to yield realistic simulation results. For this<br />
purpose at least one certain example from literature should be used as template (e.g. from<br />
bioavailability studies). If the simulation result (C max) of a single dose application matches<br />
reported concentrations, another example should be tried which should be a chronic<br />
administration. In this example attention should also be directed towards a possible<br />
cumulation of the drug. If these simulation results also agree with reported concentrations, the<br />
selected parameters can be accepted and be applied to the <strong>for</strong>ensic case (two examples <strong>for</strong> the<br />
described validation procedure are given later).<br />
For <strong>simulations</strong> according to statements of accused in <strong>for</strong>ensic cases the time range should<br />
start with the date/time of the first dose and end at the date/time of blood sampling. The body<br />
weight of the subject should be taken but all other parameters should be used unchanged. In<br />
case that the simulation result differs markedly from the measured concentration (which is,<br />
from my experience, mostly the case), the next step would be to check, if a parameter has to<br />
be adjusted to specific circumstances of the individual case. This is often true <strong>for</strong> the<br />
distribution volume, which is usually based on studies with young and healthy men. In older<br />
or obese persons the distribution volume might need an increase while in case of emaciated<br />
persons it might need a decrease. If still a marked difference is observed, the statements of the<br />
accused do not sufficiently explain the analytical result and can be judged as false.
Figure 2: Screenshot of the spreadsheet "AutoMinMax" with an example of minimized and maximized blood<br />
concentrations and a set <strong>for</strong> acceptable realistic parameters.<br />
In most cases the measured concentrations are much higher than the calculated values and it<br />
should be tried to estimate a minimum single dose with which the concentration can be<br />
reached. There<strong>for</strong>e <strong>simulations</strong> with increasing single doses are carried out where the start<br />
time lies t max hours be<strong>for</strong>e the time of blood sampling. Hereby the maximum blood<br />
concentration is reached at the time of blood sampling. A complementary approach is to<br />
simulate a chronic application with which the measured concentration can be explained. All<br />
these results can finally be incorporated into the <strong>for</strong>ensic <strong>toxicological</strong> expertise.<br />
It is of great importance, that during all <strong>simulations</strong> the toxicologist should be aware of the<br />
limitations of the model used. In most cases a fast distribution phase with at least a second<br />
distribution compartment is to be expected. The differences between 1 compartment model<br />
(CM1) and 2 compartment model (CM2) are, that in the CM2 the maximal concentration (C<br />
max) is higher than in CM1 and that later concentrations are lower. However, a rough<br />
estimation may be possible with the CM1. Though "AutoKinetic" provides the possibility to<br />
per<strong>for</strong>m <strong>simulations</strong> with the CM2, the necessary parameters are not always accessible<br />
(especially not <strong>for</strong> older substances). One should also be aware, that the chosen parameters<br />
may have a large interindividual variability and other modifying effects like enhanced or<br />
decreased metabolism might be of relevance. It should also be mentioned, that in intoxication<br />
cases serious deviations can be expected. A <strong>for</strong>ensic <strong>toxicological</strong> expertise should always be<br />
presented with such reservations and caution.
5. Proposed structure of a <strong>for</strong>ensic <strong>toxicological</strong> expertise on pharmacokinetic<br />
<strong>simulations</strong>.<br />
The simulation model must be comprehensibly explained. The source of data must be given<br />
and the biologic variation of each pharmacokinetic parameter must be explained. The basis of<br />
the parameter selection should be discussed and it must be demonstrated, that the selected<br />
parameters are effective in the simulation of a single and multiple doses of the drug. Also the<br />
limitations of the model should be explained. The results of the case related simulation must<br />
be discussed (e.g. adaptation of parameters, if reasonable) and potential single and multiple<br />
doses should be offered, with which the measured concentration can be explained.<br />
The most severe limitation of this kind of simulation is, that in an individual case generalized<br />
parameters are used which might be invalid under certain circumstances, e.g. comedication<br />
with inhibitors of hepatic metabolism or hepatic disorders may prolong the elimination halflife<br />
and lead to wrong simulation results. There<strong>for</strong>e it is important to present all evaluation<br />
results with due reservation.<br />
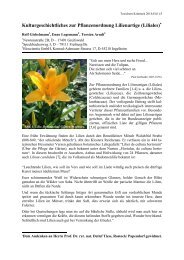
Example 1: Simulation of zolpidem concentrations after oral application<br />
Used literature: Fachin<strong>for</strong>mation Stilnox and the monograph Zolpidem from Haen/Forth:<br />
Wirkstoffprofile für die Arzneimitteltherapie.<br />
<strong>Pharmacokinetic</strong> parameters of zolpidem: f is given as 70%, Vd is given as 0.54 l/kg and<br />
0.34 l/kg in older persons, t½ E is given as 2.4 h and t½ A can be estimated from the given<br />
t max of 0.5-3 h and t½ E of 2.4 h yielding 0.11-1.81 h.<br />
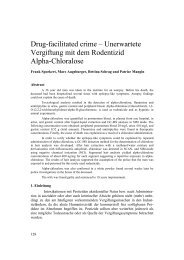
As Stilnox contains a 10 mg dose of zolpidem as tartrate salt, the calculated concentrations<br />
must be corrected (10 mg zolpidem tartrate contain 8.03 mg of free base). A simulation of an<br />
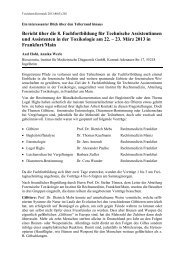
oral dose of 10 mg yields C max values from 58 to 118 µg/l (Figure 3). In Haen/Forth the<br />
zolpidem plasma concentration after a single 10 mg zolpidem dose is reported as 139 µg/l,<br />
which is near to the calculated 118 µg/l (using a t max of 0.5 h). The same calculation <strong>for</strong> a<br />
single 20 mg dose yields similar results: calculated Cmax is 236 µg/l, given Cmax is 260 µg/l.<br />
When using a t max of 1 hour (reported <strong>for</strong> the 10 mg single dose) the Cmax values are a bit<br />
lower.<br />
160<br />
140<br />
C/t-plot of Zolpidem (oral administration)<br />
Concentration [µg*/l]<br />
120<br />
100<br />
80<br />
60<br />
40<br />
20<br />
0<br />
tmax=3 h<br />
tmax=0.5 h<br />
tmax=1 h<br />
0 2 4 6 8 10 12 14 16 18 20 22 24<br />
Time [Hours]<br />
Figure 3:<br />
Simulation of a single 10 mg dose of zolpidem tartrate. The reported<br />
Cmax is indicated by a horizontal line.
C/t-plot of Zolpidem (oral administration)<br />
tmax=3 h tmax=0.5 h tmax=1 h<br />
250<br />
Concentration [µg*/l]<br />
200<br />
150<br />
100<br />
50<br />
0<br />
0 1 2 3 4 5<br />
Time [Days]<br />
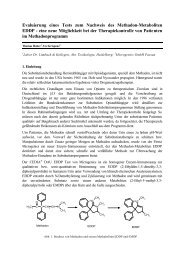
Figure 4: Simulation of a chronic application of 20 mg zolpidem tartrate over five<br />
days. The reported Cmax is indicated by a horizontal line.<br />
The selected simulation parameters yield zolpidem concentrations, that resemble those<br />
reported <strong>for</strong> single and multiple dose applications. There<strong>for</strong>e this model can be used <strong>for</strong> the<br />
simulation in a <strong>for</strong>ensic case of suspected driving under the influence of drugs: a 49 year old<br />
man (80 kg, 184 cm) claimed to have taken one tablet Stilnox at 17:30. The blood sample was<br />
taken at 18:45 and the zolpidem concentration was determined as 160 µg/l.<br />
For simulation the parameters are used as above (f=0.7, t max 1 h, Vd 0.54 l/kg, t½ E 2.4 h)<br />
and the individual body weight of 80 kg is used. As the man is not young and a different Vd is<br />
given <strong>for</strong> older persons (Fachin<strong>for</strong>mation Stilnox: 0.34 l/kg) this value is also used <strong>for</strong><br />
comparison (Figure 5). Fazit: the simulation results are in rough agreement with the statement<br />
of the man.<br />
Concentration [µg*/l]<br />
C/t-plot of Zolpidem (oral administration)<br />
180<br />
160<br />
140<br />
120<br />
100<br />
80<br />
60<br />
Vd = 0,54<br />
40<br />
Vd = 0,34<br />
20<br />
0<br />
0,0 0,2 0,4 0,6 0,8 1,0 1,2<br />
Time [Hours]<br />
Figure 5: Simulation of the intake of one tablet Stilnox in a <strong>for</strong>ensic case. The<br />
measured value of 160 µg/l is indicated by a horizontal line.
In another <strong>for</strong>ensic case of suspected driving under the influence of drugs, a 60 year old<br />
woman (70 kg) claimed to have taken 4 tablets Stilnox at 0:00 and another 2 tablets at 2:00.<br />
At 11:50 a blood sample was collected and zolpidem was determined as 1700 µg/l. This can<br />
be simulated using the selected parameters. The Vd of 0.34 l/kg <strong>for</strong> older persons is used from<br />
which higher concentrations result, which is in favor of the woman. As can be seen clearly<br />
from the simulation diagram (Figure 6), the statement of the woman is not at all sufficient to<br />
explain the high value measured. For the <strong>for</strong>ensic toxicologist two questions arise: what<br />
would be the minimal dose to yield the measured concentrations and what dose would be<br />
necessary <strong>for</strong> a chronic intake?<br />
Concentration [µg*/l]<br />
C/t-plot of Zolpidem (oral administration)<br />
1.800<br />
1.600<br />
1.400<br />
1.200<br />
1.000<br />
800<br />
600<br />
Zolpidem<br />
400<br />
200<br />
0<br />
0 1 2 3 4 5 6 7 8 9 10 11 12<br />
Time [Hours]<br />
Figure 6: Simulation of the intake of 4 tablets Stilnox at 0:00 and additional 2 tablets<br />
two hours later. Blood sample was collected 11.75 hours later and contained<br />
1700 µg/l zolpidem (indicated by horizontal line).<br />
1.800<br />
C/t-plot of Zolpidem (oral administration)<br />
Concentration [µg*/l]<br />
1.600<br />
1.400<br />
1.200<br />
1.000<br />
800<br />
600<br />
400<br />
200<br />
0<br />
Single dose<br />
Multiple doses<br />
0 2 4 6 8 10 12 14 16 18 20 22 24<br />
Time [Hours]<br />
Figure 7: Simulation of the intake of a single overdose of 10 tablets Stilnox and of the<br />
chronic intake of 4 tablets Stilnox every 2 hours. The measured concentration<br />
is indicated by a horizontal line.
For solving the first question, the dose must hypothetically be applied tmax hours prior to<br />
blood sampling (i.e. 10:50 <strong>for</strong> a t max of 1 hour) to reach maximal concentrations. By<br />
increasing the dose and recalculation, a single (over)dose of 10 tablets Stilnox (corresponding<br />
to 100 mg zolpidem tartrate) yields a concentration of 1761 µg/l (Figure 7). However, the<br />
intake of a single overdose is not very likely in the actual case. For simulation of a chronic<br />
intake a time range of two days is sufficient, as the maximal cumulation is reached soon. By<br />
varying the daily dosing scheme up to 40 mg every two hours the simulated concentrations lie<br />
within a range of 1300 and 1800 µg/l (Figure 7).<br />
The case can be finally judged insofar, that the statement of the woman is insufficient and an<br />
overdose of 10 tablets Stilnox or a minimum of five repeated 40 mg doses in 9 hours are<br />
necessary to reach the measured concentration of 1700 µg/l.<br />
Example 2:<br />
Simulation of nortilidine concentrations after oral application of tilidine<br />
hydrochloride solution<br />
Used literature: Fachin<strong>for</strong>mation "Tilimerck 50 mg/-Lösung" and "Valoron N retard".<br />
In this example, not the parent compound is the target, but its active metabolite nortilidine. It<br />
can be assumed, that tilidine is almost completely converted to nortilidine in the first pass of<br />
the liver, there<strong>for</strong>e the simulation is based on the application of tilidine hydrochloride but the<br />
resulting concentrations are of nortilidine. <strong>Pharmacokinetic</strong> parameters <strong>for</strong> nortilidine are:<br />
t½ E is 3-5 h, f is 98% (referring to nortilidine from oral and i.v. application of tilidine), t½ A<br />
can be estimated from the given t max of 0.86 h (solution) and an average t½ E of 4 h yielding<br />
0.18 h. Vd can be estimated from the given AUC of 1026 µg/l*h resulting from a dose of<br />
83.8 mg nortilidine (100 mg tilidine hydrochloride), the average t½ E of 4 h and a<br />
hypothetical body weight of 75 kg (male volunteers) yielding 6.15 l/kg. The applied dose of<br />
tilidine hydrochloride (MW 309 g/mol) must be adjusted in order to get nortilidine<br />
concentrations (MW 259 g/mol). A simulation of an oral application of 100 mg tilidine<br />
hydrochloride yields C max values from 146 to 156 µg/l (Figure 8), which is near to the<br />
reported 160 – 180 µg/l.<br />
180<br />
C/t-plot of Nortilidine (solution of tilidine<br />
hydrochloride) (oral administration)<br />
Concentration [µg*/l]<br />
160<br />
140<br />
120<br />
100<br />
80<br />
60<br />
40<br />
20<br />
0<br />
t 1/2 E = 3 h<br />
t 1/2 E = 4 h<br />
t 1/2 E = 5 h<br />
0 2 4 6 8 10 12 14 16 18 20 22 24<br />
Time [Hours]<br />
Figure 8: Simulation of nortilidine concentrations after oral application of 100 mg<br />
tilidine hydrochloride in solution. The elimination half-life is varied (3–5 h).
In the Fachin<strong>for</strong>mation <strong>for</strong> Valoron N retard an example is given <strong>for</strong> a chronic application of<br />
four times 50 mg of tilidine hydrochloride solution per day. The simulation with the above<br />
selected parameters and elimination half-lives of 3 and 4 hours yields Figure 9. The result is<br />
very similar to the figure in the Fachin<strong>for</strong>mation Valoron N retard, especially with the t½ E of<br />
3 h (which can be estimated from that figure).<br />
C/t-plot of Nortilidine (solution of tilidine<br />
hydrochloride) (oral administration)<br />
t 1/2 E = 3 h<br />
t 1/2 E = 4 h<br />
140<br />
Concentration [µg*/l]<br />
120<br />
100<br />
80<br />
60<br />
40<br />
20<br />
0<br />
48 60 72<br />
Time [Hours]<br />
Figure 9: Simulation of nortilidine concentrations after repeated oral applications of<br />
50 mg tilidine hydrochloride in solution (four times per day).<br />
C/t-plot of Nortilidine (tilidine hydrochloride<br />
capsules) (oral administration)<br />
1.200<br />
Vd = 6.15 Vd = 5.15 Vd = 4.15<br />
Concentration [µg*/l]<br />
1.000<br />
800<br />
600<br />
400<br />
200<br />
0<br />
0 12 24 36 48 60 72 84<br />
Time [Hours]<br />
Figure 10: Simulation of nortilidine concentrations after repeated oral application of<br />
300 mg tilidine hydrochloride capsules (four times per day).<br />
The selected simulation parameters yield nortilidine concentrations, that resemble those<br />
reported <strong>for</strong> single and multiple dose applications of a solution of tilidine hydrochloride. This
model can be used <strong>for</strong> the simulation in a <strong>for</strong>ensic case of suspected driving under the<br />
influence of drugs: a 24 year old man (69 kg, 184 cm) claimed to take 25 capsules Valoron<br />
per day, the last six at 23:30. The blood sample was taken at 2:15 the next day and the<br />
nortilidine concentration was determined as 870 µg/l.<br />
For simulation the parameter t½ A needs adjustment <strong>for</strong> capsules (t max 1.22 h => t½ A<br />
0.3 h) and the individual body weight of 69 kg is used. The dosing scheme is defined as four<br />
doses of 300 mg tilidine hydrochloride capsules (24 capsules per day), the last at 23:30. As<br />
the man has a weight of only 69 kg with 184 cm height, a smaller distribution volume is<br />
probable (e.g. 5.15 or 4.15 l/kg instead of 6.15 l/kg). The simulation time range is extended<br />
over four days to allow accumulation of multiple doses and the end is the time of blood<br />
sampling. The simulation result (Figure 10) with default parameters lies markedly below the<br />
measured value but in the present case the individual circumstances should be considered by<br />
decreasing the distribution volume. Fazit: these results may confirm the statement of the man.<br />
References<br />
[1] FachInfo: Fachin<strong>for</strong>mationsverzeichnis Deutschland (einschließlich EU-Zulassungen), BPI Service<br />
GmbH (2000)<br />
[2] R.C. Baselt, R.H. Cravey: Disposition of Toxic Drugs and Chemicals in Man, Chemical Toxicology<br />
Institute (1995)<br />
[3] E. Haen, W. Forth: Wirkstoffprofile für die Arzneimitteltherapie: Datenblätter für Ärzte und Apotheker,<br />
experimentelle und klinische Pharmakologen, ecomed verlagsgesellschaft AG & Co. KG (1999)<br />
[4] S.W. Toennes, H.H. Maurer: Microsoft Excel in pharmacokinetics - An easy way to solve kinetic<br />
problems in clinical toxicology, legal medicine or doping control. In: H. Sachs, W. Bernhard, A. Jeger:<br />
Proceedings to: 34th International TIAFT Meeting, Interlaken, 11.-15.8.1996. Molina-Press, Leipzig,<br />
1997, pp 201-204