Semi-quantitative determination of concentrations in ... - GTFCh
Semi-quantitative determination of concentrations in ... - GTFCh
Semi-quantitative determination of concentrations in ... - GTFCh

Create successful ePaper yourself
Turn your PDF publications into a flip-book with our unique Google optimized e-Paper software.
Toxichem Krimtech 2011;78(Special Issue):230<br />
<strong>Semi</strong>-<strong>quantitative</strong> Determ<strong>in</strong>ation <strong>of</strong> Concentrations <strong>in</strong> Systematic Toxicological Analysis<br />
by LC-QTOF-MS<br />
Sebastian Broecker, Fritz Pragst, Gregor Kopf, Max Koch, S<strong>in</strong>a Wuttig, Siegl<strong>in</strong>de Herre<br />
Institute <strong>of</strong> Legal Medic<strong>in</strong>e, University Hospital Charité, Turmstr. 21, 10559 Berl<strong>in</strong>, Germany<br />
Key words: Accurate mass spectra library, General unknown screen<strong>in</strong>g, Liquid<br />
chromatography-mass spectrometry, <strong>Semi</strong>-<strong>quantitative</strong> concentration, Time-<strong>of</strong>-flight mass<br />
spectrometry.<br />
Abstract<br />
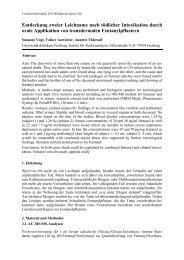
Aim: Besides the unambiguous identification, the concentration is an important prerequisite<br />
for toxicological <strong>in</strong>terpretation. Therefore, a procedure for semi-<strong>quantitative</strong> estimation <strong>of</strong><br />
<strong>concentrations</strong> from the LC-QTOF-MS areas <strong>of</strong> identified peaks was developed and exam<strong>in</strong>ed<br />
by application to spiked and real blood, and hair samples.<br />
Methods: The retention times and peak areas <strong>of</strong> more than 2,100 toxic substances were measured<br />
by LC-QTOF-MS at an Agilent 6530 <strong>in</strong>strument under standardized conditions by <strong>in</strong>jection<br />
<strong>of</strong> 100 pg substance together with each 100 pg <strong>of</strong> 33 deuterated standards with retention<br />
times evenly spread over the run time. All data are stored <strong>in</strong> a database LC-TOF-QUANT. In<br />
practical application, the sample preparation (prote<strong>in</strong> precipitation, extraction <strong>of</strong> hair) was<br />
performed after addition <strong>of</strong> all 33 standards and the extracts were measured by LC-QTOF-MS<br />
<strong>in</strong> data dependent acquisition mode under the same standard conditions. For each identified<br />
peak, an <strong>in</strong>-house developed s<strong>of</strong>tware tool “Estimate Concentration” selects a certa<strong>in</strong> number<br />
(e.g. five) nearby elut<strong>in</strong>g deuterated standards, extracts the correspond<strong>in</strong>g standard peak areas<br />
<strong>of</strong> the analyte and selected deuterated standards from LC-TOF-QUANT and calculates the<br />
(five) <strong>concentrations</strong> <strong>in</strong> usual way. The (five) results are tested for outliers which are omitted<br />
and the mean concentration and standard deviation are calculated.<br />
Results and Discussion: The method was tested at spiked and real blood and hair samples. For<br />
blood samples which were spiked with 31 illegal and therapeutic drugs the measured and<br />
spiked <strong>concentrations</strong> were <strong>in</strong> good agreement with a standard deviation between 5 and 30 %.<br />
For hair samples spiked with the same drugs the agreement was even better with standard<br />
deviations between 1 and 15 %. Furthermore, the results from post-mortem blood and hair<br />
samples from real cases agreed well with the <strong>quantitative</strong> data from HPLC-DAD and GC-MS.<br />
Conclusion: The developed method can successfully be used for a fast approximate estimation<br />
<strong>of</strong> <strong>concentrations</strong> also if the reference substance is not available. Investigations about the<br />
applicability at different <strong>in</strong>struments are <strong>in</strong> progress.<br />
1. Introduction<br />
Liquid chromatography-hybrid quadrupole time-<strong>of</strong>-flight mass spectrometry (LC-QTOF-MS)<br />
<strong>in</strong> data dependent acquisition mode was shown to be a very efficient method for substance<br />
identification <strong>in</strong> systematic toxicological analysis (STA) <strong>in</strong>clud<strong>in</strong>g metabolites <strong>in</strong> previous<br />
papers <strong>of</strong> the authors [1-5]. The most important task <strong>in</strong> STA is the unambiguous identification<br />
<strong>of</strong> the poisonous substances. However, at least an approximate concentration is also necessary<br />
for a reasonable toxicological <strong>in</strong>terpretation. In cl<strong>in</strong>ical emergency cases these approximate<br />
<strong>concentrations</strong> should be obta<strong>in</strong>ed <strong>in</strong> a short time. Frequently, particularly for seldom occurr<strong>in</strong>g<br />
poisons, reference substances and validated <strong>quantitative</strong> methods are not available.
Toxichem Krimtech 2011;78(Special Issue):231<br />
For HPLC-DAD a method for semi-<strong>quantitative</strong> <strong>determ<strong>in</strong>ation</strong> <strong>of</strong> <strong>concentrations</strong> from specific<br />
peak areas <strong>of</strong> 1 µg and pre-determ<strong>in</strong>ed extraction yields under standardized conditions was<br />
developed which enabled a fast estimation <strong>of</strong> <strong>concentrations</strong> <strong>of</strong> more than 3,000 substances<br />
and proved to be useful <strong>in</strong> rout<strong>in</strong>e application [6,7].<br />
In the present study, a similar method was developed for LC-QTOF-MS with more than 2,100<br />
toxicologically relevant substances. This method is based on the simplified assumption <strong>of</strong> a<br />
l<strong>in</strong>ear relationship between peak area and concentration (one-po<strong>in</strong>tcalibration). There are<br />
some general difficulties <strong>of</strong> quantification us<strong>in</strong>g LC-MS. The most severe difficulty is that,<br />
different from UV absorbance, there is no stable concentration-response relationship because<br />
<strong>of</strong> variation <strong>of</strong> construction pr<strong>in</strong>ciples <strong>of</strong> the <strong>in</strong>struments (e.g. ion sources, ion optics, mass<br />
filter, detector), <strong>of</strong> tun<strong>in</strong>g (algorithm for optimal ion transfer), <strong>of</strong> measurement parameters<br />
(e.g. voltages, vacuum, gas), LC conditions (e.g. mobile phase, pH, gradient, separation), or<br />
sample preparation. Further problems are caused by matrix effects <strong>in</strong> LC-MS, which means<br />
ion suppression or ion enhancement, especially for ESI ion sources [8-10].<br />
For these reasons, error compensation by <strong>in</strong>ternal standards is always necessary. In targeted<br />
analysis, the use <strong>of</strong> isotopic (deuterated) <strong>in</strong>ternal standards is optimal. However, this cannot<br />
be realized <strong>in</strong> systematic toxicological analysis s<strong>in</strong>ce the substance to be determ<strong>in</strong>ed is not<br />
known before analysis and because <strong>of</strong> the large number <strong>of</strong> possible candidates. Instead, a set<br />
<strong>of</strong> <strong>in</strong>ternal standards with different chemical character and different retention time is applied<br />
<strong>in</strong> the present study. From this set, a certa<strong>in</strong> number (for <strong>in</strong>stance five) are selected and used<br />
to calculate an approximate mean concentration <strong>of</strong> an identified peak.<br />
2. Material and Methods<br />
2.1. Reference substances<br />
The reference substances were generously donated by a large number <strong>of</strong> pharmaceutical firms<br />
or were purchased from LGC Promochem, Sigma-Aldrich, and other providers. A complete<br />
list <strong>of</strong> all substances is given <strong>in</strong> the UV spectra library [7]. All follow<strong>in</strong>g deuterated standards<br />
were obta<strong>in</strong>ed from LGC (Wesel, Germany) and were used <strong>in</strong> all measurements for build<strong>in</strong>g<br />
the database as well as perform<strong>in</strong>g the sample measurements: 2-hydroxyethylflurazepam-D4,<br />
6-acetylmorph<strong>in</strong>e (6-AM)-D3, 7-am<strong>in</strong>oclonazepam-D4, 7-am<strong>in</strong><strong>of</strong>lunitrazepam-D7, !-hydroxyalprazolam-D5,<br />
amphetam<strong>in</strong>e-D5, benzoylecgon<strong>in</strong>e-D3, buprenorph<strong>in</strong>e-D4, clonazepam-<br />
D4, cocaethylene-D3, coca<strong>in</strong>e-D3, code<strong>in</strong>e-D3, desalkylflurazepam-D4, diazepam-D5,<br />
EDDP-D3, estazolam-D5, flunitrazepam-D7, lorazepam-D4, MDA-D5, MDE-D6, MDMA-<br />
D5, methadone-D9, methamphetam<strong>in</strong>e-D5, methylecgon<strong>in</strong>e-D3, morph<strong>in</strong>e-D3,-nitrazepam-<br />
D5, nordiazepam-D5, oxazepam-D5, prazepam-D5, temazepam-D5, THC-D3, THC-COOH-<br />
D3, triazolam-D4.<br />
2.2. Instruments and standard procedure for STA by LC-QTOF-MS<br />
A detailed description <strong>of</strong> all conditions and parameters used for application <strong>of</strong> LC-QTOF-MS<br />
<strong>in</strong> data dependent acquisition mode was described <strong>in</strong> previous papers [1-3]. Therefore, only<br />
some essential data shall be given. The liquid chromatography was performed us<strong>in</strong>g an LC<br />
1200 series (Agilent Technologies) device with a Poroshell 120 EC-18 column (2.1x100 mm<br />
2.7 µm, Agilent Technologies, Waldbronn, Germany) at 50°C. The mobile phases A (10 mM<br />
CH 3 COONH 4 , pH 6.8) and B (methanol) were applied with a flow <strong>of</strong> 0.4 ml/m<strong>in</strong> and the
Toxichem Krimtech 2011;78(Special Issue):232<br />
follow<strong>in</strong>g gradient: 0 m<strong>in</strong> 10% B, l<strong>in</strong>ear to 50 % <strong>in</strong> 8 m<strong>in</strong>, l<strong>in</strong>ear to 100 % <strong>in</strong> 20 m<strong>in</strong> hold for<br />
4 m<strong>in</strong>, 3 m<strong>in</strong> condition<strong>in</strong>g, overall time 24 m<strong>in</strong>.<br />
The MS measurements were performed at a 6530 Accurate-Mass Q-TOF LC-MS device<br />
(Agilent Technologies, Santa Clara, USA). The QTOF-MS <strong>in</strong>strument was operated under the<br />
follow<strong>in</strong>g conditions: Ion source ESI + Agilent Jet Stream Technology <strong>in</strong> positive or negative<br />
ionization mode, the quadrupole was used as an ion guide <strong>in</strong> MS mode and for selection <strong>of</strong><br />
precursor ions with "m/z = 4 <strong>in</strong> MS/MS mode, collision cell without CID <strong>in</strong> MS mode and<br />
with CID <strong>of</strong> precursor ions <strong>in</strong> MS/MS mode at mass dependent ramped CID energy (<strong>of</strong>fset 4<br />
eV, slope 6 eV/100 m/z), TOF-MS with a mass range <strong>of</strong> 100-1000 m/z <strong>in</strong> MS mode and 50-<br />
600 m/z <strong>in</strong> MS/MS mode. The scan rate was 4 Hz <strong>in</strong> MS and MS/MS experiments. The<br />
source parameters were: gas temperature 320 °C, gas flow 8 L/m<strong>in</strong>, nebulizer pressure 35 psi,<br />
sheath gas temperature 380 °C, sheath gas flow 11 L/m<strong>in</strong>, VCap voltage 3000 V, nozzle voltage<br />
0 V and fragmentor voltage 150 V.<br />
The LC-QTOF-MS device was operated by the s<strong>of</strong>tware MassHunter Acquisition B.02.01<br />
with Service Pack 3 for the Agilent TOF and QTOF and MassHunter Qualitative Analysis<br />
B.03.01 with Service Pack 3. The Personal Compounds Database and Library S<strong>of</strong>tware<br />
B.03.01 [1,4] was used for peak identification.<br />
2.3. Development <strong>of</strong> the database LC-TOF-QUANT<br />
The retention times and peak areas <strong>of</strong> more than 2,100 substances were measured under the<br />
conditions described section 2.2 <strong>in</strong> groups <strong>of</strong> 50 substances together with all 33 deuerated<br />
standards given <strong>in</strong> section 2.1. For this purpose, each 100 pg <strong>of</strong> the 50 substances and <strong>of</strong> the<br />
33 deuterated standards <strong>in</strong> 1 µl methanol were <strong>in</strong>jected. Each measurement was performed <strong>in</strong><br />
three replicates. Each peak was identified by CID spectrum and the retention was recorded.<br />
The monoisotopic masses <strong>of</strong> all detected ion species <strong>of</strong> a substance (adducts with H + , Na + , K + ,<br />
NH 4 + ), were extracted with a mass w<strong>in</strong>dow <strong>of</strong> 60 ppm and the peak areas were registered<br />
separately for these ions and for the sum <strong>of</strong> all four ions. The database conta<strong>in</strong>s for every substance<br />
the retention time and the standard peak areas <strong>of</strong> all possible ion species (average <strong>of</strong><br />
the three measurements).<br />
2.4. Sample preparation<br />
Details <strong>of</strong> the sample preparation are given <strong>in</strong> previous papers [1-3]. In this study, prote<strong>in</strong><br />
precipitation <strong>of</strong> blood samples with acetonitrile and extraction <strong>of</strong> hair with an acetonitrile/methanol/formic<br />
acid mixture were applied.<br />
Blood: 100 µL whole blood were placed <strong>in</strong> a 1.5 mL Eppendorf vial and 5 µl <strong>of</strong> a solution<br />
conta<strong>in</strong><strong>in</strong>g each 1 ng/µl <strong>of</strong> all deuterated standards and 400 µL acetonitrile were added. The<br />
mixture was vortexed for 1 m<strong>in</strong> and centrifuged for 5 m<strong>in</strong> at 13,200 rpm. Then, 400 µL<br />
supernatant were separated and evaporated to dryness <strong>in</strong> a nitrogen stream at 40 °C. The residue<br />
was reconstituted <strong>in</strong> 80 µL ACN / 0.1 % HCOOH (35:65 v/v). 5 µL were <strong>in</strong>jected for LC-<br />
QTOF-MS.<br />
Hair: In case <strong>of</strong> longer hair samples, the proximal segment 0-6 cm was analyzed. Shorter hair<br />
samples were analyzed <strong>in</strong> full length. The samples were decontam<strong>in</strong>ated by gentle shak<strong>in</strong>g for<br />
1 m<strong>in</strong> <strong>in</strong> water and two times for 1 m<strong>in</strong> <strong>in</strong> acetone. After dry<strong>in</strong>g on a filter paper the hair was<br />
cut to 1-2 mm pieces and about 20 mg were exactly weighed <strong>in</strong> a 1.5 ml Eppendorf vial. After<br />
addition <strong>of</strong> the mixture <strong>of</strong> deuterated standards (5 µl <strong>of</strong> each 1 ng/µl) the hair was <strong>in</strong>cubated<br />
for 18 h with 0.5 ml <strong>of</strong> a mixture <strong>of</strong> methanol/acetonitrile/2mM ammonium formate
Toxichem Krimtech 2011;78(Special Issue):233<br />
(25:25:50, v/v/v) with gentle shak<strong>in</strong>g at 37 °C. Then the mixture was centrifuged for 5 m<strong>in</strong> at<br />
13,200 rpm. The liquid phase was separated and the <strong>in</strong>cubation <strong>of</strong> the hair pieces was<br />
repeated for 18 h with another 0.5 ml <strong>of</strong> the solvent mixture. Both extracts were united and<br />
evaporated <strong>in</strong> a nitrogen stream to a residue <strong>of</strong> 0.5 ml <strong>in</strong> order to remove the most <strong>of</strong> the<br />
organic solvents. 5 µl <strong>of</strong> the residue were <strong>in</strong>jected for LC-QTOF-MS measurement without<br />
further clean-up procedures.<br />
3. Results and Discussion<br />
3.1. The database LC-TOF-QUANT<br />
The database LC-TOF-QUANT was measured <strong>in</strong> MS mode <strong>of</strong> the <strong>in</strong>strument absence <strong>of</strong> any<br />
matrix and conta<strong>in</strong>s for each <strong>of</strong> the more than 2,100 substances and for the 33 deuterated<br />
standards the substance name, the retention time, and the peak areas <strong>of</strong> 100 pg for all ion species<br />
(mean values <strong>of</strong> three measurements). An excerpt is shown <strong>in</strong> Table 1. It was observed<br />
dur<strong>in</strong>g the measurement <strong>in</strong> triplicate <strong>of</strong> the about 45 solutions <strong>of</strong> each 50 substances which<br />
conta<strong>in</strong>ed always the 33 deuterated standards that the peak areas <strong>of</strong> the deuterated standards<br />
did not vary to an essential extent over the whole measurement period. Therefore, the peak<br />
areas <strong>of</strong> the toxic substances had not to be corrected <strong>in</strong> relation to the deuterated standards<br />
before enter<strong>in</strong>g <strong>in</strong>to the database but could be directly entered.<br />
Tab. 1. Excerpt <strong>of</strong> the database LC-TOF-QUANT.<br />
Substance name RT Paek areas <strong>of</strong> 100 pg, counts<br />
m<strong>in</strong> M + [M+H] + [M+Na] + [M+K] + [M+NH 4 ] + Sum 1 1 Sum 2 1 [M-H] -<br />
Acetazolamide 1.40 --- 19094 98807 15850 --- 118733 134684 ---<br />
Acetylam<strong>in</strong>onitropropoxybenzene<br />
9.33 --- 2910232 317561 --- 109212 3334814 3392164 ---<br />
Acriflav<strong>in</strong>ium 5.65 1202478 --- --- --- --- --- --- ---<br />
Ajmal<strong>in</strong>e 7.00 --- 51880897 --- --- --- 5279504 5261400 ---<br />
Allobarbital 5.82 --- --- --- --- --- --- --- 5481<br />
Am<strong>in</strong>oqu<strong>in</strong>uride 10.82 --- --- 40637 --- --- 40637 40637 ---<br />
Am<strong>in</strong>ophenazone 7.32 --- 4502281 222378 15240 --- 4722476 4742589 ---<br />
Amiodarone 20.11 --- 5073641 --- --- --- 5089228 5088671 ---<br />
Amitriptyl<strong>in</strong>e 13.11 --- 4587099 --- --- --- 4587099 4587099 ---<br />
Amobarbital 9.52 --- --- --- --- --- --- --- 13646<br />
Amr<strong>in</strong>one 2.75 --- 206583 --- --- --- 209156 209156 ---<br />
Atraz<strong>in</strong>e 10.16 --- 2693485 --- --- --- 2685126 2684544 ---<br />
Atrop<strong>in</strong>e 5.01 --- 3691602 24966 --- --- 3725074 3737983 ---<br />
Acebutolol 6.36 --- 4201908 42504 --- --- 4245109 4265149 5362<br />
Azidamfenicol 4.25 --- --- 157687 154033 --- 157687 312600 302263<br />
Acetanilide 4.21 --- 589364 --- --- --- 589364 589364 ---<br />
Alprazolam 10.87 --- 4833592 1118202 --- --- 5951459 6030845 ---<br />
Alprenolol 9.23 --- 7268153 59076 --- --- 7347363 7249966 ---<br />
Amantad<strong>in</strong>e 5.29 --- 3062036 --- --- --- 3057832 3057460 ---<br />
1 Sum 1 = [M+H] + + [M+Na] + + [M+NH 4 ] + ; Sum 2 = [M+H] + + [M+Na] + + [M+K] + + [M+NH 4 ] +<br />
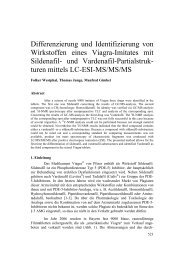
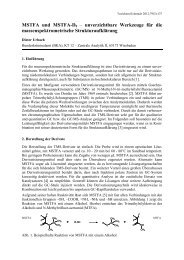
The distribution <strong>of</strong> the retention times <strong>of</strong> all substances is shown <strong>in</strong> Fig. 1. It can be seen from<br />
the cumulative plot that the substances are well distributed over the run time with a slightly<br />
higher frequency between 7 and 15 m<strong>in</strong>. The deuterated standards are also well spread over<br />
the retention time range. It is important for compensation <strong>of</strong> the matrix effect to have a choice<br />
several nearby elut<strong>in</strong>g deuterated standards for every compound.
Toxichem Krimtech 2011;78(Special Issue):234<br />
Fig. 1. Cumulative plot <strong>of</strong> the retention times <strong>of</strong> more than 2,100 toxicological substances and<br />
33 deuterated standards (circles).<br />
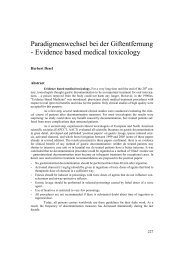
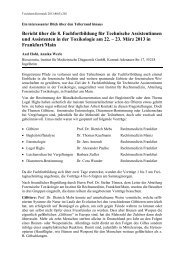
3.2. S<strong>of</strong>tware tool “Estimate Concentration”<br />
The s<strong>of</strong>tware tool “Estimate Concentration” was developed for semi-<strong>quantitative</strong> calculation<br />
<strong>of</strong> the <strong>concentrations</strong> <strong>of</strong> substances which were identified <strong>in</strong> the LC-QTOF-MS analysis file.<br />
The operation scheme is shown <strong>in</strong> Fig. 2 and starts with the result list <strong>of</strong> the search <strong>in</strong> the<br />
database and library which is confirmed by visual control and exported to the tool.<br />
Fig. 2. Operation scheme <strong>of</strong> the s<strong>of</strong>tware tool “Estimate Concentration”.
Toxichem Krimtech 2011;78(Special Issue):235<br />
As manual <strong>in</strong>put only the concentration <strong>of</strong> the deuterated standards <strong>in</strong> the sample, the ion species<br />
used (adduct with H + , Na + , K + and/or NH 4 + ), and the number <strong>of</strong> deuterated standards per<br />
analyte used from the 33 for quantification are necessary. The tool separates the analytes from<br />
the deuterated standards and calculates the concentration <strong>of</strong> one analyte after the other by<br />
select<strong>in</strong>g the chosen number <strong>of</strong> deuterated standard with m<strong>in</strong>imum difference <strong>in</strong> retention<br />
time to the analyte and by use <strong>of</strong> peak areas measured <strong>in</strong> the actual analysis file and stored <strong>in</strong><br />
the database accord<strong>in</strong>g to the follow<strong>in</strong>g equation.<br />
If, for <strong>in</strong>stance, five deuterated standards per analyte were chosen, each five <strong>concentrations</strong><br />
are obta<strong>in</strong>ed. These are checked for outliers which are excluded. Then, the average <strong>concentrations</strong><br />
and the standard deviations are calculated. The result list conta<strong>in</strong>s name, s<strong>in</strong>gle <strong>concentrations</strong>,<br />
average concentration and standard deviation <strong>of</strong> each identified substance, if<br />
<strong>quantitative</strong> data are stored <strong>in</strong> the <strong>in</strong> the database.<br />
The work<strong>in</strong>g pr<strong>in</strong>ciple is demonstrated <strong>in</strong> Table 2 for the <strong>determ<strong>in</strong>ation</strong> <strong>of</strong> code<strong>in</strong>e (spiked<br />
concentration 25 ng/ml) from a blood sample. This is one <strong>of</strong> the rare examples with a strong<br />
outlier.<br />
Tab. 2. Estimation <strong>of</strong> the concentration <strong>of</strong> code<strong>in</strong>e from a blood sample us<strong>in</strong>g the tool<br />
“Estimate Concentration” and the datasbase LC-TOF-QUANT. Spiked concentration<br />
25 ng/ml, Number <strong>of</strong> deuterated standards: 5.<br />
Nr. Deuterated Standard Concentration, ng/ml Outlier<br />
1 Code<strong>in</strong>e-D3 25 No<br />
2 7-Am<strong>in</strong><strong>of</strong>lunitrazepam-D7 24 No<br />
3 6-Acetylmorph<strong>in</strong>e-D3 23 No<br />
4 7-Am<strong>in</strong>oclonazepam-D4 24 No<br />
5 MDE-D6 101 Yes<br />
Average Concentration Total 40<br />
Outlier excluded: 24<br />
Standard deviation Total 88%<br />
Outlier excluded 2.9%<br />
2.3. Application to spiked samples<br />
For test <strong>of</strong> the applicability, five blood samples were spiked with 31 drugs at the <strong>concentrations</strong><br />
5, 25, 100 and 500 ng/ml, analyzed accord<strong>in</strong>g to the procedure described <strong>in</strong> section 2.4<br />
and were quantified us<strong>in</strong>g tool with each five deuterated standards as described <strong>in</strong> Fig. 2. In<br />
the same way, 5 hair samples were spiked with the same drugs at 0.05, 0.25, 1 and 5 ng/mg,<br />
analyzed, and submitted to semi-quantification us<strong>in</strong>g the tool. In Table 3, the mean values and<br />
standard deviations between the five results are given for one <strong>of</strong> the blood samples and one <strong>of</strong><br />
the hair samples. As a criterion, a standard deviation between the five s<strong>in</strong>gle results <strong>of</strong> 30 %<br />
was accepted.
Tab. 3. Application <strong>of</strong> the tool “Estimate Concentration” to a blood sample and a hair sample<br />
spiked with 31 drugs at different <strong>concentrations</strong> and analyzed under standardized conditions.<br />
Analyte<br />
Blood<br />
Concentration <strong>in</strong> ng/ml<br />
(Standard deviation <strong>in</strong> %)<br />
Hair<br />
Concentration <strong>in</strong> ng/mg<br />
(Standard deviation, %)<br />
Spiked Concentration, ng/mg 5.0 25 100 500 0.05 0.25 1.00 5.00<br />
Alprazolam<br />
4.5<br />
(13)<br />
18<br />
(8.4)<br />
117<br />
(6.5)<br />
480<br />
(6.2)<br />
0.068<br />
(5.7)<br />
0.34<br />
(5.0)<br />
1.2<br />
(5.8)<br />
6.7<br />
(4.1)<br />
Amitriptyl<strong>in</strong>e<br />
3.8<br />
(18)<br />
20<br />
(24)<br />
79<br />
(15)<br />
425<br />
(9.8)<br />
0.036<br />
(4.7)<br />
0.25<br />
(2.9)<br />
1.0<br />
(5.3)<br />
7.0<br />
(2.9)<br />
Carbamazep<strong>in</strong>e<br />
5.0<br />
(20)<br />
21<br />
(19)<br />
108<br />
(21)<br />
387<br />
(12)<br />
0.068<br />
(10)<br />
0.32<br />
(14)<br />
1.1<br />
(12)<br />
5.2<br />
(12)<br />
Citalopram<br />
5.6<br />
(20)<br />
21<br />
(19)<br />
118<br />
(21)<br />
496<br />
(12)<br />
0.034<br />
(10)<br />
0.29<br />
(14)<br />
1.1<br />
(10)<br />
7.0<br />
(11)<br />
Clonazepam<br />
3.7<br />
(20)<br />
21<br />
(19)<br />
128<br />
(21)<br />
439<br />
(12)<br />
0.071<br />
(10)<br />
0.34<br />
(14)<br />
1.2<br />
(12)<br />
6.7<br />
(10)<br />
Clozap<strong>in</strong>e<br />
3.9<br />
(18)<br />
16<br />
(24)<br />
82<br />
(15)<br />
431<br />
(9.8)<br />
0.043<br />
(8.3)<br />
0.30<br />
(2.9)<br />
1.1<br />
(5.3)<br />
6.7<br />
(2.9)<br />
Coca<strong>in</strong>e<br />
5.2<br />
(20)<br />
22<br />
(19)<br />
141<br />
(20)<br />
508<br />
(10)<br />
0.068<br />
(10)<br />
0.35<br />
(14)<br />
1.2<br />
(11)<br />
7.3<br />
(12)<br />
Code<strong>in</strong>e<br />
5.2<br />
(20)<br />
23<br />
(26)<br />
123<br />
(21)<br />
558<br />
(18)<br />
0.035<br />
(2.7)<br />
0.28<br />
(2.6)<br />
1.2<br />
(2.6)<br />
6.9<br />
(3.8)<br />
Diazepam<br />
4.2<br />
(11)<br />
23<br />
(11)<br />
111<br />
(11)<br />
481<br />
(8.3)<br />
0.069<br />
(8.9)<br />
0.32<br />
(4.6)<br />
1.1<br />
(6.2)<br />
6.2<br />
(2.3)<br />
Flunitrazepam<br />
6.2<br />
(20)<br />
18<br />
(23)<br />
108<br />
(21)<br />
404<br />
(12)<br />
0.067<br />
(9.1)<br />
0.32<br />
(4.6)<br />
1.0<br />
(12)<br />
5.0<br />
(11)<br />
Hydrocodone<br />
5.2<br />
(18)<br />
28<br />
(25)<br />
148<br />
(20)<br />
473<br />
(13)<br />
0.065<br />
(2.7)<br />
0.27<br />
(2.6)<br />
1.1<br />
(4.8)<br />
6.9<br />
(3.8)<br />
Ketam<strong>in</strong>e<br />
3.2<br />
(20)<br />
17<br />
(23)<br />
90<br />
(21)<br />
429<br />
(12)<br />
0.061<br />
(9.1)<br />
0.30<br />
(14)<br />
1.1<br />
(12)<br />
5.8<br />
(11)<br />
Lorazepam<br />
2.4<br />
(10)<br />
20<br />
(8.4)<br />
125<br />
(6.5)<br />
459<br />
(6.2)<br />
---<br />
0.34<br />
(4.6)<br />
1.2<br />
(4.3)<br />
6.9<br />
(4.1)<br />
MDA<br />
4.8<br />
(26)<br />
23<br />
(25)<br />
99<br />
(18)<br />
499<br />
(20)<br />
0.050<br />
(9.9)<br />
0.34<br />
(7.8)<br />
1.1<br />
(5.0)<br />
6.3<br />
(4.8)<br />
MDEA<br />
4.5<br />
(23)<br />
24<br />
(20)<br />
92<br />
(16)<br />
426<br />
(22)<br />
0.065<br />
(4.0)<br />
0.33<br />
(4.7)<br />
1.1<br />
(8.3)<br />
7.2<br />
(6.7)<br />
MDMA<br />
4.8<br />
(26)<br />
22<br />
(25)<br />
91<br />
(18)<br />
472<br />
(20)<br />
0.062<br />
(4.7)<br />
0.33<br />
(6.0)<br />
1.1<br />
(8.3)<br />
7.0<br />
(4.6)<br />
Methadone<br />
3.6<br />
(14)<br />
19<br />
(26)<br />
97<br />
(11)<br />
463<br />
(8.3)<br />
0.030<br />
(8.9)<br />
0.22<br />
(3.8)<br />
1.2<br />
(6.2)<br />
6.5<br />
(2.3)<br />
Methamphetam<strong>in</strong>e<br />
5.1<br />
(26)<br />
24<br />
(25)<br />
93<br />
(18)<br />
479<br />
(20)<br />
0.052<br />
(4.0)<br />
0.29<br />
(4.7)<br />
1.0<br />
(4.3)<br />
6.6<br />
(4.6)<br />
Metoprolol<br />
4.8<br />
(18)<br />
21<br />
(25)<br />
123<br />
(20)<br />
489<br />
(13)<br />
0.062<br />
(4.6)<br />
0.34<br />
(3.7)<br />
1.2<br />
(4.8)<br />
6.7<br />
(0.8)<br />
Nitrazepam<br />
6.0<br />
(20)<br />
26<br />
(29)<br />
148<br />
(21)<br />
514<br />
(12)<br />
0.067<br />
(10)<br />
0.37<br />
(14)<br />
1.4<br />
(12)<br />
6.5<br />
(12)<br />
Oxazepam<br />
4.0<br />
(13)<br />
16<br />
(8.6)<br />
119<br />
(6.5)<br />
495<br />
(5.3)<br />
0.069<br />
(6.3)<br />
0.31<br />
(6.5)<br />
1.2<br />
(5.8)<br />
5.5<br />
(3.2)<br />
Oxycodone<br />
5.2<br />
(21)<br />
23<br />
(29)<br />
139<br />
(24)<br />
575<br />
(17)<br />
0.025<br />
(2.7)<br />
0.27<br />
(2.6)<br />
1.0<br />
(2.6)<br />
7.1<br />
(3.8)<br />
Pethid<strong>in</strong>e<br />
3.7<br />
(20)<br />
18<br />
(19)<br />
86<br />
(20)<br />
453<br />
(10)<br />
0.049<br />
(10)<br />
0.31<br />
(14)<br />
1.2<br />
(11)<br />
7.2<br />
(12)<br />
Phencyclid<strong>in</strong>e<br />
3.2<br />
(20)<br />
22<br />
(29)<br />
117<br />
(21)<br />
625<br />
(12)<br />
0.043<br />
(10)<br />
0.26<br />
(14)<br />
1.2<br />
(12)<br />
6.7<br />
(12)<br />
Proadifen<br />
3.9<br />
(18)<br />
22<br />
(16)<br />
86<br />
(14)<br />
414<br />
(9.8)<br />
0.032<br />
(4.3)<br />
0.23<br />
(2.9)<br />
1.2<br />
(5.3)<br />
6.3<br />
(4.6)<br />
Strychn<strong>in</strong>e<br />
3.2<br />
(18)<br />
21<br />
(13)<br />
93<br />
(20)<br />
437<br />
(13)<br />
0.015<br />
(7.6)<br />
0.17<br />
(3.7)<br />
1.4<br />
(4.8)<br />
7.0<br />
(0.8)<br />
Temazepam<br />
3.8<br />
(11)<br />
19<br />
(8.6)<br />
121<br />
(11)<br />
517<br />
(6.2)<br />
0.074<br />
(4.3)<br />
0.35<br />
(5.0)<br />
1.2<br />
(5.6)<br />
6.7<br />
(4.1)<br />
Tramadol<br />
3.5<br />
(18)<br />
19<br />
(13)<br />
96<br />
(20)<br />
446<br />
(13)<br />
0.036<br />
(4.6)<br />
0.29<br />
(3.7)<br />
1.1<br />
(4.8)<br />
6.5<br />
(0.8)<br />
Trazodone<br />
4.9<br />
(18)<br />
21<br />
(24)<br />
128<br />
(15)<br />
507<br />
(9.8)<br />
0.057<br />
(8.3)<br />
0.36<br />
(2.9)<br />
1.3<br />
(5.3)<br />
7.1<br />
(2.9)<br />
Verapamil<br />
5.1<br />
(18)<br />
21<br />
(24)<br />
132<br />
(15)<br />
510<br />
(9.8)<br />
0.026<br />
(8.3)<br />
0.23<br />
(2.9)<br />
1.2<br />
(5.3)<br />
6.4<br />
(2.9)<br />
Zolpidem<br />
4.9<br />
(13)<br />
19<br />
(8.4)<br />
113<br />
(6.5)<br />
487<br />
(6.2)<br />
0.061<br />
(5.7)<br />
0.33<br />
(5.0)<br />
1.3<br />
(5.8)<br />
6.9<br />
(4.1)<br />
Toxichem Krimtech 2011;78(Special Issue):236
Toxichem Krimtech 2011;78(Special Issue):237<br />
As it can be seen from Table 3, the standard deviation was always below 30 % and was lower<br />
for hair samples than for blood samples. As a criterion for accuracy, a deviation between <strong>of</strong><br />
-33 % and + 50 % (recovery between 67 and 150 %) should be acceptable consider<strong>in</strong>g the aim<br />
<strong>of</strong> this procedure: a rough estimation <strong>of</strong> the concentration. This is also fulfilled <strong>in</strong> the majority<br />
<strong>of</strong> the cases with the exception <strong>of</strong> some samples spiked with the lowest <strong>concentrations</strong> 5<br />
ng/ml <strong>in</strong> blood and 0.05 ng/mg <strong>in</strong> hair. These deviat<strong>in</strong>g results, which always found too low,<br />
are pr<strong>in</strong>ted <strong>in</strong> italic <strong>in</strong> Table 3. Furthermore, it is seen from Table 3 that the calculated <strong>concentrations</strong><br />
from the hair samples spiked with 1.0 ng/mg and with 5.0 ng/mg are always, and<br />
from the hair samples spiked with 0.25 ng/mg are <strong>in</strong> most cases above the spiked values. This<br />
one-sided deviation, which is not seen for the blood samples, <strong>in</strong>dicates a systematic error<br />
which could not yet been expla<strong>in</strong>ed.<br />
3.4. Comparison with results previously obta<strong>in</strong>ed <strong>in</strong> real cases by HPLC-DAD and GC-MS<br />
For exam<strong>in</strong>ation <strong>of</strong> the procedure under real conditions, blood samples which were previously<br />
analysed by HPLC-DAD, and hair samples, which were previously analyzed by GC-MS were<br />
re-<strong>in</strong>vestigated. Some examples are shown <strong>in</strong> Table 4. Also for these samples a sufficient<br />
agreement between the <strong>concentrations</strong> was found. Besides methodical errors also differences<br />
<strong>in</strong> sample preparation and decomposition dur<strong>in</strong>g longer storage time <strong>of</strong> the samples can be<br />
reasons for the differences.<br />
Tab. 4. Comparison <strong>of</strong> <strong>concentrations</strong> <strong>in</strong> blood and hair samples calculated by “Estimate<br />
concentration” (LC-QTOF-MS) and previously measured by HPLC-DAD or GC-MS.<br />
Case Sample Drug<br />
Concentration, ng/ml or ng/mg<br />
LC-QTOF-MS HPLC-DAD or GC-MS<br />
812/10 Blood Midazolam 22 20<br />
863/10 Blood Diazepam 22 15<br />
903/10 Blood Methadon 465 470<br />
904/10 Blood Diazepam 46 30<br />
904/10 Blood Nordazepam 38 170<br />
904/10 Blood Chlorporothixen 113 50<br />
914/10 Blood Doxep<strong>in</strong>e 330 700<br />
914/10 Blood Desmethyldoxep<strong>in</strong>e 214 190<br />
926/10 Blood Lidoca<strong>in</strong>e 530 640<br />
241/10 Hair Morph<strong>in</strong>e 3.0 3.9<br />
241/10 Hair 6-Acetylmorph<strong>in</strong>e 4.6 5.9<br />
241/10 Hair Code<strong>in</strong>e 0.8 0.86<br />
241/10 Hair Methadone 4.5 3.2<br />
241/10 Hair EDDP 0.44 0.47<br />
679/10 Hair Amphetam<strong>in</strong>e 6.3 7.55<br />
679/10 Hair MDMA 1.08 0.69<br />
679/10 Hair Coca<strong>in</strong>e 0.68 0.38<br />
679/10 Hair Benzoylecgon<strong>in</strong>e 0.10 0.05<br />
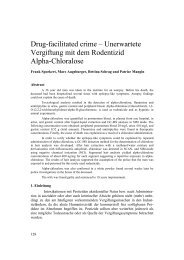
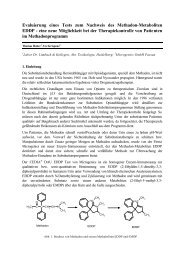
The extracted ion chromatograms obta<strong>in</strong>ed from a hair sample <strong>of</strong> a drug fatality are shown <strong>in</strong><br />
Fig. 3. Also <strong>in</strong> this case, a good agreement with previously measured results was found. It can<br />
be seen that small peaks (methadone, 0.03 ng/mg) and high peaks (6-acetylmorph<strong>in</strong>e,<br />
2.4 ng/mg) are equally well analyzed by this technique.
Toxichem Krimtech 2011;78(Special Issue):238<br />
Fig. 3. Extracted ion chromatogram <strong>of</strong> a hair from a drug fatality sample measured by<br />
LC-QTOF-MS. The <strong>concentrations</strong> were estimated by the tool “Estimate Concentration”. For<br />
comparison, the <strong>concentrations</strong> previously measured by GC-MS are given.<br />
4. Conclusion<br />
The systematic toxicological analysis with LC-QTOF-MS described <strong>in</strong> previous papers by the<br />
authors [1-4] was completed by a tool for fast <strong>determ<strong>in</strong>ation</strong> <strong>of</strong> approximate <strong>concentrations</strong> <strong>of</strong><br />
the identified substances <strong>in</strong> a s<strong>in</strong>gle run. The application to spiked and real blood and hair<br />
samples showed a satisfactory agreement with added <strong>concentrations</strong> or with HPLC-DAD and<br />
GC-MS results. The accuracy <strong>of</strong> the results is sufficient to dist<strong>in</strong>guish between no effect,<br />
therapeutic/natural, toxic and comatose-lethal <strong>concentrations</strong> <strong>in</strong> blood, e. g. <strong>in</strong> cl<strong>in</strong>ical emergency<br />
cases. Further work is <strong>in</strong> progress to further optimize the procedure and to test its applicability<br />
under practical conditions for a larger variety <strong>of</strong> substances. In particular limitations<br />
by chemical structure and matrix effects shall be evaluated more thoroughly. In addition<br />
to that, <strong>in</strong>vestigations about the applicability <strong>of</strong> the database LC-TOF-QUANT and the tool<br />
“Estimate Concentration” at different <strong>in</strong>struments are <strong>in</strong> progress.<br />
5. References<br />
[1] Broecker S, Herre S, Wüst B, Zweigenbaum J, Pragst F. Development and practical<br />
application <strong>of</strong> a CID accurate mass spectra library <strong>of</strong> more than 2,500 toxic compounds<br />
for systematic toxicological analysis by LC-QTOF-MS with data dependent acquisition,<br />
Anal. Bioanal. Chem. 400 (2011) 101-117.<br />
[2] Broecker S, Pragst F, Bakdash A, Herre S, Tsokos M. Comb<strong>in</strong>ed use <strong>of</strong> liquid<br />
chromatography-hybrid quadrupole time-<strong>of</strong>-flight mass spectrometry (LC-QTOF-MS)<br />
and high performance liquid chromatography with photodiode array detector (HPLC-<br />
DAD) <strong>in</strong> systematic toxicological analysis. Forensic Sci. Int. 2011, accepted for publication.<br />
[3] Broecker S, Herre S, Pragst F. General unknown screen<strong>in</strong>g <strong>in</strong> hair by liquid chromatography<br />
– hybrid quadrupole time-<strong>of</strong>-flight mass spectrometry (LC-QTOF-MS). Forensic Sci.<br />
Int. 2011, accepted for publication.
Toxichem Krimtech 2011;78(Special Issue):239<br />
[4] Broecker S, Herre S, Pragst F, Kuhlman F, Wüst B, Zweigenbaum J. Toxicological<br />
Screen<strong>in</strong>g with the Agilent LC/MS-QTOF and the Personal Compound Database and the<br />
Broecker, Herre and Pragst Accurate Mass Spectral Library, Agilent Application Note<br />
5990-6419EN Agilent Technologies, Inc., Santa Clara 2010.<br />
[5] Broecker S, Koch M, Pragst F. Detection <strong>of</strong> metabolites <strong>in</strong> the general unknown screen<strong>in</strong>g<br />
<strong>of</strong> hair by LC-QTOF-MS. Ann. Tox. Anal. 23 (2011) S1-12.<br />
[6] Pragst F, Herzler M, Erxleben B-T. Systematic toxicological analysis by high-performance<br />
liquid chromatography with diode array detection (HPLC-DAD), Cl<strong>in</strong>. Chem. Lab.<br />
Med. 42 (2004) 1325-1340.<br />
[7] Pragst F, Herzler M, Herre S, Erxleben B-T, Rothe M. UV-Spectra <strong>of</strong> Toxic Compounds.<br />
Database <strong>of</strong> Photodiode Array UV Spectra <strong>of</strong> Illegal and Therapeutic Drugs, Pesticides,<br />
Ecotoxic Substances and Other Po<strong>in</strong>sons, Verlag Dieter Helm, Heppenheim 2001; Suppl.<br />
Vol. 2007, Edition Toxicological Chemistry, Berl<strong>in</strong> 2008.<br />
[8] Kruve A, Herodes K, Leito I. Electrospray ionization matrix effect as an uncerta<strong>in</strong>ty<br />
source <strong>in</strong> HPLC/ESI-MS pesticide residue analysis. J. AOAC Int. 93 (2010) 306-314..<br />
[9] Souvera<strong>in</strong> S, Rudaz S, Veuthey J.L. Matrix effect <strong>in</strong> LC-ESI-MS and LC-APCI-MS with<br />
<strong>of</strong>f-l<strong>in</strong>e and on-l<strong>in</strong>e extraction procedures. J. Chromatogr. A 1058 (2004) 61-66.<br />
[10] Wu, J. et al. Study on the matrix effect <strong>in</strong> the <strong>determ<strong>in</strong>ation</strong> <strong>of</strong> selected pharmaceutical<br />
residues <strong>in</strong> seawater by solid-phase extraction and ultra-high-performance liquid chromatography-electrospray<br />
ionization low-energy collision-<strong>in</strong>duced dissociation tandem<br />
mass spectrometry. J. Chromatogr. A 1217 (2010) 1471-1475.