
Create successful ePaper yourself
Turn your PDF publications into a flip-book with our unique Google optimized e-Paper software.
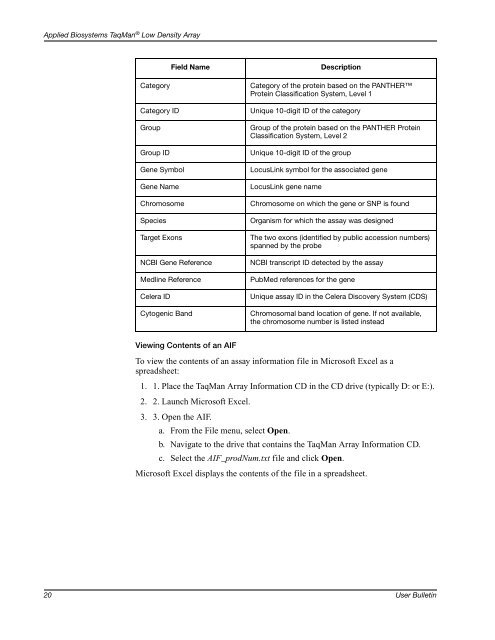
Applied Biosystems TaqMan ® Low Density Array<br />
Field Name<br />
Description<br />
Category<br />
Category ID<br />
Group<br />
Group ID<br />
Gene Symbol<br />
Gene Name<br />
Chromosome<br />
Species<br />
Target Exons<br />
NCBI Gene Reference<br />
Medline Reference<br />
Celera ID<br />
Cytogenic Band<br />
Category of the protein based on the PANTHER<br />
Protein Classification System, Level 1<br />
Unique 10-digit ID of the category<br />
Group of the protein based on the PANTHER Protein<br />
Classification System, Level 2<br />
Unique 10-digit ID of the group<br />
LocusLink symbol for the associated gene<br />
LocusLink gene name<br />
Chromosome on which the gene or SNP is found<br />
Organism for which the assay was designed<br />
The two exons (identified by public accession numbers)<br />
spanned by the probe<br />
NCBI transcript ID detected by the assay<br />
PubMed references for the gene<br />
Unique assay ID in the Celera Discovery System (CDS)<br />
Chromosomal band location of gene. If not available,<br />
the chromosome number is listed instead<br />
Viewing Contents of an AIF<br />
To view the contents of an assay information file in Microsoft Excel as a<br />
spreadsheet:<br />
1. 1. Place the TaqMan Array Information CD in the CD drive (typically D: or E:).<br />
2. 2. Launch Microsoft Excel.<br />
3. 3. Open the AIF.<br />
a. From the File menu, select Open.<br />
b. Navigate to the drive that contains the TaqMan Array Information CD.<br />
c. Select the AIF_prodNum.txt file and click Open.<br />
Microsoft Excel displays the contents of the file in a spreadsheet.<br />
20<br />
DRAFT<br />
User Bulletin<br />
February 3, 2006 11:10 am, 4371129.fm