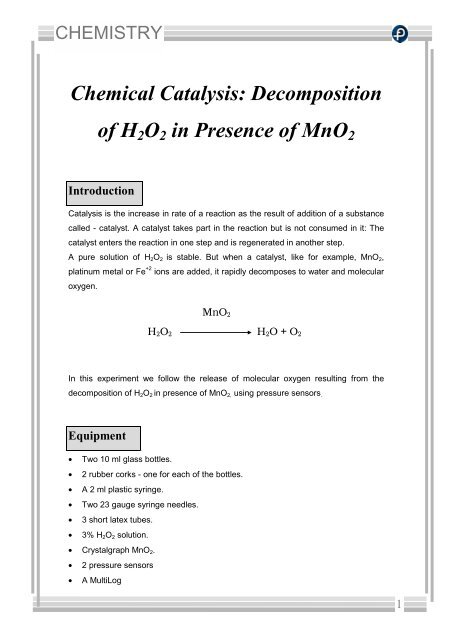
Chemical Catalysis: Decomposition of H2O2 in Presence of MnO2
Chemical Catalysis: Decomposition of H2O2 in Presence of MnO2
Chemical Catalysis: Decomposition of H2O2 in Presence of MnO2

Create successful ePaper yourself
Turn your PDF publications into a flip-book with our unique Google optimized e-Paper software.
CHEMISTRY<br />
<strong>Chemical</strong> <strong>Catalysis</strong>: <strong>Decomposition</strong><br />
<strong>of</strong> H 2 O 2 <strong>in</strong> <strong>Presence</strong> <strong>of</strong> MnO 2<br />
Introduction<br />
<strong>Catalysis</strong> is the <strong>in</strong>crease <strong>in</strong> rate <strong>of</strong> a reaction as the result <strong>of</strong> addition <strong>of</strong> a substance<br />
called - catalyst. A catalyst takes part <strong>in</strong> the reaction but is not consumed <strong>in</strong> it: The<br />
catalyst enters the reaction <strong>in</strong> one step and is regenerated <strong>in</strong> another step.<br />
A pure solution <strong>of</strong> H 2 O 2 is stable. But when a catalyst, like for example, MnO 2 ,<br />
plat<strong>in</strong>um metal or Fe +2 ions are added, it rapidly decomposes to water and molecular<br />
oxygen.<br />
MnO 2<br />
H 2 O 2 H 2 O + O 2<br />
In this experiment we follow the release <strong>of</strong> molecular oxygen result<strong>in</strong>g from the<br />
decomposition <strong>of</strong> H 2 O 2 <strong>in</strong> presence <strong>of</strong> MnO 2, us<strong>in</strong>g pressure sensors .<br />
Equipment<br />
• Two 10 ml glass bottles.<br />
• 2 rubber corks - one for each <strong>of</strong> the bottles.<br />
• A 2 ml plastic syr<strong>in</strong>ge.<br />
• Two 23 gauge syr<strong>in</strong>ge needles.<br />
• 3 short latex tubes.<br />
• 3% H 2 O 2 solution.<br />
• Crystalgraph MnO 2 .<br />
• 2 pressure sensors<br />
• A MultiLog<br />
1
CHEMISTRY<br />
• 3 Way Valve<br />
Equipment Setup Procedure<br />
1. Connect the MultiLog to the serial port <strong>of</strong> the computer and to the power supply.<br />
2. Connect the pressure sensors to the I/O 1 port and I/O 2 port <strong>of</strong> the MultiLog<br />
3. Assemble the equipment as illustrated <strong>in</strong> figure 1 below.<br />
4. Turn the MultiLog on. Set the MultiLog up accord<strong>in</strong>g to the setup specified below.<br />
You can set up the MultiLog <strong>in</strong> two ways:<br />
- use the keyboard <strong>of</strong> the MultiLog, or<br />
- select the Control Panel from the Logger menu.<br />
2
CHEMISTRY<br />
Fig. - 1<br />
3
CHEMISTRY<br />
A syr<strong>in</strong>ge needle (no 23) is <strong>in</strong>serted through the cork, till its tip projects somewhat<br />
out <strong>of</strong> the cork (figure 2)<br />
Fig. - 2<br />
To the other end <strong>of</strong> the syr<strong>in</strong>ge, project<strong>in</strong>g out <strong>of</strong> the upper side <strong>of</strong> the cork, a three<br />
way valve (the one used <strong>in</strong> <strong>in</strong>fusions) is attached via a very short latex tube (its<br />
length must be just enough to hold together the valve and the syr<strong>in</strong>ge). A pressure<br />
sensor is connected to the valve, through another short latex tube.<br />
Turn the valve till its open<strong>in</strong>g is directed vertically. In this position, air can flow<br />
through the valve. In order to stop air flow, turn the valve till its open<strong>in</strong>g reaches an<br />
horizontal position.<br />
To one <strong>of</strong> the corks, <strong>in</strong>sert an additional needle. A syr<strong>in</strong>ge filled with 6% H 2 O 2<br />
solution will be later attached to this needle.<br />
MultiLog Set Up<br />
• Input 1: Pressure<br />
• Input 2: Pressure<br />
• Rate: 1/sec.<br />
• Samples: 500.<br />
4
CHEMISTRY<br />
Experimental Procedure<br />
1. Mark the bottles with labels 1 and 2.<br />
2. Fill the plastic syr<strong>in</strong>ge with 2 ml <strong>of</strong> 3% H 2 O 2 solution.<br />
3. Add to bottle 1 - 8 ml water and 2 ml 3% H 2 O 2 solution.<br />
4. Add to bottle 2 - 8 ml water and a few crystals <strong>of</strong> MnO 2. Mix the solution gently<br />
5. Close tightly the bottles with the rubber corks.<br />
6. Attach to bottle 2, the syr<strong>in</strong>ge filled with H 2 O 2 solution, through the additional<br />
needle <strong>in</strong>serted through the cork.<br />
7. Start the MultiLog by press<strong>in</strong>g the Run/Stop key <strong>in</strong> the MultiLog’s keypad. You<br />
can also start the MultiLog us<strong>in</strong>g the DB-Lab s<strong>of</strong>tware: Press the Run button from<br />
the Control Panel, or the (Run) button from the left toolbar.<br />
8. Follow the pressure level registered on the computer monitor.<br />
9. Turn the valves attached to the corks <strong>of</strong> the two bottles, till an atmospheric<br />
pressure is obta<strong>in</strong>ed <strong>in</strong> both <strong>of</strong> them.(0 level is an atmospheric pressure: about<br />
1000 mBars).<br />
10.Inject the H 2 O 2 solution <strong>in</strong>to bottle 2 and immediately turn the valves <strong>of</strong> the two<br />
bottles, to stop air flow through them.<br />
11.Follow changes <strong>in</strong> pressure registered on the computer monitor dur<strong>in</strong>g the<br />
experiment.<br />
Data Analysis<br />
1. Calculate the change <strong>in</strong> pressure <strong>in</strong> each <strong>of</strong> the bottles: What was the <strong>in</strong>itial<br />
pressure value? The f<strong>in</strong>al value? The difference between the two values?<br />
Use the Markers or the Grid to f<strong>in</strong>d the appropriate values:<br />
Markers - double click with the left mouse button on the first required value. A marker will pop-up on<br />
the graph. Drag the marker with the left mouse button to the po<strong>in</strong>t on the graph you want to<br />
measure. Double click aga<strong>in</strong> on the second value. You get a second marker. Repeat the “drag”<br />
process with the second marker.<br />
You get both read<strong>in</strong>gs at the bottom <strong>of</strong> the display as well as the difference <strong>in</strong> the<br />
values - ∆t and ∆y.<br />
Grid - choose View\Display from the menu. Mark the option Grid <strong>in</strong> the Option Display W<strong>in</strong>dow.<br />
2. Calculate the reaction rate <strong>of</strong> H 2 O 2 decomposition:<br />
5
CHEMISTRY<br />
i) To receive a net reaction rate, prepare a “difference” graph: Reduce the<br />
graph obta<strong>in</strong>ed <strong>in</strong> the control system from that <strong>of</strong> the experimental system.<br />
From the Process menu select the More... option, and then select “-“<br />
(M<strong>in</strong>us).<br />
ii) Prepare a l<strong>in</strong>ear regression <strong>of</strong> this graph, by select<strong>in</strong>g L<strong>in</strong>ear Regression<br />
from the Process menu. The graph and the formula <strong>of</strong> the l<strong>in</strong>ear regression<br />
will appear <strong>in</strong> the same w<strong>in</strong>dow. The slope <strong>of</strong> the regression graph is the<br />
reaction rate measured <strong>in</strong> this experiment.<br />
An example <strong>of</strong> the graph obta<strong>in</strong>ed <strong>in</strong> this experiment is shown below:<br />
Questions<br />
1. How is the pressure developed <strong>in</strong> the experiment related to decomposition <strong>of</strong><br />
H 2 O 2 ?<br />
2. Compare the changes <strong>in</strong> pressure <strong>in</strong> the two bottles: Did you observe a change <strong>in</strong><br />
bottle 1? <strong>in</strong> bottle 2? Expla<strong>in</strong> the differences.<br />
3. Which <strong>of</strong> the bottles serves as a control? Expla<strong>in</strong>.<br />
4. Why is a control system needed <strong>in</strong> the experiment?<br />
6
CHEMISTRY<br />
5. What is the effect <strong>of</strong> add<strong>in</strong>g MnO 2 crystals to the experimental bottles?<br />
6. What can be the effect <strong>of</strong> add<strong>in</strong>g <strong>in</strong>creas<strong>in</strong>g amounts <strong>of</strong> MnO 2 on the reaction<br />
rate?<br />
7. What can be the effect <strong>of</strong> temperature rise <strong>in</strong> the bottles dur<strong>in</strong>g the experiment,<br />
on the measurement <strong>of</strong> H 2 O 2 decomposition rate?<br />
Further Suggestions<br />
1. Add <strong>in</strong>creas<strong>in</strong>g amounts <strong>of</strong> MnO 2 to the reaction mixture and follow the reaction<br />
developed <strong>in</strong> each case.<br />
2. Calculate the reaction rate obta<strong>in</strong>ed <strong>in</strong> each experiment.<br />
3. Compare the effect <strong>of</strong> different types <strong>of</strong> chemical catalysts: HBr, HI, Fe +2 ions,<br />
plat<strong>in</strong>um metal.<br />
4. Change the concentration <strong>of</strong> H 2 O 2 added to the reaction mixture. Compare the<br />
effect <strong>of</strong> reactant concentrations on the reaction rate, with that <strong>of</strong> the catalyst.<br />
5. Follow temperature changes occurr<strong>in</strong>g dur<strong>in</strong>g the reaction. Evaluate the effect <strong>of</strong><br />
temperature on the decomposition rate <strong>of</strong> H 2 O 2<br />
Advantages <strong>of</strong> Us<strong>in</strong>g the MultiLog <strong>in</strong><br />
Study<strong>in</strong>g <strong>Chemical</strong> <strong>Catalysis</strong><br />
1. Real-time measurements <strong>of</strong> a catalysis reaction - the students watch bubbles <strong>of</strong><br />
oxygen released dur<strong>in</strong>g the experiment, and receive immediately the quantitative<br />
data <strong>of</strong> the process.<br />
2. Use <strong>of</strong> an easy to operate system, enabl<strong>in</strong>g the students to design and perform<br />
experiments <strong>in</strong> order to answer problems <strong>of</strong> <strong>in</strong>terest for them.<br />
3. Learn<strong>in</strong>g and compar<strong>in</strong>g effects <strong>of</strong> chemical catalysts by perform<strong>in</strong>g short and<br />
simple experiments and analyz<strong>in</strong>g the results.<br />
4. Use <strong>of</strong> a sensitive pressure sensor enabl<strong>in</strong>g detection <strong>of</strong> small changes.<br />
5. Simple and convenient means to calculate graph slopes and net reaction rate.<br />
7