The Glorious Glasgow Haskell Compilation System User's Guide ...
The Glorious Glasgow Haskell Compilation System User's Guide ...
The Glorious Glasgow Haskell Compilation System User's Guide ...

You also want an ePaper? Increase the reach of your titles
YUMPU automatically turns print PDFs into web optimized ePapers that Google loves.
<strong>The</strong> <strong>Glorious</strong> <strong>Glasgow</strong> <strong>Haskell</strong><br />
<strong>Compilation</strong> <strong>System</strong> User’s <strong>Guide</strong>,<br />
Version 6.10.4 25 / 224<br />
[qsort.hs:5:7-47] *Main> :set stop :list<br />
[qsort.hs:5:7-47] *Main> :step<br />
Stopped at qsort.hs:5:14-46<br />
_result :: [Integer]<br />
4<br />
5 main = print (qsort [8, 4, 0, 3, 1, 23, 11, 18])<br />
6<br />
[qsort.hs:5:14-46] *Main><br />
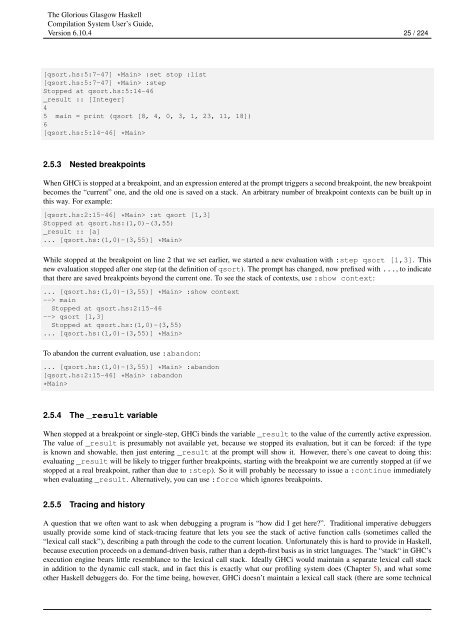
2.5.3 Nested breakpoints<br />
When GHCi is stopped at a breakpoint, and an expression entered at the prompt triggers a second breakpoint, the new breakpoint<br />
becomes the “current” one, and the old one is saved on a stack. An arbitrary number of breakpoint contexts can be built up in<br />
this way. For example:<br />
[qsort.hs:2:15-46] *Main> :st qsort [1,3]<br />
Stopped at qsort.hs:(1,0)-(3,55)<br />
_result :: [a]<br />
... [qsort.hs:(1,0)-(3,55)] *Main><br />
While stopped at the breakpoint on line 2 that we set earlier, we started a new evaluation with :step qsort [1,3]. This<br />
new evaluation stopped after one step (at the definition of qsort). <strong>The</strong> prompt has changed, now prefixed with ..., to indicate<br />
that there are saved breakpoints beyond the current one. To see the stack of contexts, use :show context:<br />
... [qsort.hs:(1,0)-(3,55)] *Main> :show context<br />
--> main<br />
Stopped at qsort.hs:2:15-46<br />
--> qsort [1,3]<br />
Stopped at qsort.hs:(1,0)-(3,55)<br />
... [qsort.hs:(1,0)-(3,55)] *Main><br />
To abandon the current evaluation, use :abandon:<br />
... [qsort.hs:(1,0)-(3,55)] *Main> :abandon<br />
[qsort.hs:2:15-46] *Main> :abandon<br />
*Main><br />
2.5.4 <strong>The</strong> _result variable<br />
When stopped at a breakpoint or single-step, GHCi binds the variable _result to the value of the currently active expression.<br />
<strong>The</strong> value of _result is presumably not available yet, because we stopped its evaluation, but it can be forced: if the type<br />
is known and showable, then just entering _result at the prompt will show it. However, there’s one caveat to doing this:<br />
evaluating _result will be likely to trigger further breakpoints, starting with the breakpoint we are currently stopped at (if we<br />
stopped at a real breakpoint, rather than due to :step). So it will probably be necessary to issue a :continue immediately<br />
when evaluating _result. Alternatively, you can use :force which ignores breakpoints.<br />
2.5.5 Tracing and history<br />
A question that we often want to ask when debugging a program is “how did I get here?”. Traditional imperative debuggers<br />
usually provide some kind of stack-tracing feature that lets you see the stack of active function calls (sometimes called the<br />
“lexical call stack”), describing a path through the code to the current location. Unfortunately this is hard to provide in <strong>Haskell</strong>,<br />
because execution proceeds on a demand-driven basis, rather than a depth-first basis as in strict languages. <strong>The</strong> “stack“ in GHC’s<br />
execution engine bears little resemblance to the lexical call stack. Ideally GHCi would maintain a separate lexical call stack<br />
in addition to the dynamic call stack, and in fact this is exactly what our profiling system does (Chapter 5), and what some<br />
other <strong>Haskell</strong> debuggers do. For the time being, however, GHCi doesn’t maintain a lexical call stack (there are some technical